Abstract
Structural characterization of protein-protein interactions is essential for our ability to understand life processes. However, only a fraction of known proteins have experimentally determined structures. Such structures provide templates for modeling of a large part of the proteome, where individual proteins can be docked by template-free or template-based techniques. Still, the sensitivity of the docking methods to the inherent inaccuracies of protein models, as opposed to the experimentally determined high-resolution structures, remains largely untested, primarily due to the absence of appropriate benchmark set(s). Structures in such a set should have pre-defined inaccuracy levels and, at the same time, resemble actual protein models in terms of structural motifs/packing. The set should also be large enough to ensure statistical reliability of the benchmarking results. We present a major update of the previously developed benchmark set of protein models. For each interactor, six models were generated with the model-to-native Cα RMSD in the 1 to 6 Å range. The models in the set were generated by a new approach, which corresponds to the actual modeling of new protein structures in the “real case scenario,” as opposed to the previous set, where a significant number of structures were model-like only. In addition, the larger number of complexes (165 vs. 63 in the previous set) increases the statistical reliability of the benchmarking. We estimated the highest accuracy of the predicted complexes (according to CAPRI criteria), which can be attained using the benchmark structures. The set is available at http://dockground.bioinformatics.ku.edu.
Keywords: protein recognition, protein modeling, structure prediction, protein interactions, modeling of protein complexes
INTRODUCTION
Protein-protein interactions play a central role in life processes at the molecular level. The structural characterization of these interactions is essential for our ability to understand these processes and to utilize this knowledge in biology and medicine. Limitations of experimental techniques to determine the structure of protein-protein complexes leave the vast majority of these complexes to be determined by computational modeling. The modeling is also important for revealing the mechanisms of protein association. The protein-protein docking problem is one of the focal points of activity in computational structural biology. The three-dimensional structure of a protein-protein complex, generally, is more difficult to determine experimentally than the structure of an individual protein. Adequate computational techniques to model protein interactions are important because of the growing number of known protein structures, particularly in the context of structural genomics. The rapidly growing Protein Data Bank (PDB) provides templates for modeling of a large part of the proteome,1,2 where individual proteins can be docked by template-free or template-based techniques.3–8
However, sensitivity of the docking methods to the inherent inaccuracies of protein models, as opposed to the experimentally determined high-resolution structures, remains largely untested, primarily due to the absence of appropriate benchmark set(s). Structures in such a set should have pre-defined inaccuracy levels and, at the same time, resemble actual protein models in terms of structural motifs/packing. The set should also be large enough to ensure statistical reliability of the benchmarking results. Traditionally, the existing protein-protein benchmark sets contained, only X-ray structures.9,10 An earlier study on low-resolution free docking of protein models utilized simulated (not actual) protein models – artificially distorted structures with limited similarity to homology models.11
Recently we presented a set of protein models12 based on 63 binary protein-protein complexes from the Dockground resource,9 which have experimentally resolved unbound structures for both interactors. This allowed comparison to the “classical” problem of docking unbound crystallographically determined structures. However, only 38% of structures in the dataset were true homology models and the rest was generated by the Nudged Elastic Band (NEB) algorithm.13,14 In this paper, we report a new, > 2.5 times larger set of protein models with six levels of accuracy. All structures were built by the I-TASSER modeling package15,16 without any additional procedure for generating intermediate structures. Thus, the new set contains a much larger number of complexes, all of them bona fide models, providing an objective, statistically significant benchmark for systematic testing protein-protein docking approaches on modeled structures.
METHODS
Selection of X-ray structures
We used the built-in engine of the Dockground resource17 (available at http://dockground.bioinformatics.ku.edu) to generate the initial set of binary hetero complexes with moderate and high resolution (3.5 Å and better) crystallographically determined structures and a well-defined interface (≥ 250 Å2 of buried solvent accessible surface area per chain, and ≥ 10 interface residues in each chain). Redundancy was removed by the sequence identity threshold of 30% between a pair of chains. Complexes with a protein containing < 3 secondary structure elements were excluded. For computational efficiency of the subsequent modeling, we also purged complexes with monomers of substantially different sizes. In addition to the computational aspect, the level of structural accuracy characterized by the full structure RMSD depends on the size of the protein: models of shorter proteins may be significantly more distorted in terms of the secondary structure content, whereas models of longer proteins may have significantly larger local deviations. Thus, we set the maximum ratio of the protein sizes to 3, eliminating ~25% of structures from the pool of complexes (see Supporting Information, Figure S1). Finally, the set was visually inspected to remove complexes with coiled coil interfaces and those with interwoven chains. The cleaned set subjected to the modeling procedure contained 293 binary complexes.
Modeling procedure
The flowchart of the protocol for the model generation is shown in Figure 1. Sequences extracted from SEQRES tag of the selected PDB files were submitted to the stand-alone I-TASSER 1.0 suite of programs.15,16 To ensure varying levels of model accuracy, the package was run several times with different cut-off values for the sequence identity between target and putative templates. We varied this parameter from 1 to 0.2 with 0.1 step plus the additional value of 0.25 introduced to diversify models build at sequence identity levels close to the threshold of homology detection.18 Even if the native structure was selected as the top-ranked template at the threading stage, it was further subjected to the structural assembly (along with other high-ranked templates), and subsequent model refinement (see Ref.15 for a detailed description of I-TASSER protocol). This introduced structural variations into the final models even at the cut-off value 1.
Figure 1.
Flowchart of the model generating procedure.
The first modeling stage produced on average ~ 104–105 intermediate Cα models per protein. These models were grouped based on their Cα residual mean square deviation (RMSD) to the native X-ray structure using RMSD window 0.05 Å starting from 0 Å. The structure with the lowest value of I-TASSER internal energy was selected as representative for each group. To obtain the final full-atom structures, the representative models were submitted to the ModRefiner program (part of the I-TASSER software suite).19 The Cα RMSD between full-atom models and the native structures were re-calculated and the models within the RMSD intervals 1±0.2 Å, 2±0.2 Å, …, 6±0.2 Å were selected. If several models of the same protein had RMSD in the same interval, the model with the lowest energy, according to ModRefiner, was selected. The procedure generated 3266 models for the initial set (92.8 % of the total 293×6×2 intended models). The final benchmark set was compiled from the complexes with both proteins having models in all six RMSD intervals (165 complexes).
Analysis of model structures
The relative content of the secondary structure elements in a structure was calculated as the number of residues in α-helices and β-strands in a model divided by the corresponding number in the native structure. The secondary structure residues were identified by the DSSP program.20,21 For the analysis of the interface accuracy, models where superimposed onto corresponding X-ray structures by minimizing all Cα RMSD,22,23 and the model/X-ray RMSD of the residues at the interface in the co-crystallized complex was calculated.
RESULTS AND DISCUSSION
The new benchmark is a significant and qualitative improvement over the previously released set 1.12 It contains (a) a much larger number of complexes, which is important for a statistical significance of the benchmarking, and (b) all complexes in the set are true models, which is essential for the benchmarking authenticity. Based on the benchmark structures, we estimated the highest accuracy of the predicted complexes, according to CAPRI criteria.
Comparison with the previous benchmark set
Model benchmark 2 is significantly larger than benchmark 1. The set of models presented in this paper contains 165 complexes vs. 63 complexes in the previous set.12 Thus, the benchmarking results based on this set will be statistically more reliable (while the previous models set allows a direct comparison with the docking of unbound X-ray structures). The difference in the initial choice of complexes for the two sets (bound and unbound Dockground parts for the new and the old sets, respectively) caused a small overlap between the sets (only two complexes are shared by the sets: 1oph, chains A and B, and 2a5t, chains A and B). Because of the difference in the final model selection, the models from the new set tend to have slightly smaller TM-scores when aligned to the corresponding X-ray structure, compared to the models from the previous set (Figure S2). In the previous set, preference was given to models with a more uniform distribution of distortions along the protein chain. Thus, more residues were involved in the alignment, resulting in higher TM-scores. No such filter was used to compile the new set, which is more adequate to the real case scenario of modeling/docking.
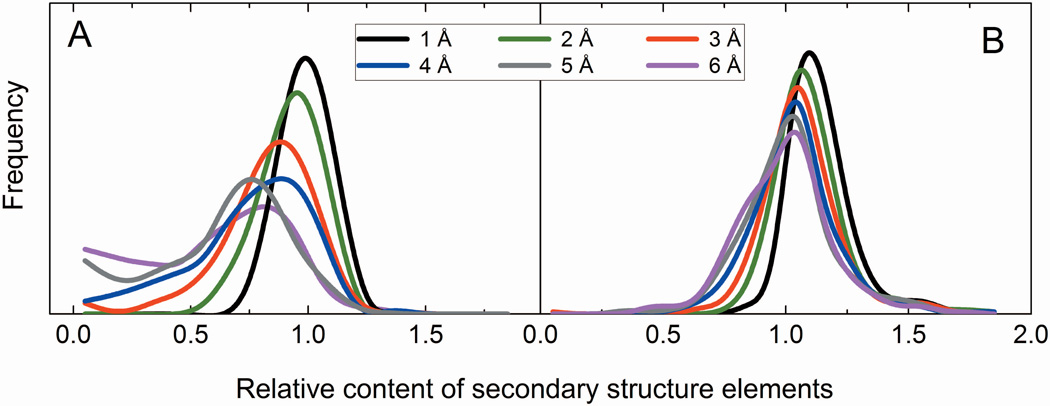
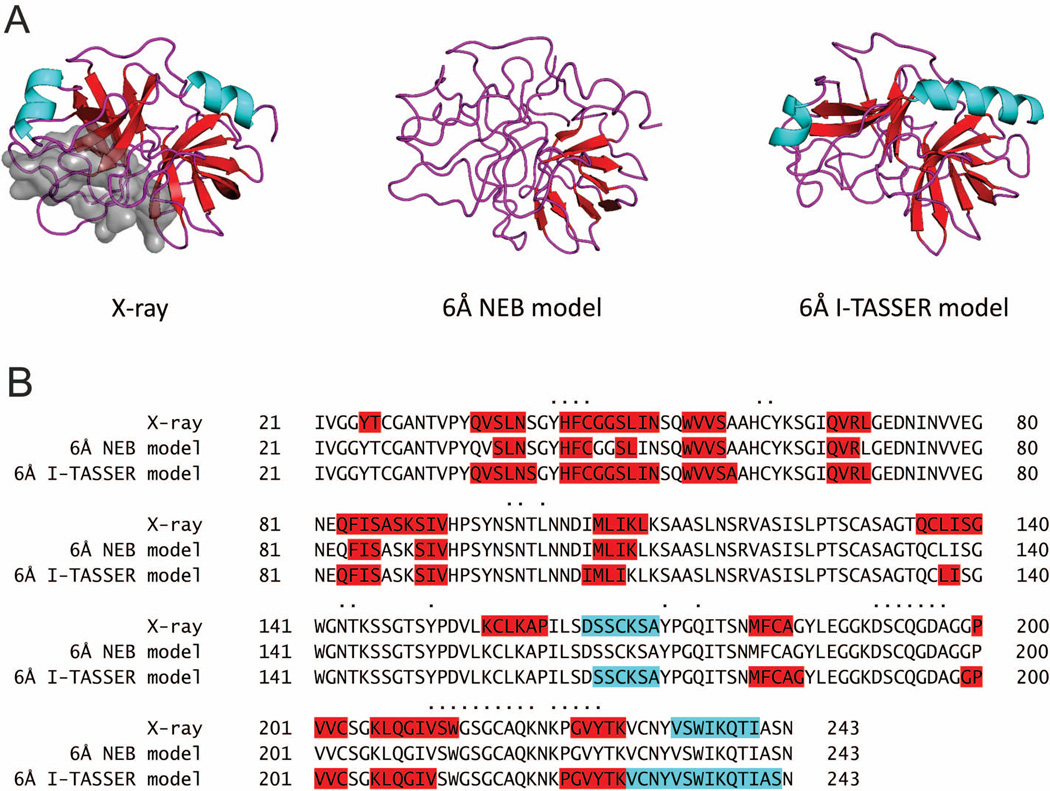
All structures in the new benchmark set are true models. After the first stage (Figure 1), the modeling protocol generated ~550 models on average per X-ray structure for each of the six RMSD bins. These models were statistically almost uniformly distributed over all accuracy levels. For each particular protein, however, structural diversity of the models depends heavily on the availability and the spectrum of the PDB templates for that protein. To build homology-like models for the RMSD values not covered by the template pool, in our previous study12 we utilized NEB procedure.13,14 In terms of GDT_TS score,24,25 the NEB models were similar to the models submitted to round IX of CASP.12 However, the analysis of the NEB structures (“simulated” models) revealed that their local characteristics (deviations of Cα coordinates in models from the X-ray structures) are different from those observed in the real models. Figure 2 shows distributions of the relative secondary structure content (see Methods) for the models in the previous and the new sets. In the previous set (Figure 2A), the distribution peak shifts to the left and the standard deviation increases with the increase of models' inaccuracy. This indicates the reduction of the secondary structure content. The 1 Å RMSD models are closest to the native structures (corresponding distribution has its maximum close to 1, with small standard deviation). The models from the new set (Figure 2B) have more consistent distributions, with less spread in both the averages and the standard deviations. A small shift of model distributions to the right from the X-ray distribution indicates that secondary structure elements in models tend to be longer than in the native X-ray structures. This is likely to be inherent to the I-TASSER algorithm, which by design puts an emphasis on the secondary structure elements during model refinement. Figure 3A shows an example: 6 Å RMSD models of 1oph, chain B generated by the NEB and I-TASSER. It clearly shows that the secondary structures are substantially distorted in the NEB model, whereas well preserved in the I-TASSER model. The secondary structure content of the I-TASSER model is also close to the native X-ray structure as demonstrated by the highlighted portions of the sequence alignments in Figure 3B. We are not aware of any computational technique that can reliably simulate intermediate protein structures with real (e.g. homology, threading, etc.) model-like properties. Thus, we did not use any procedures to generate/simulate intermediate structures with set RMSD values between the I-TASSER decoys. Consequently, only the reduced number of 165 complexes, which have all six models for both proteins generated by the same true modeling procedure, was included in the final set.
Figure 2.
Relative content of the secondary structure elements in models of different accuracy. The plots for the old (A) and the new (B) sets show distribution of the number of residues in α-helices and β-strands in a model divided by the corresponding number in the native structure. The curves were smoothed using Savitzky-Golay method in the Origin 2015 software package.
Figure 3.
Comparison of X-ray, NEB and I-TASSER structures. Secondary structure content for the PDB entry 1oph, chain B; α-helices and β-strands are in cyan and red, respectively. The interface is shown by gray surface (A) and dots (B). The secondary structure is substantially distorted in the NEB model, whereas well preserved and close to the X-ray structure in the I-TASSER model.
Accuracy limits for the docking predictions
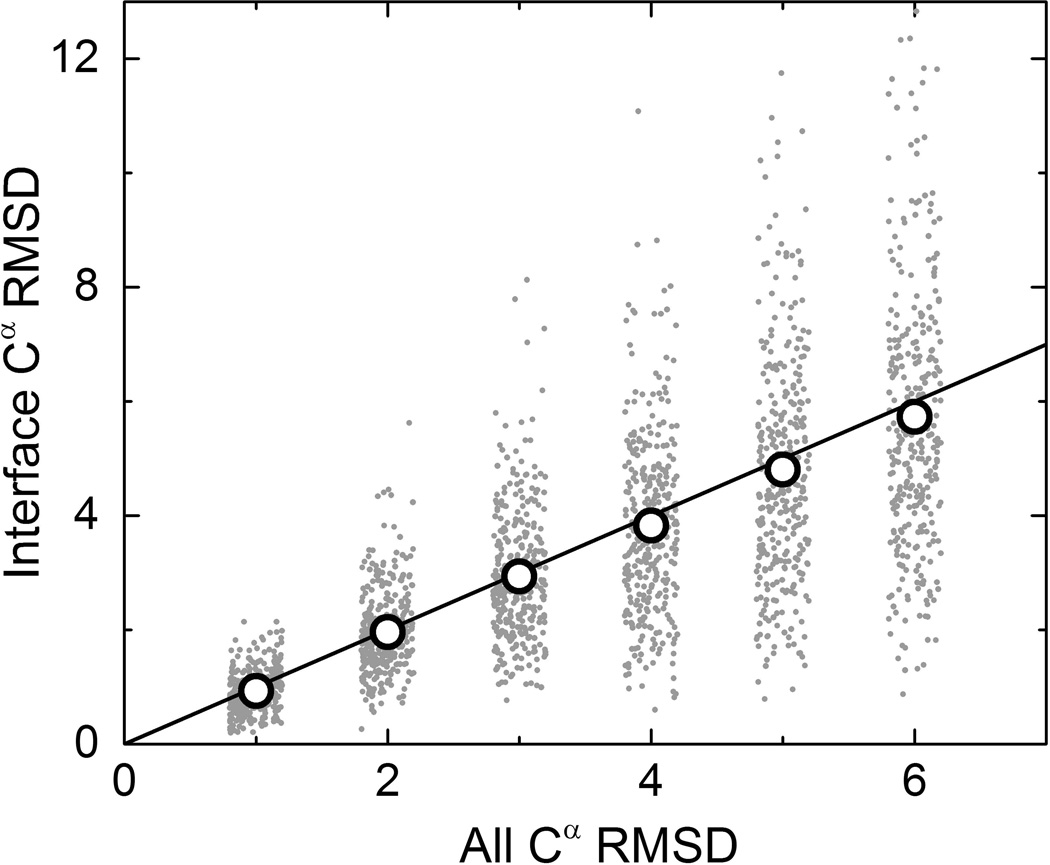
Although the majority of models preserve their global fold (TM-scores to X-ray > 0.5), their local structural distortion can be substantial. For 42% of modeled structures, RMSD of the interface residues is larger than the RMSD of the entire structure. At the same time, for approximately the same number of models, interfaces are far more accurate than the entire model (Figure 4). Also, average interface RMSD (open circles in Figure 4) resemble very closely all Cα RMSD, indicating that, on average, interfaces are as distorted as the full structure. Interface RMSD values calculated from the alignments generated by TM-score26 were very similar to the ones in Figure 4 (data not shown).
Figure 4.
Correlation of interface and full structure accuracy of the models. The y=x line is for reference. Open circles are average interface RMSD of all models at each level of full structure accuracy.
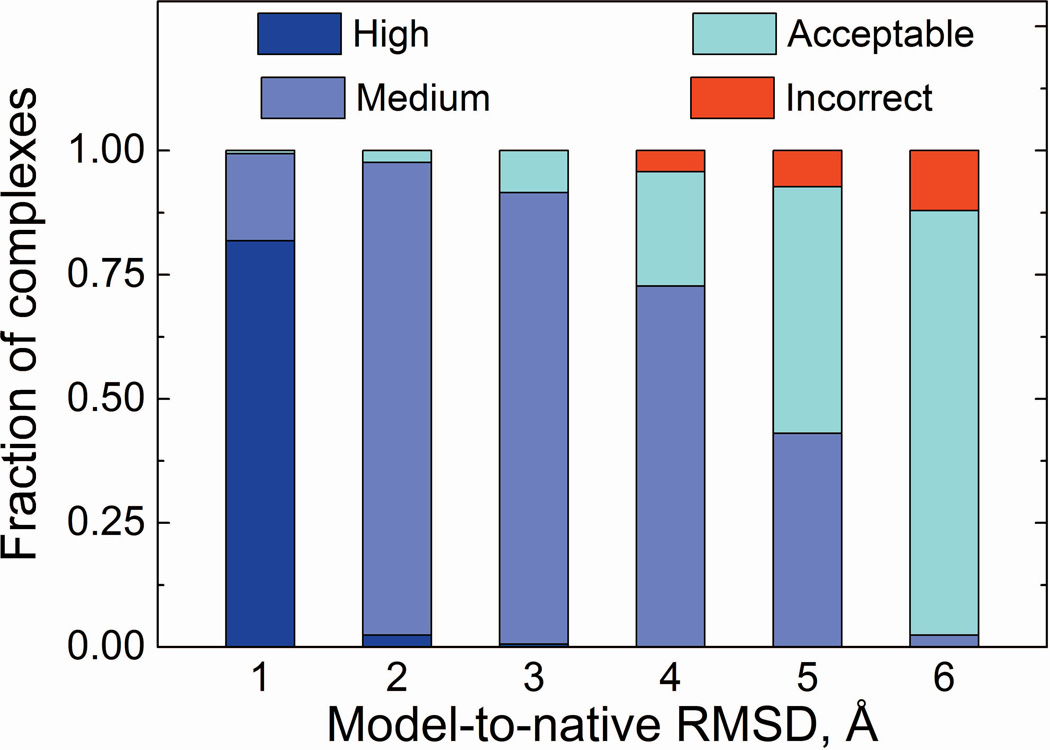
These local structural variations limit the accuracy of docking. To qualitatively estimate that limit, we superimposed two models of the complex monomers (for simplicity, we used pair of the models with the same model-to-native RMSD) onto corresponding X-ray structures, by minimizing Cα-Cα RMSD22,23 (henceforth referred to as “ideal” model complexes). Thus, for each X-ray complex in the set we obtained six model structures, the quality of which was further assessed by CAPRI criteria27 (except clashes). The vast majority of complexes built with models of ≤ 4 Å RMSD are of high and medium accuracy (Figure 5), with only seven complexes falling into the incorrect category. Models of lower accuracy produce complexes predominantly of acceptable accuracy (82 and 141 for 5 and 6 Å RMSD, respectively). Only 12 (5 Å models) and 20 (6 Å models) complexes were incorrect, mainly due to the rearrangement in packing of the interface loop(s), which leads to the distortion of the native contacts (the fraction of correctly predicted contacts drops below 10% in the incorrect models) although ligand RMSD remains < 10 Å (or interface RMSD < 4 Å). The results (Figure 5) weakly depend on how a model and the X-ray structures are aligned. The interface Cα RMSD values for model/native structure superposition by TM-score and by RMSD minimization were similar (Figure S3). For example, when alignment was performed by TM-score, the number of models in each CAPRI category changed by ~10% (Figure S4).
Figure 5.
Quality of model-model complexes according to CAPRI criteria.
In the real-case modeling scenario, prior to docking one would not know what protein residues belong to the interface. The whole paradigm of docking is to predict these residues (along with their contacts). Thus, all Cα RMSD is an appropriate measure of model's accuracy. However, we also analyzed the quality of the “ideal” model complexes in terms of CAPRI criteria, as it relates to the interface RMSD (Figure S5). Complexes of high and medium accuracy could be built from the higher accuracy protein models (1 – 4 Å global RMSD), whereas lower accuracy models (6 Å global RMSD) produced few medium accuracy complexes for small interface RMSD (1 – 3 Å).
We have also evaluated the quality of the “ideal” model complexes generated from all protein models at set accuracy levels. All complexes within each accuracy bin were either in the same or in, at most, two adjacent CAPRI quality categories. Thus, the selected model structures in our set are representative for the entire model pool (an example of the results for two complexes is in Figure S6).
Set content and availability
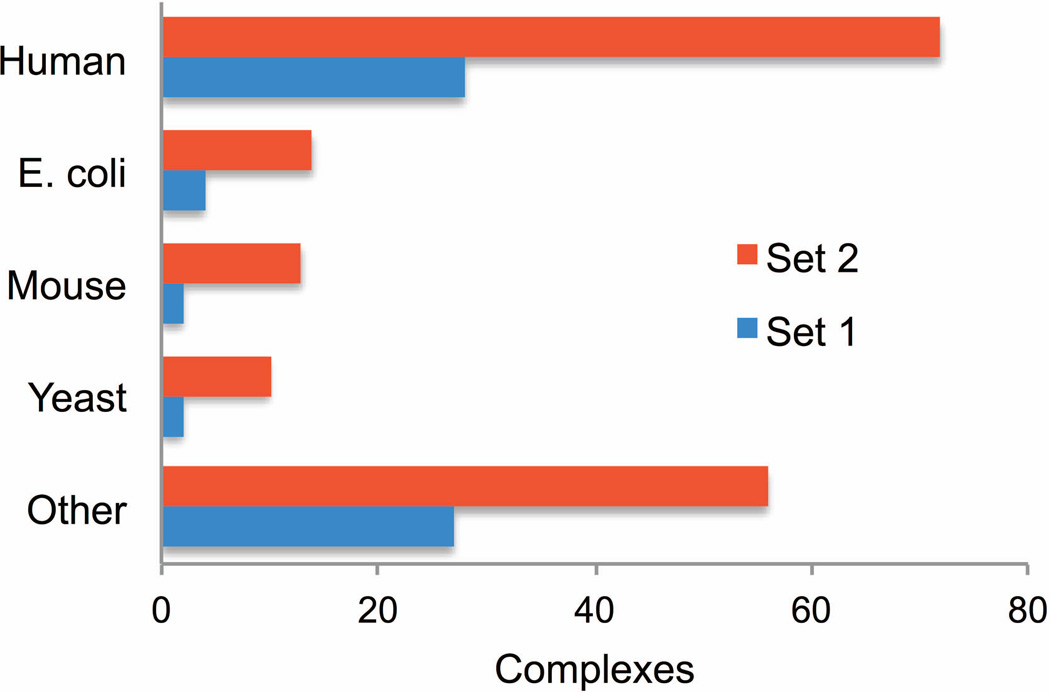
The 165 complexes in the benchmark set originate from a variety of organisms (Figure 6), which ensures representativeness of the results obtained using this set. The set is available in the Dockground resource (Figure 7) as a single zip archive. The archive contains the text file with the list of monomers in the set, the README file with the explanation of nomenclature for the file and folder names, and 330 folders, one for each monomer in the set. Each folder contains six PDB formatted files of the monomer models along with the original PDB structure. Residue numbers correspond to SEQRES section of the original PDB file.
Figure 6.
Source organisms for complexes in the previous and the new benchmark sets. Four most highly populated organisms are shown.
Figure 7.
Dockground resource for protein recognition studies.
Supplementary Material
ACKNOWLEDGMENTS
This study was supported by NIH grant R01GM074255 and NSF grant DBI1262621. Calculations were conducted in part on ITTC computer cluster at The University of Kansas.
REFERENCES
- 1.Levitt M. Nature of the protein universe. Proc Natl Acad Sci USA. 2009;106:11079–11084. doi: 10.1073/pnas.0905029106. [DOI] [PMC free article] [PubMed] [Google Scholar]
- 2.Schwede T. Protein modeling: What happened to the “protein structure gap”? Structure. 2013;21:1531–1540. doi: 10.1016/j.str.2013.08.007. [DOI] [PMC free article] [PubMed] [Google Scholar]
- 3.Vakser IA. Protein-protein docking: From interaction to interactome. Biophys J. 2014;107:1785–1793. doi: 10.1016/j.bpj.2014.08.033. [DOI] [PMC free article] [PubMed] [Google Scholar]
- 4.Vakser IA. Low-resolution structural modeling of protein interactome. Curr Opin Struct Biol. 2013;23:198–205. doi: 10.1016/j.sbi.2012.12.003. [DOI] [PMC free article] [PubMed] [Google Scholar]
- 5.Aloy P, Pichaud M, Russell RB. Protein complexes: Structure prediction challenges for the 21st century. Curr Opin Struct Biol. 2005;15:15–22. doi: 10.1016/j.sbi.2005.01.012. [DOI] [PubMed] [Google Scholar]
- 6.Szilagyi A, Zhang Y. Template-based structure modeling of protein–protein interactions. Curr Opin Struct Biol. 2014;24:10–23. doi: 10.1016/j.sbi.2013.11.005. [DOI] [PMC free article] [PubMed] [Google Scholar]
- 7.Kuzu G, Keskin O, Gursoy A, Nussinov R. Constructing structural networks of signaling pathways on the proteome scale. Curr Opin Struct Biol. 2012;22:367–377. doi: 10.1016/j.sbi.2012.04.004. [DOI] [PubMed] [Google Scholar]
- 8.Dey F, Zhang QC, Petrey D, Honig B. Toward a “structural BLAST”: Using structural relationships to infer function. Protein Sci. 2013;22:359–366. doi: 10.1002/pro.2225. [DOI] [PMC free article] [PubMed] [Google Scholar]
- 9.Gao Y, Douguet D, Tovchigrechko A, Vakser IA. DOCKGROUND system of databases for protein recognition studies: Unbound structures for docking. Proteins. 2007;69:845–851. doi: 10.1002/prot.21714. [DOI] [PubMed] [Google Scholar]
- 10.Hwang H, Vreven T, Janin J, Weng Z. Protein–protein docking benchmark version 4.0. Proteins. 2010;78:3111–3114. doi: 10.1002/prot.22830. [DOI] [PMC free article] [PubMed] [Google Scholar]
- 11.Tovchigrechko A, Wells CA, Vakser IA. Docking of protein models. Protein Sci. 2002;11:1888–1896. doi: 10.1110/ps.4730102. [DOI] [PMC free article] [PubMed] [Google Scholar]
- 12.Anishchenko I, Kundrotas PJ, Tuzikov AV, Vakser IA. Protein models: The Grand Challenge of protein docking. Proteins. 2014;82:278–287. doi: 10.1002/prot.24385. [DOI] [PMC free article] [PubMed] [Google Scholar]
- 13.Elber R, Karplus M. A method for determining reaction paths in large molecules - application to myoglobin. Chem Phys Lett. 1987;139:375–380. [Google Scholar]
- 14.Chu JW, Trout BL, Brooks BR. A super-linear minimization scheme for the nudged elastic band method. J Chem Phys. 2003;119:12708–12717. [Google Scholar]
- 15.Roy A, Kucukural A, Zhang Y. I-TASSER: A unified platform for automated protein structure and function prediction. Nature Protocols. 2010;5:725–738. doi: 10.1038/nprot.2010.5. [DOI] [PMC free article] [PubMed] [Google Scholar]
- 16.Zhang Y. I-TASSER server for protein 3D structure prediction. BMC Bioinformatics. 2008;9:40. doi: 10.1186/1471-2105-9-40. [DOI] [PMC free article] [PubMed] [Google Scholar]
- 17.Douguet D, Chen HC, Tovchigrechko A, Vakser IA. DOCKGROUND resource for studying protein-protein interfaces. Bioinformatics. 2006;22:2612–2618. doi: 10.1093/bioinformatics/btl447. [DOI] [PubMed] [Google Scholar]
- 18.Chung SY, Subbiah S. A structural explanation for the twilight zone of protein sequence homology. Structure. 1996;4:1123–1127. doi: 10.1016/s0969-2126(96)00119-0. [DOI] [PubMed] [Google Scholar]
- 19.Xu D, Zhang Y. Improving the physical realism and structural accuracy of protein models by a two-step atomic-level energy minimization. Biophys J. 2011;101:2525–2534. doi: 10.1016/j.bpj.2011.10.024. [DOI] [PMC free article] [PubMed] [Google Scholar]
- 20.Kabsch W, Sander C. Dictionary of protein secondary structure: Pattern recognition of hydrogen-bonded and geometrical features. Biopolymers. 1983;22:2577–2637. doi: 10.1002/bip.360221211. [DOI] [PubMed] [Google Scholar]
- 21.Joosten RP, Beek TA, Krieger E, Hekkelman ML, Hooft RW, Schneider R, Sander C, Vriend G. A series of PDB related databases for everyday needs. Nucl Acid Res. 2011;39:D411–D419. doi: 10.1093/nar/gkq1105. [DOI] [PMC free article] [PubMed] [Google Scholar]
- 22.Kabsch W. A solution for the best rotation to relate two sets of vectors. Acta Cryst A. 1976;32:922–923. [Google Scholar]
- 23.Kabsch W. A discussion of the solution for the best rotation to relate two sets of vectors. Acta Cryst A. 1978;34:827–828. [Google Scholar]
- 24.Zemla A. LGA: A method for finding 3D similarities in protein structures. Nucl Acid Res. 2003;31:3370–3374. doi: 10.1093/nar/gkg571. [DOI] [PMC free article] [PubMed] [Google Scholar]
- 25.Moult J, Fidelis K, Kryshtafovych A, Tramontano A. Critical assessment of methods of protein structure prediction (CASP)—Round IX. Proteins. 2011;79(Suppl 10):1–5. doi: 10.1002/prot.23200. [DOI] [PMC free article] [PubMed] [Google Scholar]
- 26.Zhang Y, Skolnick J. Scoring function for automated assessment of protein structure template quality. Proteins. 2004;57:702–710. doi: 10.1002/prot.20264. [DOI] [PubMed] [Google Scholar]
- 27.Lensink MF, Wodak SJ. Docking, scoring, and affinity prediction in CAPRI. Proteins. 2013;81:2082–2095. doi: 10.1002/prot.24428. [DOI] [PubMed] [Google Scholar]
Associated Data
This section collects any data citations, data availability statements, or supplementary materials included in this article.


