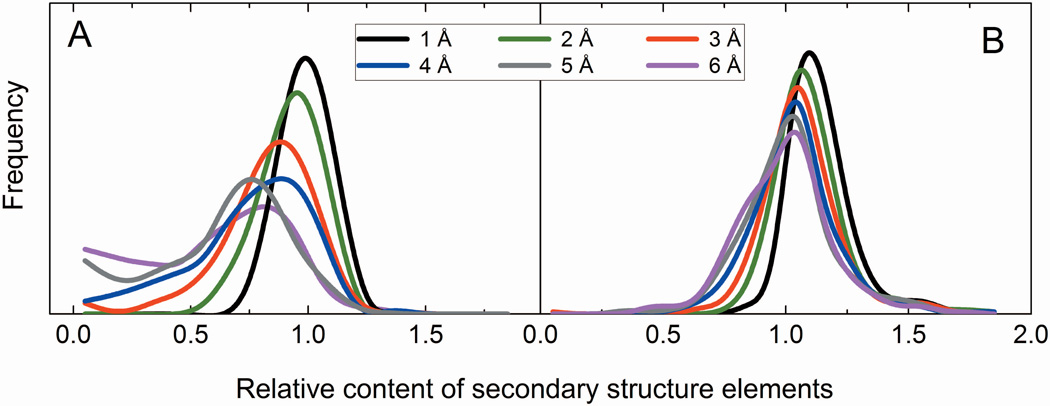
Figure 2.
Relative content of the secondary structure elements in models of different accuracy. The plots for the old (A) and the new (B) sets show distribution of the number of residues in α-helices and β-strands in a model divided by the corresponding number in the native structure. The curves were smoothed using Savitzky-Golay method in the Origin 2015 software package.

