

Background: The RET receptor activates downstream effectors that mediate function.
Results: Large EC50 shifts between receptor and effector dose responses show RET activates ERK and Akt most efficiently at low, functionally relevant ligand concentrations.
Conclusion: Experiments at high ligand concentrations can obscure quantitative features of receptor signaling.
Significance: Consideration of receptor-effector coupling is important for understanding how stimulus drives response in cell signaling.
Keywords: Akt PKB, Extracellular Signal-regulated Kinase (ERK), Kinetics, Mitogen-activated Protein Kinase (MAPK), Neurite Outgrowth, Signal Transduction, Systems Biology, RET, Artemin, Signal Gain
Abstract
A major goal of current signaling research is to develop a quantitative understanding of how receptor activation is coupled to downstream signaling events and to functional cellular responses. Here, we measure how activation of the RET receptor tyrosine kinase on mouse neuroblastoma cells by the neurotrophin artemin (ART) is quantitatively coupled to key downstream effectors. We show that the efficiency of RET coupling to ERK and Akt depends strongly on ART concentration, and it is highest at the low (∼100 pm) ART levels required for neurite outgrowth. Quantitative discrimination between ERK and Akt pathway signaling similarly is highest at this low ART concentration. Stimulation of the cells with 100 pm ART activated RET at the rate of ∼10 molecules/cell/min, leading at 5–10 min to a transient peak of ∼150 phospho-ERK (pERK) molecules and ∼50 pAkt molecules per pRET, after which time the levels of these two signaling effectors fell by 25–50% while the pRET levels continued to slowly rise. Kinetic experiments showed that signaling effectors in different pathways respond to RET activation with different lag times, such that the balance of signal flux among the different pathways evolves over time. Our results illustrate that measurements using high, super-physiological growth factor levels can be misleading about quantitative features of receptor signaling. We propose a quantitative model describing how receptor-effector coupling efficiency links signal amplification to signal sensitization between receptor and effector, thereby providing insight into design principles underlying how receptors and their associated signaling machinery decode an extracellular signal to trigger a functional cellular outcome.
Introduction
Our quantitative understanding of the activation and signaling mechanisms of cytokine and growth factor (GF)4 receptors has advanced substantially in recent years (1–14). Yet because of the high complexity of the problem, and the often context-dependent behavior of many intracellular signaling events and processes, progress toward a quantitative understanding of how cells orchestrate their response to external stimuli remains in its infancy. Experimental difficulties abound also. For example, functional cellular responses often occur at very low concentrations of stimulating GF, involving activation of only a tiny fraction of receptor molecules, whereas substantially higher stimulation levels are typically required to achieve robust levels of receptor activation and intracellular signaling that can easily be measured (15–19). Consequently, much of our knowledge about the timing and amplitude of receptor signaling responses comes from experiments using GF concentrations far above those at which biology occurs. Another experimental dilemma concerns whether to use approaches that aggregate responses from many cells or instead to measure events occurring within individual cells. Single cell methods typically involve exogenously expressing, and often overexpressing, a signaling protein fused to a fluorescent partner that provides an optical readout for its activation state and/or intracellular location (20–23). Such approaches, although uniquely informative in many important respects, carry the risk that the non-native structure or expression level of the exogenous protein might qualitatively or quantitatively alter its behavior. Alternative methods, such as quantitative mass spectrometry-based proteomics (24) or traditional Western blots or immunoassays (25), can be applied to endogenously expressed proteins present at their natural expression levels, but they involve analysis of lysates generated from large populations of cells, thus obscuring potentially important cell-to-cell differences in behavior. Each of these approaches thus has its advantages and drawbacks.
The role of signaling dynamics in translating extracellular stimuli into functional cellular responses is emerging as an important field of study (26–33). Many studies have reported data on the timing of various signaling events after activation of cells with a given growth factor, although quantitative and systematic studies of signaling dynamics are more rare (34–36). In interpreting the functional role of dynamics, most work to date has focused on the role of network topology, for example through feedback activation or inhibition that can extend or truncate the duration of particular signaling events (14, 26–29, 31, 32). Molecular kinetic factors, involving the formation and decay kinetics of individual molecular species, have been invoked more rarely. For example, Albeck et al. (37) have argued that the very slow decay rate of the ERK substrate Fra-1 serves to integrate over time the cumulative effect of multiple short pulses of ERK activation. In the same vein, Fujita et al. (38) have proposed that, in a system involving consecutive first-order reactions, a kinetically slow step will act as a “low pass filter” to selectively dampen the transmission of rapidly changing upstream signals in favor of signals that are sustained or fluctuate more slowly. However, how the dynamics of intracellular signaling processes and the kinetics of the individual molecular steps relate to the cell's ability to sense and respond to external stimuli remains poorly understood.
Here, we address how activation of the receptor tyrosine kinase RET is quantitatively coupled to signaling events in divergent downstream pathways. The RET proto-oncogene is important in development of the kidneys and the nervous system, and in the adult it helps maintain survival and function of certain neuronal cells (39). Mutations in RET are associated with Hirschsprung disease (39), as well as with multiple endocrine neoplasia types IIA and IIB and medullary thyroid carcinoma (40). RET has also emerged as an important cancer target (41–44). RET is activated by any of four homologous ligands, glial cell line-derived neurotrophic factor (GDNF), neurturin, artemin (ART), and persephin, with formation of an activated receptor complex additionally requiring one of four glycosylphosphatidylinositol-linked co-receptors known as GDNF family receptor α chain (GFRα)1–4 (45). Activation of RET involves initial autophosphorylation of several sites in the RET cytoplasmic domain (46, 47) and results in activation of multiple downstream signaling pathways, including Ras/Raf/MEK/ERK, PI3K/Akt, JNK/c-Jun, and p38 MAPK (Fig. 1A) (48, 49). We have previously proposed a mechanism for the assembly of the multicomponent activated RET receptor complex on NB41A3-mGFRα3 mouse neuroblastoma cells, which express RET endogenously and which we stably transfected with GFRα3 (50). This prior work established the quantitative relationship between the concentration of stimulating ART and the number of activated RET receptor complexes that result on the cell. Here, we address how assembly of the activated RET receptor complex on these same cells is quantitatively coupled to molecular events in divergent signaling pathways downstream of RET and to the functional response of neurite outgrowth.
FIGURE 1.

A, simplified scheme identifying key signaling pathways activated by the RET receptor. The dashed box highlights the six signaling effectors examined in this study. B, scheme illustrating experimental protocol for measuring phosphoprotein levels using quantitative immunoassays.
We focus on how RET activation is coupled to the phosphorylation of ERK1/2 and Akt (Fig. 1A), which are key mediators of cell survival, growth, and differentiation (51, 52). Our aim is to elucidate how the amplitude and timing of RET activation relate to the strength and character of intracellular signaling and to a functional cellular outcome. To address this question, we developed quantitative immunoassays to measure the absolute numbers of pRET, pERK, and pAkt molecules produced in cells by ART stimulation, and we used them to analyze the concentration dependence and time dependence of the receptor-effector relationships. We additionally used a multiplexed, bead-based immunoassay method to extend these measurements to include the additional effectors MEK, JNK, c-Jun, and p38 MAPK. The results show that the efficiency of receptor-effector coupling, as measured by the ratio of pERK or pAkt to pRET present on the stimulated cells, is strongly dose-dependent and is highest at low ART concentrations of ≤100 pm. Strikingly, this ART concentration coincides with that required for the functional response of neurite outgrowth in the same cells. Quantitative discrimination between pERK and pAkt pathways was also highest at this same low stimulus level. We additionally used time course experiments to explore the temporal connection between changes in the level of activated RET and corresponding changes in downstream signaling events. Each of the four signaling pathways we examined showed a different lag in responding to increasing pRET levels. The results imply that at functionally relevant levels of ART the RET receptor shows rather subtle discrimination in its engagement with divergent downstream signaling pathways and that the character of the overall signaling response evolves over time. Finally, we describe how receptor-effector coupling efficiency quantitatively relates to experimentally measured receptor and effector dose-response curves, and we discuss the implications of this relationship for the sensitivity of the functional cellular response to growth factor stimulus.
EXPERIMENTAL PROCEDURES
Materials
All salts, Nonidet P-40, phenylmethanesulfonyl fluoride (PMSF), bovine serum albumin, sulfuric acid, and Dulbecco's PBS were purchased from Sigma or Fisher. Rat artemin (53), hamster anti-rat RET antibody AA.GE7.3 (54), and the NB41A3-mGFRα3 cell line (55) were generous gifts from Biogen Idec (Cambridge, MA). For ELISA, anti-phospho-p44/42 MAPK rabbit capture antibody (catalog no. 7246s), anti-p44/42 MAPK mouse detection antibody (catalog no. 7246s), anti-phospho-Akt (Ser-473) rabbit capture antibody (catalog no. 7143s), anti-Akt1 mouse detection antibody (catalog no. 7143s), and HRP-conjugated anti-mouse IgG antibody (catalog no. 7076P2) were obtained from Cell Signaling Technology (Danvers, MA). Purified recombinant activated mouse ERK2 (catalog no. 14-173) was purchased from EMD Millipore (Billerica, MA). Recombinant human activated Akt1 protein (catalog no. 2999) was purchased from Invitrogen. For Western blotting, anti-pAkt (Ser-473) rabbit mAb (catalog no. 4060P), anti-p44/42 MAPK (Thr-202/Tyr-204) rabbit mAb (catalog no. 4370P), HRP-conjugated anti-α-tubulin mouse mAb (catalog no. 12351S), and HRP-conjugated anti-rabbit IgG (catalog no. 7074P2) were purchased from Cell Signaling Technologies (Danvers, MA). For flow cytometry, biotinylated affinity-purified anti-mouse GFRα3 polyclonal antibody (catalog no. BAF2645) was purchased from R&D Systems. Cy5-conjugated rabbit anti-GFRα1 polyclonal antibody (catalog no. bs-0201R-Cy5) was purchased from Bioss, Inc. (Woburn, MA).
Cell Culture
NB41A3-mGFRα3 cells were cultured in Dulbecco's modified Eagle's medium (DMEM) supplemented with 10% fetal bovine serum, 2 mm l-glutamine, and 500 μg/ml hygromycin B in a humidified chamber with 5% CO2 at 37 °C. Hygromycin B was from EMD Millipore (Billerica, MA); all other reagents were from Invitrogen.
RET Phosphorylation ELISA
The kinase receptor activation (KIRA) ELISA used to quantify RET phosphorylation levels was used as reported previously (50, 55). Briefly, NB41A3-mGFRα3 cells were seeded overnight in 12-well plates (Corning Glass) at a concentration of 6 × 10⁵ cells/ml in 1 ml of growth medium. To activate the RET receptor, ART was added to the cells in 500 μl of DMEM with 2 mm l-glutamine. For the dose-response experiments, cells were incubated with ART (0, 0.005, 0.02, 0.1, 0.2, 0.4, 1, 2, 4 or 10 nm) for 10, 30, or 60 min. For the time course experiments, cells were incubated with a fixed concentration of ART (0.1, 0.4, 1, 4, or 10 nm) for 0, 2, 4, 6, 8, or 10 min (10-min time course) or for 0, 5, 10, 20, 30, 40, 50, 60, 70, 80, or 90 min (90-min time course). After incubation with ART at 37 °C, to quench the reaction, the cells were washed with ice-cold Dulbecco's phosphate-buffered saline (PBS) and lysed for 1 h on ice in KIRA lysis buffer (10 mm Tris, 0.5% Nonidet P-40, 0.2% sodium deoxycholate, 50 mm NaF, 0.1 mm Na3VO4, 1 mm PMSF, pH 8.0) with gentle shaking. Meanwhile, the 96-well ELISA plate was coated with 100 μl of 5 μg/ml anti-rat RET antibody AA.GE7.3 in 50 mm bicarbonate buffer, pH 9.6, overnight at 4 °C and then incubated for 1 h at room temperature with KIRA blocking buffer consisting of PBS with 0.05% Tween 20 (PBST), 3% bovine serum albumin, and 1% fetal bovine serum. For each stimulation condition, a 260-μl aliquot of clarified cell lysate was added to each well of the assay plate, and the plate was incubated for 2 h at room temperature with gentle shaking. The plate was washed with PBST followed by incubation with 100 μl of 0.5 μg/ml horseradish peroxidase (HRP)-conjugated mouse anti-phosphotyrosine antibody (Invitrogen, catalog no. 03-7720) in blocking buffer for 1.5 h. After another PBST wash, the plate was incubated with the HRP substrate, 3,3′,5,5′-tetramethylbenzidine dihydrochloride (Pierce). The color reaction was quenched with 1 m H2SO4, and the absorbance from the wells was recorded at 450 nm using a SpectraMax M5 microplate reader (Molecular Devices, Sunnyvale, CA). We have previously shown that the observed absorbance, after background subtraction, is proportional to the quantity of phosphorylated RET (50).
ERK/Akt Phosphorylation ELISAs
Cellular ERK1/2 and Akt phosphorylation levels were determined by ELISAs with antibodies specific to phosphorylated ERK1/2 or phosphorylated Akt. NB41A3-mGFRα3 cells were stimulated with specific doses of ART exactly as was done for the RET ELISA. The cells were then lysed for 20 min on ice in pERK/pAkt lysis buffer (20 mm Tris, 150 mm NaCl, 1 mm EDTA, 1 mm EGTA, 1% Triton X-100, 2.5 mm sodium pyrophosphate, 1 mm β-glycerophosphate, 50 mm NaF, 1 mm Na3VO4, 1 mm PMSF, pH 7.5) with shaking. The 96-well ELISA plates were coated with anti-phospho-p44/42 MAPK capture antibody or anti-phospho-Akt1 (Ser-473) capture antibody (100 μl of a ×100 dilution of antibody stock solution in PBS) overnight at 4 °C, followed by incubation for 1 h with pERK/pAkt blocking buffer (PBST with 1% bovine serum albumin) at room temperature. A 260-μl aliquot of clarified cell lysate was added to each well, followed by incubation for 2 h at room temperature with shaking. All samples were measured in duplicate. The plate was washed with PBST and incubated for 1 h with either anti-p44/42 MAPK detection antibody or anti-Akt1 detection antibody, followed by a wash step and detection with HRP-conjugated anti-mouse IgG for 0.5 h. All further steps leading to the recording of absorbance at 450 nm were similar to the KIRA ELISA. The anti-phospho-p44/42 MAPK rabbit capture antibody recognizes ERK1/2 when dually phosphorylated at Thr-202/Tyr-204 in ERK1 or Thr-185/Tyr-187 in ERK2, or when singly phosphorylated at Thr-202 in ERK1 or Thr-185 in ERK2, as described by the manufacturer. The anti-phospho-Akt rabbit capture antibody recognizes Akt1 phosphorylated at Ser-473.
Assays were calibrated by constructing standard curves using duplicate wells containing activated recombinant mouse MAPK2 (ERK2) or activated recombinant human Akt1 as standards. The capture and detection antibodies for pERK do not discriminate between pERK1 and pERK2 (56), and those used for the pAkt ELISA detect both human and mouse pAkt1 (57). The standard proteins were reconstituted in lysate from unstimulated cells at concentrations of 0.1, 1, 4, 8, 10, 12, 15, 20, 30, and 40 ng/ml, and the resulting signals were measured using the standard ELISA protocols described above. Lysate from 6 × 10⁵ cells stimulated with 4 nm ART for 10 min was included in the same experiments, and the concentration of pERK or pAkt present in these samples was read from the standard curve. Three independent calibration experiments were done for each ELISA.
Data Analysis
Each ELISA experiment included duplicate wells containing lysis buffer only instead of cell lysate, others that contained cell lysate but from which capture antibody had been omitted, and others containing lysate from unstimulated cells to serve as negative controls. All experiments additionally included wells containing lysate stimulated with 4 nm ART for either 10 or 20 min as a positive control. All lysate samples were analyzed in duplicate. The duplicate absorbance values were averaged, the “no capture antibody” negative control value was subtracted, and the result was expressed as % of (positive control − no capture control). Dose-response data were analyzed using a logistic four-parameter fit shown in Equation 1,
 |
in which max and min represent the absorbance values (as % of ctrl) corresponding to saturating and zero ART, respectively; EC50 represents the concentration of ART giving a signal halfway between min and max; and slope is a factor representing the steepness of the curve. For both dose-response and time course data, the results were expressed in terms of the average number of phosphoprotein molecules per cell by setting the signal seen for lysate from cells stimulated with 4 nm ART for 10 min at 140,000/cell for pERK or 95,000/cell for pAkt, as determined from the ELISA calibration experiments. For pRET, the maximum value obtained from the dose-response data measured at 10 min was assumed to represent activation of all 6500 RET molecules present, on average, per cell (50). All curve fits were performed using ProFit 6.1.10 (Quantum Soft, Uetikon am see, Switzerland). Error bars for experimental measurements are standard deviations of the results obtained from independent replicate experiments. For the ratios pERK/pRET, pAkt/pRET, and pERK/pAkt, the errors were determined by propagating the standard deviations for the individual measurements according to Equation 2.
 |
Neurite Outgrowth Assays
NB41A3-mGFRα3 cells were seeded at a density of 8–16 × 103 cells/ml per well in 4-well chamber glass slides (Lab-Tek, Hatfield, PA) and grown for 24 h in DMEM with 10% fetal bovine serum (FBS) at 5% CO2 and 37 °C, prior to any treatment. The medium was replaced with 1 ml of DMEM containing 1% FBS and either 1 μm retinoic acid (Sigma) or specified concentrations of ART. The medium was changed each day, and on the 4th day after ART treatment, the medium was removed, and cells were immediately fixed in 4% paraformaldehyde in PBS for 15 min at room temperature. Cells were rinsed three times in PBS; the nuclei were stained in 1 μg/ml Hoechst 33258 (Sigma) in PBS, and the cells were examined under a fluorescent inverted microscope (Olympus IX70, Olympus Center Valley, PA). Five fields of view were captured per treatment condition. Total nuclei were determined using ImageJ 1.47 software (National Institutes of Health, Bethesda). Cells bearing a total neurite length equal to or greater than their cell body diameter and cells with flat, large radiating neurite morphology were counted as positive. The experiment was performed three times, in parallel on the same day, using independently prepared ART solutions. The statistical validity of the assay data were determined by analysis of variance with Fisher's LSD post hoc test, using StatPlus software version 5.7.8 (Analyst Soft, Alexandria, VA).
Bio-Plex Phosphoprotein Assay
The murine neuroblastoma cell line NB41A3 (ATCC CCL147), which expresses endogenous RET, was grown in DMEM containing l-glutamine, 110 mg/liter sodium pyruvate (Invitrogen), and 10% fetal bovine serum (FBS; Invitrogen). NB41A3 cells were transfected using Attractene (Qiagen Inc., Valencia, CA) according to the manufacturer's instructions with an expression plasmid containing the full-length sequence for mouse GFRα1, and stable transfectants were established in 750 μg/ml hygromycin (Invitrogen). Staining cells with rabbit anti-GFRα1 polyclonal antibody and anti-mouse GFRα3 polyclonal antibody showed expression of both GFRα1 and GFRα3 by flow cytometry. The resulting cell line, functionally responsive to both GDNF and ART, was named NB41A3-mGFRα1/α3. NB41A3-mGFRα1/α3 cells were plated in 24-well plates (BD Biosciences) at a density of 2 × 10⁵ cells per well in growth medium. The next day, the cells were stimulated with 5 nm ART in serum-free DMEM for 5, 10, 20, 40, and 60 min. Protein lysates were prepared using the cell lysis kit (Bio-Rad) with PMSF. Phosphorylated proteins were detected with the Bio-Plex Pro cell signaling phosphoprotein 5-plex assay kit (Bio-Rad) using the Bio-Plex200 system with HTF (Bio-Rad) and workstation according to the manufacturer's protocol. The targeted phosphorylated proteins included Akt (Ser-473), ERK1/2 (Thr-202/Tyr-204 and Thr-185/Tyr-187), MEK1 (Ser-217/Ser-221), c-Jun (Ser-63), JNK (Thr-183/Tyr-185), and p38 MAPK (Thr-180/Tyr-182). Briefly, 50 μl of cell lysate (adjusted to a concentration of 1–10 μg/ml protein) was plated in the 96-well filter plate containing anti-phosphoprotein antibody-coupled beads and incubated overnight on a platform shaker at 300 rpm at room temperature. The wells were vacuum-filtered and washed; 1.25 μl of detection antibodies (×20) was added, and the wells were vortexed followed by incubation in the dark for 30 min with shaking. The beads were then incubated for 10 min with 0.5 μl of streptavidin-PE (×100). The wells were vacuum filtered-and washed; 125 μl of resuspension buffer was added, and the wells were allowed to incubate for 30 s. Data acquisition and analysis were done using Bio-Plex Manager software version 6.1.
Quantitative Model for Receptor-Effector Coupling Efficiency
The dose-response curves for the ART-dependent induction of pRET, pERK, and pAkt in Fig. 3A can each be well described by standard logistic Equation 3 of the form
 |
where pX = pRET, pERK, or pAkt; Xtot is the total number of RET, ERK, or Akt molecules available for activation upon stimulation of RET by ART; EC50 is the ART concentration giving half-maximal ΔpX; and slope is a factor representing the steepness of the curve. The ratio of the ART-dependent increase in any two phosphoproteins, ΔpX1/ΔpX2, as a function of ART concentration, can therefore be described by the ratio of two such equations, as described in Equation 4,
 |
The solid lines in Figs. 2B and 4F were plotted using Equation 4, and the EC50 and slope values for pRET, pERK, and pAkt were obtained from the curve fits shown in Fig. 3A, together with the estimates of total protein levels (Xtot) of RET = 6500/cell, ERK = 140,000/cell, and Akt = 95,000/cell derived as described in the text. Additional detail about the validation of and properties of this model is provided under “Appendix.”
FIGURE 3.
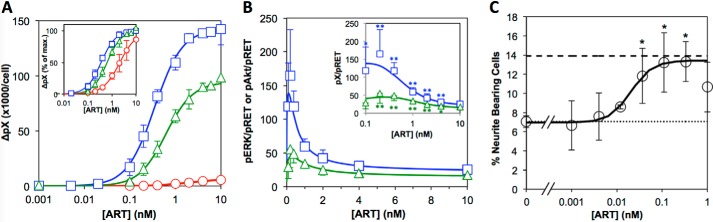
A, dose-response data for activation of pRET (circles), pERK (squares), and pAkt (triangles) after stimulation of NB41A3-mGFRα3 cells with the stated concentration of ART for 10 min. The ordinate shows the average number of phosphoprotein molecules per cell. Plots show the averaged data from at least three independent experiments. Error bars are standard deviations among the separate experiments. Solid lines represent the best fits to a logistic equation, as described under “Experimental Procedures.” Inset plot shows the same data plotted as percent maximum signal, to highlight the different EC50 values for the three phosphoproteins. B, ratio of pERK/pRET (squares) or pAkt/pRET (triangles) for each ART concentration tested. Solid lines represent expected values derived from the curve fits in A as described in the text. Error bars are the standard deviations, propagated from the errors in A as described under “Experimental Procedures.” Data are shown for [ART] ≥0.1 nm only, as at lower ART the propagated errors were very large. Inset plot shows the same data but with a logarithmic concentration axis, to better show the data at low ART concentrations. Data points indicated * or ** are values that are significantly greater than the corresponding value for 10 nm ART at the level of p < 0.05 or <0.01, respectively, as determined using an unpaired two-tailed Student's t test. C, dose-response data for the ART-dependent differentiation of the NB41A3-mGFRα3 cells as measured by neurite outgrowth. Plotted is the percentage of cells possessing neurites with a cumulative length at least equaling the diameter of the cell body, after incubation with the stated concentration of ART for 4 days as described under “Experimental Procedures.” The dotted line represents the value for cells treated in parallel but without ART. The dashed line represents the result obtained with 1 μm retinoic acid, as positive control. Data show the average of three replicate experiments performed on the same day. Error bars are standard deviations. The solid line is the best fit to a logistic equation; the data for 1 nm ART were not included in the fit. Asterisks indicate treatment conditions that were statistically distinct from the no ART control cells at the level of p < 0.05, as determined by analysis of variance with Fisher's LSD post hoc test.
FIGURE 2.

Validation and calibration data for pERK and pAkt ELISAs. A, ELISA data for pERK (left) and pAkt (right) showing that, in each case, lysate from cells treated with 4 nm ART for 10 min gives a strong positive signal, whereas negative controls in which capture antibody (No C), detection antibody (No D), or cell lysate (LB) was omitted gave only a low background signal. Plots show the averaged data from duplicate wells. Error bars are the difference between the duplicates. Results are representative of at least three independent experiments. Shown below are dose-response data for activation of ERK (left) and Akt (right) measured by Western blotting. Cell lysates were obtained by stimulating the cells with the stated concentration of ART for 10 min. α-Tubulin was used as loading control. B, calibration curves constructed using purified recombinant activated mouse ERK2 (left) in the pERK ELISA or human pAkt1 (right) in the pAkt ELISA, added to cell lysate from unstimulated cells. Plots show the averaged data from duplicate wells, shown as absorbance at 450 nm. Error bars are the difference between the duplicates. The dashed lines show the signal achieved in the same experiment for lysate from NB41A3-GFRα3 cells after stimulation with 4 nm ART for 10 min. The averaged data from three independent experiments were used to estimate that the lysate contained 9.9 ± 2.0 ng/ml pERK, corresponding to 142,000 ± 33,000 pERK molecules/cell, and 9.4 ± 1.2 ng/ml pAkt, corresponding to 95,000 ± 12,000 pAkt molecules/cell.
FIGURE 4.

Time course data showing how the levels of pRET (A), pERK (C), and pAkt (E) change after treatment of cells with the stated concentration of ART for 0, 2, 4, 6, 8, or 10 min. Data are the average of at least three independent experiments. Solid lines are smoothed interpolations of the data. Error bars are standard deviations between the independent experiments. B, rate of pRET formation in the first 2 min after stimulation plotted against ART concentration. The solid line is a linear least squares fit passing through the origin. The inset plot shows the same data and curve fit, but using logarithmic axes to better show the data at low [ART]. D, ratio of pERK/pRET plotted against time after stimulation, calculated using the data from A and C. F, ratio of pAkt/pRET against time after stimulation, calculated using the data from A and E.
RESULTS
Development and Calibration of Assays Measuring pRET, pERK, and pAkt
We have previously described the KIRA assay for measuring pRET levels induced by ART stimulation of NB41A3-mGFRα3 mouse neuroblastoma cells (50, 55). Briefly, cells stimulated with a given concentration of ART for a given time are lysed, the solubilized RET is captured onto an assay plate using an antibody specific for the RET extracellular domain, and the amount of phosphorylated RET is quantified using a horseradish peroxidase-coupled anti-phosphotyrosine antibody (Fig. 1B). Similar assays for measuring pERK and pAkt were developed for this study, as described under “Experimental Procedures.” The pERK and pAkt assays each gave a robust signal that increased with increasing concentrations of pERK- or pAkt-containing cell lysate, with a low background in control wells in which capture antibody or cell lysate was omitted (Fig. 2A). We calibrated these assays by creating standard curves using purified recombinant pERK or pAkt protein (Fig. 2B), to allow us to estimate the absolute concentration of pERK or pAkt present in a given sample of cell lysate. By reference to these standard curves, we estimate that stimulation of 6 × 10⁵ cells with 4 nm ART for 10 min resulted in cell lysate (600 μl) containing 9.9 ± 2.0 ng/ml pERK and 9.4 ± 1.2 ng/ml pAkt (n = 3), which corresponds to formation of 142,000 ± 33,000 pERK molecules and 95,000 ± 12,000 pAkt molecules per cell (Fig. 2B). These stimulation conditions result in maximal responses for both pERK and pAkt, indicating that the above numbers reflect the total number of ERK or Akt molecules per cell that are available for activation by ART stimulation. These calibrations were used to scale the ELISA data from subsequent experiments to give an estimate of absolute pERK and pAkt levels, by including in each experiment control wells containing lysate from cells treated with 4 nm ART for 10 min.
Dependence of pRET-pERK and pRET-pAkt Coupling on ART Stimulus Level
As a first step to characterize how pERK and pAkt levels relate to the amount of activated RET receptor on the cell, we used the quantitative immunoassays described above to measure pRET, pERK and pAkt levels after stimulation of NB41A3-mGFRα3 cells for 10 min with various concentrations of ART. Fig. 3A shows that ART caused a dose-dependent increase in pRET, with a half-maximal response (EC50) at [ART] = 2.3 ± 0.8 nm (n = 3). Compared with pRET, both pERK and pAkt were more sensitive to ART stimulation, with EC50 values of 0.28 ± 0.09 and 0.71 ± 0.24 nm (n = 4), respectively (Fig. 3A, inset). The pERK and pAkt dose responses also displayed somewhat steeper slopes than was seen for pRET. We have reported previously that NB41A3-mGFRα3 cells express ∼6500 RET molecules per cell (50). As Fig. 3A shows, stimulation with saturating ART for 10 min resulted in the formation of much higher numbers of pERK (∼140,000/cell) and pAkt (∼95,000/cell), indicating a large amplification of the signal between initial activation of the receptor and these intermediate steps in downstream signaling.
How pERK and pAkt levels relate to the number of pRET molecules present at 10 min after stimulation can be examined further by calculating the pERK/pRET and pAkt/pRET ratios observed at each ART concentration, as shown in Fig. 3B. The ratio of pEffector/pReceptor, sometimes called the signal “amplification” or “gain,” represents the efficiency with which activation of the receptor is coupled to activation of a given step in a downstream pathway. Our results show that pERK/pRET is at its lowest at maximal ART stimulation and increases sharply at lower concentrations of ART, up to a high of ∼150 pERKs per pRET. The data for pAkt show similar behavior but with a maximum pAkt/pRET ratio of ∼50:1. The dose-response curves for pRET, pERK, and pAkt in Fig. 3A are each well described by a standard logistic equation, and the curve fit in Fig. 3B is simply the ratio of the best fit logistic curves from Fig. 3A for pERK over pRET or pAkt over pRET, as described under “Experimental Procedures.” Although this treatment is empirical, and thus does not embody any hypothesis concerning the molecular mechanism or network topology that links pRET to ERK or Akt, it nevertheless reveals important features of how receptor-effector coupling varies with the strength of receptor stimulus. Specifically, as illustrated in Fig. 3B and discussed in detail under the “Appendix,” for a receptor-effector system in which EC50 for effector activation is lower than EC50 for activation of the receptor itself, the signal gain will necessarily vary with stimulus strength and will be highest at GF concentrations below the EC50 observed for the effector response. Thus, our experimental observation that pERK/pRET and pAkt/pRET ratios increase sharply with decreasing ART, reaching maximal levels at [ART] ∼0.1 nm, is not only shown by the experimental values for these ratios measured at low ART but is also a necessary consequence of the shapes of the overall dose-response curves in Fig. 3A.
To determine what level of ART stimulation is required for a functional response, we evaluated the ART-dependent differentiation of the NB41A3-mGFRα3 cells as measured by the observation of neurite outgrowth after 4 days in culture. Fig. 3C shows that ART causes a dose-dependent increase in the percentage of neurite-bearing cells comparable with that seen after treatment with 1 μm retinoic acid. The transition from minimal to maximal response occurs over 10–100 pm ART, consistent with the very high potencies reported for ART acting on primary neurons (58–63). This result therefore leads to the intriguing finding that for both pERK and pAkt, maximal signal gain, i.e. the most efficient coupling of receptor to effector, is seen at an ART concentration range matching that required for a functional cellular response in the same cells.
Evolution of Receptor-Effector Coupling as a Function of Time after Stimulation
Cell signaling is a dynamic process. Therefore, to understand how receptor activation is coupled to downstream signaling, it is necessary to measure how the events of interest evolve over time. To this end, we used the immunoassays described above to characterize pRET, pERK, and pAkt levels at various times from 0 to 90 min after ART stimulation. Focusing first on events that occur in the first 10 min after stimulation, Fig. 4A shows that pRET levels begin to rise immediately upon treatment of the cells with ART. The evolution of pRET shows a linear initial rate that persists for >10 min at low ART, but at high ART it begins to level off after just a few minutes. The initial rate of pRET formation is proportional to the concentration of stimulating ART over the range [ART] = 0.1–10 nm (Fig. 4B). The lack of any observable saturation in this relationship is consistent with the notion that the KD value for the initial binding of ART to NB41A3-mGFRα3 cells is >10 nm (50). Fig. 4C shows that pERK formation displays a pronounced lag, indicating that the molecular events subsequent to RET phosphorylation that culminate in activation of ERK take a few minutes to occur. The lag time decreases with increasing ART, from ∼4 min at 0.1 nm ART to <2 min at 10 nm. Plotting pERK directly against the pRET level measured at each time point showed that, at the different ART doses, different numbers of pRET molecules accumulated during the lag before pERK began to rise (data not shown). Thus, the lag does not reflect the time required to surpass a fixed threshold level of pRET. Examining how pERK/pRET coupling evolves over time (Fig. 4D) shows that the signal gain increases over the first few minutes after stimulation before achieving a steady state level that persists for several minutes. The maximum gain, observed between 6 and 10 min, decreases as ART is increased from 0.4 to 10 nm, consistent with the results obtained in the dose-response experiments shown in Fig. 3B. The evolution of pAkt also showed a lag, which decreased somewhat with increasing [ART] (Fig. 4E). The lag times for pAkt appeared shorter than those for pERK at the same ART concentrations. As was the case with pERK, the number of pRET molecules that accumulate during the lag period depends strongly on [ART]. However, unlike pERK, pAkt levels reach a maximum within 4–6 min, and at high ART are already beginning to decrease within 10 min, even though pRET levels continue to rise for some additional time. Consequently, the pAkt/pRET ratio achieves its maximum level somewhat faster than was seen for pERK but maintains this level only briefly before beginning to decline (Fig. 4F).
Extending the time course measurements out to 90 min after ART stimulation shows that, at moderate to high ART concentrations, pRET increases to a maximum and then slowly decreases (Fig. 5A). The time corresponding to maximum pRET shows a strong inverse dependence on [ART] (Fig. 5B), such that at lower ART concentrations pRET levels were steady or even still slowly rising at 90 min. The time-dependent variation in the shape of the pRET time course has the consequence that EC50 for the stimulation of pRET by ART, observed in dose-response experiments, decreases somewhat as the response evolves over time (data not shown). The 0–90-min time course for pERK shows an initial, transient phase of activation followed by a lower, sustained response that persists to >90 min, as has previously been well documented for multiple other receptor systems (64–67). Fig. 5C shows that the maximum of the transient pERK response occurs at ∼10 min at all ART doses tested. Comparison of pERK dose-response curves measured at 10 and 60 min shows that the amplitudes of the transient and sustained responses are proportional over the entire dose range (Fig. 5D), such that at any ART dose the pERK level observed during the sustained response is a roughly constant fraction of the peak transient response. The EC50 for the pERK response to ART is thus independent of time over the period 10–90 min (data not shown). Interestingly, at [ART] = 4 nm, pERK shows a reproducible pattern of oscillations extending from 10 to 60 min or so (Fig. 5C). Our assay method does not distinguish between cytoplasmic and nuclear pERK, and so these oscillations do not reflect cycling of pERK between cytoplasm and nucleus (68) but rather cyclic variations in total cellular pERK levels as have been observed previously (37, 69, 70). These oscillations in pERK are averaged over the many cells that contribute to the cell lysate, and therefore reflect a remarkable degree of synchronization across the different cells in the population. No significant oscillations are seen in individual experiments performed at ART concentrations just a few fold higher or lower, perhaps due to a loss of synchronization in pERK oscillations between the many cells that contribute to each sample of cell lysate. For pAkt, the 0–90-min time course also shows a transient response, peaking at 5–10 min after stimulation, followed by a sustained response that holds steady or decays gradually over >1 h (Fig. 5E). The pAkt response differs from the pERK response in that the transient and sustained phases are not separated by a pronounced minimum, as was seen for pERK, but instead simply involve a sudden decrease in the net pAkt decay rate. Also, where the sustained phase of the pERK response showed stable or even slightly increasing pERK levels out to at least 60 min, for pAkt the sustained phase shows a marked decline at higher ART concentrations.
FIGURE 5.

Time course data showing how the levels of pRET (A), pERK (C), and pAkt (E) change after treatment of cells with the stated concentration of ART for 0–90 min. Data are the average of at least three independent experiments. Solid lines are smoothed interpolations of the data. Error bars are omitted for clarity. B, time for RET phosphorylation to reach its maximal level plotted against 1/ART concentration, showing the reciprocal relationship between these quantities. Plots show the averaged data from at least four independent experiments. Error bars are the standard deviations between the independent experiments. The data point for 1/[ART] = 2.5 nm−1 (i.e. [ART] = 0.4 nm) is a lower limit, reflecting the fact that at this low ART concentration the time to maximum pRET appears to exceed the 90-min time frame of the experiment. D, levels of pERK observed after 60 min plotted against the pERK levels seen at 10 min, over a range of ART concentrations from 0.001–10 nm. Each data point represents a pair of measurements made at the same ART concentration. The solid line is a linear least squares fit passing through the origin. F, ratio of pERK/pRET (squares) or pAkt/pRET (triangles), measured as a function of time after stimulation with 0.4 nm ART.
The pERK/pRET and pAkt/pRET coupling ratios during the sustained phase of their responses are illustrated in Fig. 5F, for the condition of 0.4 nm ART. For both phosphoproteins the coupling ratios fall from the high values seen during the transient response to stabilize at 4–5-fold lower levels during the sustained phase. Specifically, over the period 40–90 min, 0.4 nm ART induces an average of ∼23 pERK molecules for each pRET present on the cells and about half that number of pAkt molecules per pRET.
Relative Amplitudes of Signaling through pERK Versus pAkt
Comparison of pERK versus pAkt levels provides insight into how the relative amplitudes of signal transduction through these divergent pathways relate to the strength of ART stimulus and how it evolves over time. Fig. 6A shows that the relative levels of pERK and pAkt present at 10 min after stimulation vary with ART dose. At high concentrations of ART, the ratio pERK/pAkt is ∼1.5, but at lower ART concentrations, ERK activation was favored over activation of Akt to a significantly greater degree. As was the case for the receptor-effector coupling ratios described above, the experimental uncertainty in the pERK/pAkt ratios at very low ART concentrations (<0.1 nm) was too large for these numbers to be directly informative. However, the measured pERK/pAkt ratios for [ART] = 0.1, 0.2, 0.4, 1, and 2 nm are all significantly higher than the ratio measured at 10 nm ART (p < 0.05). Moreover, comparison of the dose-response curves from Fig. 3A shows that pERK and pAkt have different EC50 values which, as described above and under the “Appendix,” requires that the pERK/pAkt ratio must indeed vary with [ART]. The solid line in Fig. 6A shows the ratio of the best fit curve fits from Fig. 3A, derived as described under “Experimental Procedures.” The level of discrimination in the amplitude of signaling via pERK versus pAkt appears highest at [ART] ≤0.2 nm, mirroring the result seen for the pERK/pRET and pAkt/pRET coupling efficiencies. The sustained phases of the pERK and pAkt responses give pERK/pAkt ratios similar to those seen for the transient response at the same ART concentration, even though the absolute amplitudes of the signals are significantly lower at these later times. Thus, our data show that the relative amplitude of signaling through the pERK and pAkt pathways is dose-dependent, with maximal discrimination seen at the low ART concentrations associated with functional activity.
FIGURE 6.

Relative amplitudes of signaling through divergent downstream pathways as a function of ART concentration and of time after stimulation. A, ratio of pERK/pAkt at 10 min after stimulation with the stated concentration of ART. The solid line represents expected values for the pERK/pAkt ratio, derived from the curve fits in Fig. 3A as described in the text. Error bars are the standard deviations, propagated from the errors in Fig. 3A as described under “Experimental Procedures.” Inset plot shows the same data but with a logarithmic concentration axis, to better show the data at low ART concentrations. Data points indicated * or ** are values that are significantly greater than the corresponding value for 10 nm ART at the level of p < 0.05 or <0.01, respectively, as determined using an unpaired two-tailed Student's t test. B, time course data, measured using the BioPlex multiplexed bead array assay, showing how levels of pAkt, pMEK, pJNK, and p-p38 MAPK vary over 0–60 min after stimulation of NB41A3-GFRα1/3 cells with 5 nm ART. Data are plotted as % of the maximum signal observed for each phosphoprotein (pX) and show representative results of 2–3 independent experiments. The solid lines are smoothed interpolations. Comparison of lag times observed for activation of MEK and ERK (C) and for JNK and c-Jun (D), after stimulation of NB41A3-GFRα1/3 cells with 5 nm ART, measured using Bio-Plex multiplexing immunoassay technology. The time course for formation of pRET in the same cells under the same stimulation conditions, measured using the KIRA ELISA, is shown for comparison. Data represent the average of 2 or 3 independent experiments. The results show that, in each case, consecutive steps in the same signaling pathway display similar lag times. E, variation in the ratios of pEffector/pRET as a function of time after stimulation for each of the four phosphoproteins shown in B. The data are relative to 100% of the maximum observed signal in each case. Consequently, the plots show how the receptor-effector coupling ratio for a given phosphoprotein evolves over time, but the scaling of the data for the different phosphoproteins is arbitrary. The solid lines are smoothed interpolations.
Extension to Other Signaling Pathways Downstream of RET
Using Bio-Plex multiplexing assay technology (71), we broadened the analysis to include additional signaling events and pathways downstream of RET. We measured time courses for the activation of the MAPKs p38 MAPK and c-Jun kinase (JNK), as well as for c-Jun itself. The multiplexed array additionally detected pAkt and pERK, for comparison with the results described above obtained using the ELISAs, as well as pMEK, the kinase that directly phosphorylates ERK. Although it is almost certainly incorrect to consider any of these pathways to act in isolation of the others, to a first approximation the four pathways represented in these measurements can be considered to diverge at the receptor, as represented schematically in Fig. 1A. Fig. 6B shows overlaid time courses for one representative event in each of these four pathways after stimulation of the cells with 5 nm ART, measured in a multiplexed fashion using the same cell lysate sample for all phosphoproteins. Fig. 6B also shows data for pRET measured in parallel in the same cells using the KIRA ELISA. The results show that pMEK activation manifests a lag of several minutes, similar to that seen for pERK (Fig. 6C), indicating that the events responsible for the lag in formation of pERK lie upstream of MEK. Activation of p38 MAPK shows a similar lag, whereas initiation of pAkt showed a somewhat shorter delay as was seen using the ELISA in Fig. 4C. In contrast, pJNK and pc-Jun (Fig. 6D) showed minimal response for a full 10 min after stimulation and did not reach a maximum until ∼40 min or later. Because of the differences in dynamics shown in Fig. 6B, the coupling of the different pathways to pRET changes quite substantially over the 60 min for which these responses were monitored (Fig. 6E). In particular, the coupling efficiencies for pMEK, pAkt, and p38 MAPK to pRET show peak values at 10–20 min after stimulation and by 40 min have stabilized at their sustained levels, as observed using the ELISA method (Fig. 5E). In contrast, the pJNK/pRET ratio does not reach a maximum until 40 min. Indeed, the pc-Jun/pRET ratio is still climbing sharply up to 60 min (data not shown), even though pRET levels are declining quite steeply after 20 min. Thus, the relative balance of signaling through these four divergent pathways evolves dynamically for at least 1 h after stimulation of the cells with ART.
DISCUSSION
The goal of this study is to obtain quantitative insight into how activation of RET is coupled to key downstream signaling events. In particular, we are interested in how the strength and duration of extracellular stimulus relate to the absolute amplitude and duration of signaling at the level of ERK and Akt and to the functional response of neurite outgrowth. Our results show that the efficiency of receptor-effector coupling is highly conditional; it varies with the strength of the extracellular stimulus, it evolves over time after stimulation, and it differs for different downstream signaling pathways. When attempting to develop a molecular level understanding of these behaviors, it is important to keep in mind that, like all signaling studies based on analysis of cell lysates or pooled cell populations, our measurements reflect changes in phosphoprotein levels averaged over many cells. Thus, what appear to be smooth, dose- or time-dependent changes when viewed in aggregate can result from changes in the proportion of cells experiencing more sudden or discontinuous changes at the single cell level. In particular, it has been shown that in single cells pERK levels do not vary continuously, but instead they manifest bistable fluctuations between minimal and maximal pERK, with higher levels of stimulus causing an increase in the frequency and duration of these spikes of ERK activation (37, 69). The same does not appear to be the case for Akt, however; it has been shown that pAkt levels in individual cells are distributed stochastically around the mean (72). Nevertheless, because of the limitations arising from averaging over many cells, we focus here on identifying quantitative, empirical relationships between key factors and events, rather than proposing detailed mechanistic or network models.
One striking result from our study is that pERK/pRET and pAkt/pRET coupling efficiencies are strongly dose-dependent, rising dramatically as the level of GF stimulation decreases. When pERK/pAkt is at its peak at ∼10 min after ART stimulation, 0.1 nm ART gave an average of ∼150 pERK molecules for each pRET molecule, whereas at higher ART concentrations, the ratio decreased toward a minimum of only ∼22 pERKs per pRET. A similar trend was seen for pAkt, although pAkt/pRET coupling was lower than for pERK at all concentrations. Thus, over the functionally relevant ART concentration range of 10–100 pm, at which the absolute signal amplitudes are very low, receptor-effector coupling is highly efficient, i.e. there is a large amplification between receptor and effector, but it becomes much less efficient at higher stimulus levels that give more robust overall signaling. Interpreted in terms of a bi-stable pERK response, the dose dependence of receptor-effector coupling efficiency is even greater. For example, after 10 min of stimulation with 0.1 nm ART, the pERK signal is at 15% of the maximum. If the pERK response is bi-stable, this result corresponds to ∼15% of cells being in the high pERK state and ∼85% in the low pERK state at any given time. That subset of high pERK cells contains ∼140,000 pERK molecules per cell (i.e. all RET-activatable ERK molecules in the cell), against an average of only ∼180 pRET molecules per cell (from the pRET dose response in Fig. 3A), corresponding to a coupling efficiency of ∼800 pERKs/pRET in the high pERK cells. In contrast, at saturating ART essentially all cells have maximal pERK more or less all the time (37) while possessing an average of ∼6500 activated RET receptors, giving a per-cell coupling efficiency of only 140,000/6500 = ∼22, representing an ∼40-fold decrease in coupling efficiency compared with low ART. Our observation that average pERK/pRET coupling efficiency increases as ART is lowered from saturating levels to functionally relevant concentrations is therefore likely even more pronounced at the level of individual cells. It is broadly true that intracellular signaling events saturate at stimulus levels at which only a fraction of receptors are activated (15, 17–19, 35, 73). Our observation that receptor-effector coupling ratios are dose-dependent and are maximal at low stimulus levels is therefore likely true for many such systems. The coupling of receptor activation to intracellular signaling events has previously been examined for the epidermal growth factor (EGF) receptor (17). Similarly to our findings here, the authors observed that the degree of signal amplification for pERK and for pAkt passed through a maximum at EGF concentrations well below the KD values for receptor binding. This earlier study did not address how receptor-effector coupling efficiency relates to functional cellular responses, nor did they discuss how coupling efficiency or the balance of signaling flux between divergent pathways evolves over time.
Our analysis additionally shows that if signaling events at equivalent points in divergent pathways have different EC50 values, then the relative amplitudes of the two signaling events will vary as a predictable function of GF concentration, with the discrimination in signaling amplitudes being greatest at low stimulus levels. For example in our system, where EC50(pERK) < EC50(pAkt), stimulation of the cells with very low ART generated up to 3.5 pERK molecules for each pAkt molecule, although at saturating ART, the ratio converged to a value of ∼1.5 that simply reflects maximal activation of all available ERK and Akt molecules. Considered in terms of a bi-stable pERK response, the pERK/pAkt ratio in individual cells at low ART would at times presumably be much higher, and the variation of this ratio with ART concentration would be correspondingly greater. In general, the larger the EC50 difference between effectors at equivalent points in divergent pathways, the greater will be the discrimination in signal amplitude between those pathways at low stimulus levels. Equations for estimating absolute coupling efficiencies and relative signal amplitudes from experimental dose-response data are given under the “Appendix.”
A particularly interesting finding is that the ART concentration that gives the highest observed pERK/pRET and pAkt/pRET coupling ratios, and also the greatest degree of discrimination between pERK and pAkt signal amplitudes, coincides with that required for the functional response of neurite outgrowth in the same cells. This result raises the intriguing possibility that the signaling system has evolved to be at its most efficient with respect to receptor-effector coupling, and also its most discriminating with respect to the relative strength of signaling via different pathways downstream of the receptor, over the range of GF levels where biological function occurs.
It is pertinent to ask why it might be advantageous for a cell to display high receptor-effector coupling ratios at biologically relevant GF concentrations, other than a putative evolutionary drive for parsimony. A functional response presumably requires only that threshold levels of activation of key downstream effector molecules be achieved, with the role of receptor activation and other upstream signaling events being simply to bring this about. It would seem that a cell could achieve these threshold levels of effector activation either through the action of a small number of receptors working with high receptor-effector coupling efficiency or equally well through a larger number of receptors working with lower coupling efficiency, as illustrated in Fig. 7, A and B. Thus, one might imagine that any level of coupling efficiency could be adequate for function, provided that a sufficient number of receptors are present and can become activated so as to bring about the required levels of effector activation. However, unlike our in vitro cell culture assays, in which monolayers of cells are bathed in a substantial volume of culture medium, in vivo adherent cells often exist in densely packed three-dimensional structures where most of the volume is taken up by the cells themselves, and thus the volume of extracellular fluid per cell is much lower. Even in our experimental system a concentration of 0.01–0.1 nm ART represents only a roughly 1–10-fold stoichiometric excess over the number of RET molecules present. Therefore, in vivo it is likely that at these low functional concentrations ART itself is stoichiometrically limiting with respect to RET. Under such conditions, the number of pRET molecules per cell that can form will be limited by the low amount of ART available, regardless of how many receptor molecules are present, making a high receptor-effector coupling efficiency necessary to generate the levels of pERK, pAkt, and other intracellular signaling molecules required for a functional cellular response (Fig. 7C). We therefore speculate that a high receptor-effector coupling efficiency might be important in some instances of signaling by highly potent GFs such as ART that act on cells outside of the circulatory and lymphatic systems, where the volume of extracellular fluid is limited, and therefore a functional concentration of GF represents relatively few molecules per responsive cell. In support of this notion, we found that increasing the cell density in our experiments by 5-, 10-, or 25-fold, up to the highest density we could achieve experimentally, as expected had no measurable effect on EC50(pERK) (n = 4; data not shown). This result is consistent with our hypothesis, illustrated in Fig. 7, that a high RET/ERK coupling efficiency will preserve the sensitivity of cellular responses even at high cell densities, when the volume of extracellular fluid, and thus the available number of ART molecules per cell, is limited. In contrast, a simple calculation shows that if RET were to possess much lower RET/ERK coupling efficiency, but compensated for by correspondingly higher RET expression, it would require substantially higher ART concentrations to occupy and activate sufficient RET receptors to achieve the same level of intracellular pERK. For example, one might consider cells containing a hypothetical RET that signaled with 100-fold lower RET/ERK coupling efficiency but was expressed at 100-fold higher levels to compensate for its inefficient signaling. The calculation indicates that at the cell density we estimate for a solid tissue (∼5–10 × 107 cells/ml), such cells would require up to 25-fold higher concentrations of ART to achieve the same level of pERK activation seen for cells expressing normal RET at normal levels. High ART concentrations would be required to ensure that there are a sufficient number of ART molecules present, in the limited extracellular fluid space around each cell, to engage and activate enough of the inefficiently coupled RET receptors to achieve the required levels of intracellular effector activation. We cannot, of course, exclude the possibility that the high coupling efficiency we observed for RET at functional ART concentrations is merely coincidental or reflects an arbitrary property of the system that is not important for the proper response of cells to ART. However, the above argument shows that reasonable circumstances can be conceived where receptor-effector coupling efficiency could be functionally important, supporting the notion that this quantitative feature of receptor signaling is worthy of further study.
FIGURE 7.
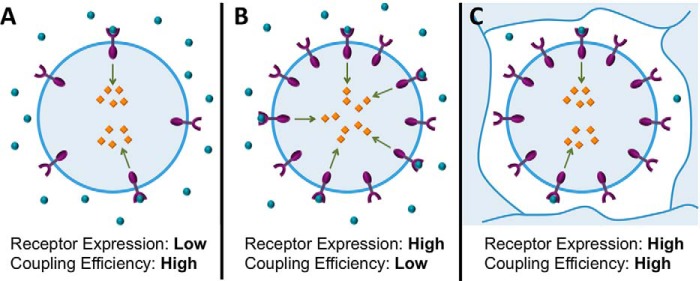
Schematic illustrating circumstances under which a high receptor-effector coupling efficiency might be important for function. Under conditions where the concentration of activating GF (blue circles) is not limiting with respect to receptor, a given level of activated effector (orange lozenges) can be generated either by activation of a small number of receptors that display high receptor-effector coupling (A) or, alternatively, by activating a larger number of receptors that display lower receptor-effector coupling (B). However, if the GF concentration is stoichiometrically limiting, as for example in the case of a highly potent GF that is present at its very low functional concentration in a restricted volume of extracellular fluid space (C), the number of activated receptors will be limited by the number of available GF molecules. Under these conditions, achieving the necessary level of activated effectors will require a high receptor-effector coupling efficiency, no matter how many receptor molecules are present, because the number of activated receptors at a given time is limited by the low available GF concentration.
Our results also shed light on broader design principles governing how receptors and their associated signaling machinery decode an extracellular signal to trigger a functional outcome. The relationship EC50(receptor) > EC50(effector) > EC50(functional response) that we see for stimulation of cells with ART is not an uncommon pattern (16–19). Our analysis provides insight into the functional consequences of such progressive, stepwise sensitization of signaling. In this context it is important to distinguish signal sensitization, i.e. a decrease in the GF concentration required to activate successive steps in the transduction process, from the related but distinct phenomenon of signal amplification, which concerns the numbers of effector molecules involved at each step. We show here that signal sensitization between receptor and effector necessarily produces maximal receptor-effector coupling at GF concentrations below EC50(effector) (Figs. 3B and 8A, and “Appendix”). Thus, in situations where a high receptor-effector coupling efficiency is important for function, a sensitization of response from receptor to effector implies that the functional response will be more sensitive still, because maximum coupling efficiency occurs at a GF concentration below EC50(effector) (gray area in Fig. 8A). The degree of sensitization from receptor to effector is also directly linked to the magnitude of signal amplification. This is because the ratio of activated effector to activated receptor, i.e. the receptor-effector coupling ratio, seen at a given GF concentration itself directly depends on the difference in receptor and effector EC50 values, as described under the “Appendix,” with a larger EC50 shift from receptor to effector corresponding to a higher coupling ratio and thus greater signal amplification. Thus, as we describe more fully under the “Appendix” the phenomena of signal sensitization (spare receptors) and signal amplification are directly linked and are to some extent unified by consideration of receptor-effector coupling ratios.
FIGURE 8.
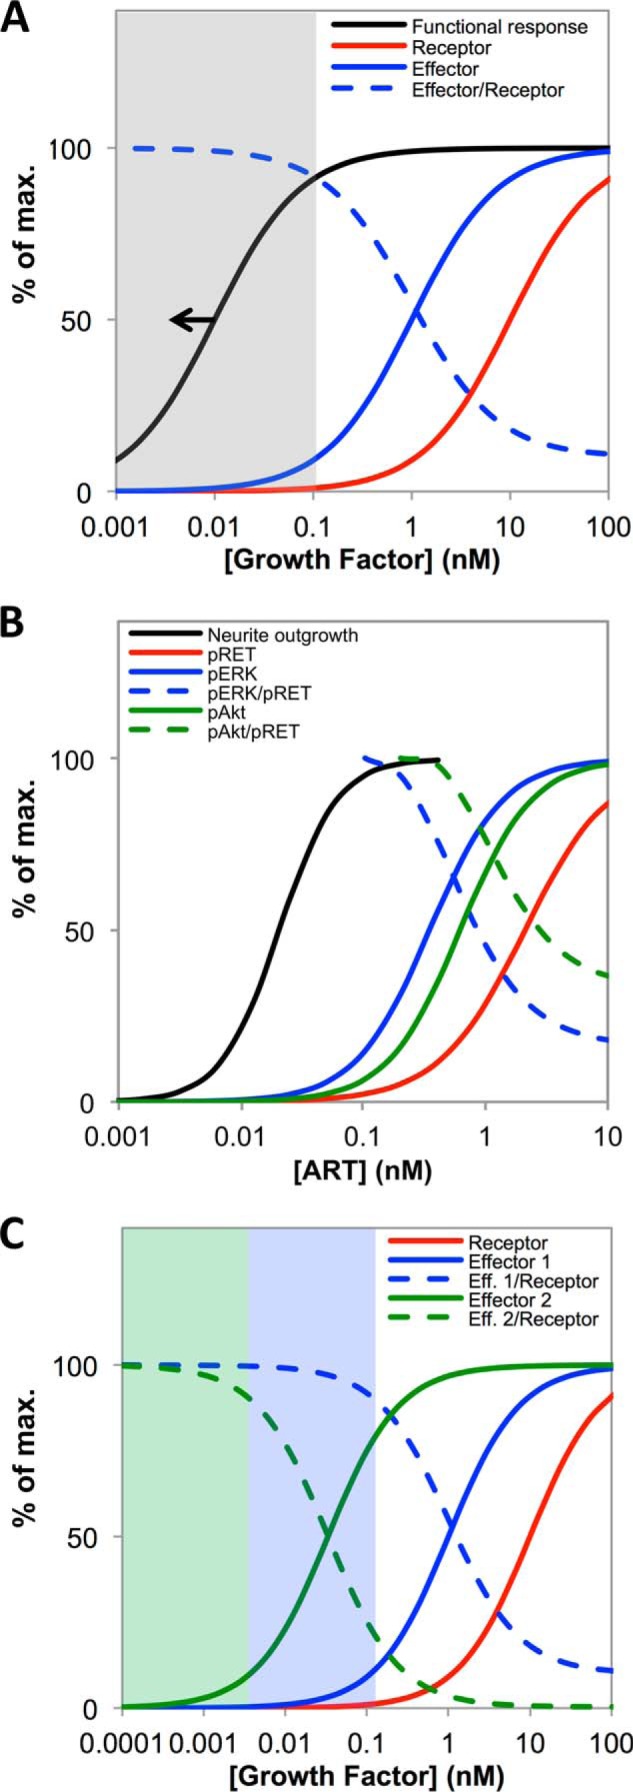
Functional implications of receptor-effector coupling efficiency. A, plots of Equations 5 and 6 (see “Appendix”), for hypothetical receptor (red line) and effector (blue line) dose-response curves, showing that if EC50(effector) < EC50(receptor) then the receptor-effector coupling ratio (dashed line) will necessarily increase with decreasing GF concentrations, reaching a maximum at [GF] < EC50(effector). The GF concentration range giving maximal (>90%) receptor-effector coupling is shaded in gray. If the system is one for which, for whatever reason, a functional response requires maximal receptor-effector coupling, then the dose-response curve for function will lie around or to the left of the black line. B, corresponds to A but plotted using the curve fits for the experimental data shown in Fig. 3 (but omitting the experimental data points, for clarity) to illustrate the behavior observed experimentally in this study for pRET (red line), pERK (blue line), pAkt (green line), and neurite outgrowth (black line). C, plots based on Equations 5 and 6 showing the expected behavior for a hypothetical receptor (EC50 = 10 nm, red line) that activates effectors in two divergent signaling pathways with very different EC50 values (1 nm, blue line, and 0.033 nm, green line). The plot shows that pEffector/pReceptor coupling for the two effectors (dashed blue and green lines) is maximal at correspondingly different GF concentrations, such that functional responses coupled to the two signaling pathways might occur over distinct GF concentration ranges, as described under the “Appendix.”
In this study, we found that pERK and pAkt had fairly similar EC50 values and thus showed maximal receptor-effector coupling efficiency over essentially the same concentration range (Fig. 8B). We speculate that a common GF range for high receptor-effector coupling might be expected for effectors that occupy similar positions in their respective signaling cascades when they participate in a common functional outcome. However, it is possible to conceive of situations in which a receptor might activate different downstream effectors with very different EC50 values, such that the GF concentrations giving maximal coupling efficiency are dissimilar (Fig. 8C). Such a situation might arise if the different signaling events are associated with different functional responses that occur over distinct GF concentration ranges, as is known to occur for example with morphogens (74) and some growth factors (75).
We additionally examined dynamic features of how RET engages with intracellular signaling, through analysis of activation kinetics. The observation that certain signaling events downstream of growth factor receptors show a lag before full initiation has been noted previously (36, 66, 76, 77). However, to our knowledge, the consequences of differential lag times for how the balance in signaling among divergent pathways evolves over time has not previously been addressed. In this study we found that all four tested pathways downstream of RET displayed a lag after initial ART stimulation, but that the duration of the lag differed markedly between the different pathways. In the two instances where we measured induction kinetics for a pair of effectors in the same pathway, MEK/ERK and JNK/c-Jun, the lag behavior was virtually identical for the two pathway steps, suggesting that the lag in responding to increasing pRET derives from slow upstream steps to which the downstream events respond comparatively rapidly. The lag times we observed here are short compared with the hours or days typically required for cellular functional responses to develop. However, our results in Fig. 6, B–E, shows substantial time-dependent changes in the overall balance of the RET signaling response that persists for at least an hour after ART stimulation. Moreover, even lag times of a few minutes might have functional significance for how cells respond to rapidly changing or pulsatile stimulation (27, 33). In particular, a signaling event that has a lag time of several minutes presumably will not respond to a short pulse of stimulation. Thus, a substantial lag time might serve as a low pass filter (38) for the pathway concerned, by selectively attenuating the extent to which short-lived pulses of receptor stimulus are transduced to downstream steps. For pERK and pAkt, we show that the lag times tend to become somewhat longer at lower stimulus levels, suggesting that any dynamic effects on signal decoding that result from the above kinetic factors are likely to be even more pronounced at low, functionally relevant levels of activating GF.
Finally, our results provide a quantitative picture of key events in RET signaling upon the sustained stimulation of cells with functionally relevant concentrations of ART. At the concentration of 100 pm ART required for a full functional response, initial activation causes pRET levels to rise at a rate of only ∼10 molecules/cell/min, reaching several hundred pRETs/cell over >90 min. After a brief lag, there follows the transient development of an average of 10,000–20,000 pERK molecules per cell, and about one-third that number of pAkt, both of which peak at 5–10 min after initial stimulation. At this transient peak, each pRET molecule on the cell supports ∼50 pAkt molecules and an average of ∼150 pERK molecules. As described above, the pERK response at 0.1 nm ART is probably more accurately represented as relatively brief and infrequent spikes of ∼800 pERKs per pRET interspersed with longer periods of minimal pERK, as has been described for other systems (37). After this transient peak, pERK falls by ∼25% and pAkt by about 50%, and these lower levels hold relatively steady while pRET continues to slowly climb over the ensuing ≥60 min. Other signaling pathways, including JNK/c-Jun and p38 MAPK, also become activated concurrently with or soon after initial activation of pERK and pAkt. Our results suggest that the signal amplitude (i.e. number of activated effectors) that RET induces in different downstream signaling pathways is significantly differentiated at this low ART concentration. Moreover, the relative amplitudes of signaling through the divergent pathways downstream of RET ebb and flow on different time scales, so that the character of the overall signaling response evolves continuously over at least the first hour after stimulation. By 90 min after stimulation, the cells on average display only a few thousand pERK or pAkt molecules representing <10% of the total amounts of each protein that is potentially available for activation. Thus, there remain large pools of unactivated ERK, Akt, and presumably also other signaling molecules, available to respond to further stimulation of RET or of other receptors that engage with these canonical signaling pathways.
In conclusion, our results provide a quantitative picture of how receptor-effector coupling efficiency relates to signaling, when measured at the level of receptor activation versus intracellular signaling events versus the ultimate cellular functional response. These findings advance our understanding of how the intracellular signaling machinery serves to decode the information contained in the concentration and timing of GF stimulation to achieve an appropriate functional outcome.
Acknowledgments
We thank Biogen Idec for providing the rat artemin, the KIRA ELISA capture antibody, and the NB41A3-mGFRα3 cells used in this study. We thank Pankaj Mehta, Javad Noorbaksh, Charles Fisher, and Robert Shaffer for helpful discussions.
APPENDIX
Calculation of Receptor-Effector Coupling Ratios and Relative Amplitudes of Downstream Signaling Events
The dose-response behavior of different, experimentally measurable signaling events that result from activation of a given receptor (R), such as activation of a signaling effector (X) through its phosphorylation to form the phosphoprotein (pX), can often be empirically described in terms of a four-parameter logistic curve fit of the form shown in Equation 5,
 |
where ΔpX is the increase in the level of pX resulting from activation of the receptor; Xtot is the total number or concentration of X molecules that become activated at saturating levels of receptor activation; [L] is the concentration of growth factor or other activating ligand; EC50 is the concentration of growth factor giving half-maximal pX, and slope is a factor that reflects the steepness of the dose-response curve. Equation 5, although entirely empirical, often can be seen to describe the dose-response behavior quite precisely over the full measurable dose range, as is shown for example in Fig. 3A. Therefore, although this empirical curve fit cannot be used to extrapolate to ART concentrations lying outside the range that was measured experimentally, it can be used to establish a quantitative, if model-free, description of how phosphoprotein levels and phosphoprotein ratios vary over the measured ART range.
It is well established that experimental dose-response curves for intracellular signaling events typically display EC50 values that are substantially lower than the EC50 for growth factor binding to the receptor, sometimes called the “spare receptors” effect (18, 19). In our system, both pERK and pAkt show EC50 values that are significantly lower than that measured for pRET (see Fig. 3A). Moreover, different downstream signaling events can possess different EC50 values, as is seen for pERK and pAkt in Fig. 3A. In such cases, the fraction of a given signaling protein that becomes phosphorylated at any (nonsaturating) dose of growth factor will differ for the different phosphoproteins. For example, Fig. 3A shows that after stimulation of the cells for 10 min with 0.7 nm ART (i.e. approximately the EC50 for pAkt), ∼50% of the available Akt is phosphorylated; pERK is at ∼70% of the maximum level, but only ∼20% of the available RET is activated.
For dose-response curves that are well described by a logistic equation, the ratio of activated effector (pX) to phosphorylated receptor (pR) at a given time after stimulation can be calculated simply by taking the ratio of the logistic equations that describe their dose-response behavior which, rearranged into a convenient form, is as follows (Equation 6),
 |
Equation 6 can be used to estimate how the ratio of pX to pR varies as a function of the concentration of the activating growth factor ligand (L) for pX and pR dose-response curves with given EC50 values and slopes.
Fig. 9, A and B, shows that, in cases where the pX and pR responses differ in EC50 but have identical slope, the ratio pX/pR will range from a low value at high L concentrations up to a maximum as [L] tends to 0. The curves in Fig. 9B were calculated from Equation 6 assuming the total concentrations of the receptor and the three hypothetical downstream signaling proteins X, Y, and Z are equal (i.e. Rtot = Xtot = Ytot = Ztot = 100) and the EC50 values vary (pR = 1 nm; pX = 0.33 nm; pY = 0.1 nm, and pZ = 0.033 nm). All curves have slope = 1.0. Under this simplifying assumption, the maximum value of the effector/receptor ratio at growth factor concentrations approaching zero is equal to the reciprocal of the ratio of the EC50 values for the two phosphoproteins, raised to the power of the slope. So, for example, in Fig. 9B the maximum value of the ratio pY/pR is given by EC50(pR)/EC50(pY) = 1 nm/0.1 nm = 10, raised to the power of 1 = 10. In the more general case in which the total concentrations of the various proteins differ, the maximum value of the effector-receptor ratio observed as [L] tends to zero will be given by Equation 7, which includes Xtot/Rtot as an additional factor,
 |
Conversely, as ligand concentration tends to saturating levels, the effector/receptor ratio will approach an asymptote that simply equals Xtot/Rtot, as can be seen from Equation 6 if [L] tends to infinity.
FIGURE 9.
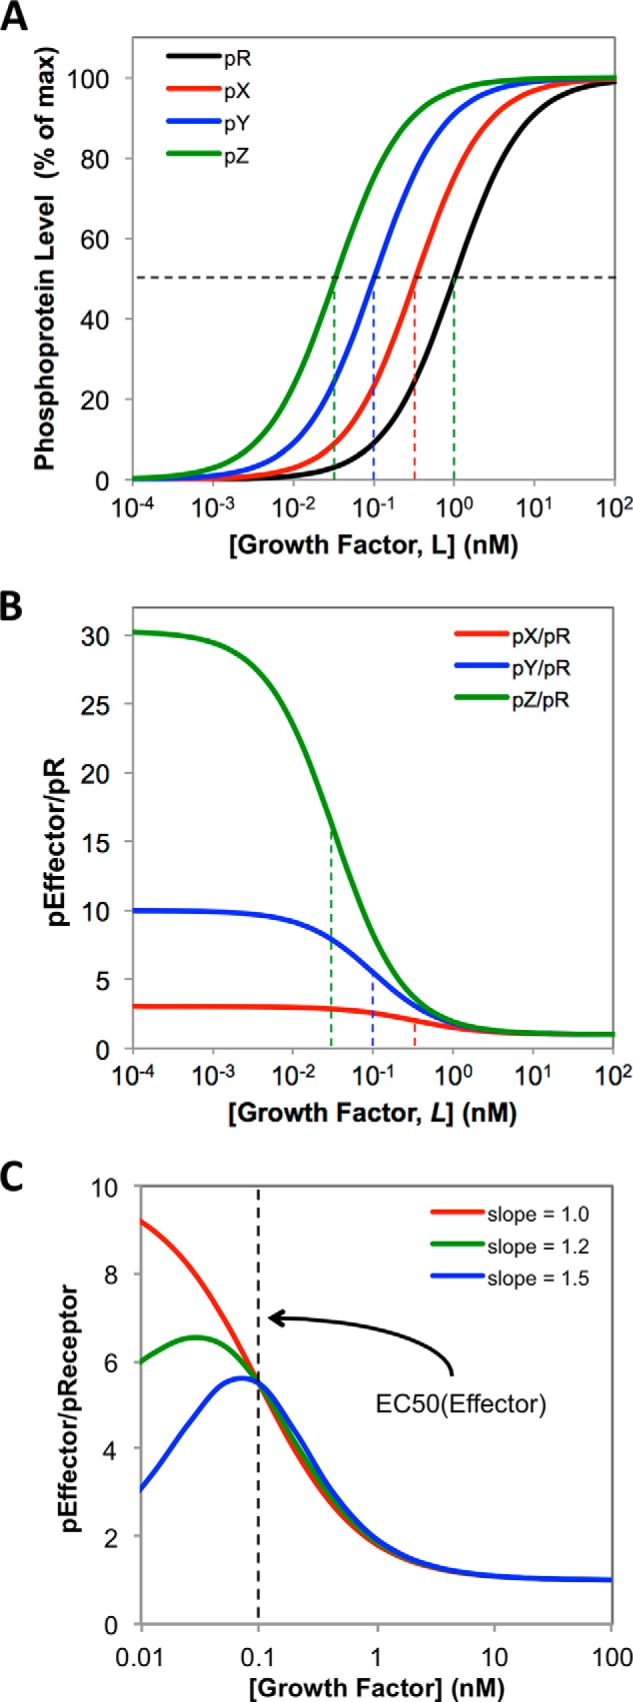
A, calculated dose-response curves, using Equation 5 (see “Appendix”), for the GF-dependent phosphorylation of a hypothetical receptor (pR) and three hypothetical downstream effector phosphoproteins, pX, pY, and pZ, where EC50 values are pR = 1 nm, pX = 0. 33 nm, pY = 0.1 nm, pZ = 0.033 nm, and all slopes have value 1.0. The vertical dashed lines indicate the EC50 value for each curve. B, calculated effector/receptor ratios, pX/pR, pY/pR, and pZ/pR, for the dose-response curves shown in A, calculated using Equation 6 (see “Appendix”). The dashed lines show the EC50 values for the corresponding effector dose-response curves from A. C, curves calculated using Equation 6 (see “Appendix”), showing how the dose dependence of the effector/receptor coupling ratio is affected if slope(effector) < slope(receptor). For all curves, the receptor is assumed to have EC50 = 1 nm and slope = 1.0. The red, green, and blue curves are calculated for effectors with EC50 = 0.1 nm (dashed line) and slopes of 1.0, 1.2, or 1.5, respectively.
In real systems, dose-response curves for receptor and effector can differ not only in EC50 value but also in slope, as we observe for the RET system in Fig. 3A, where the slopes observed for the ERK and Akt dose responses are somewhat steeper that seen for RET activation itself. However, a difference in slopes does not affect the key property that the effector/receptor ratio increases as [L] decreases down to EC50(effector) (Fig. 9C). For data that conform to a logistic curve fit down to very low GF concentrations, the effect of even a modest increase in slope between receptor and effector dose responses is to cause the effector/receptor ratio to pass through a maximum at a GF concentration just below EC50(effector) (Fig. 9C). However, it must be stressed that the experimental results we obtained for the RET system are not sufficiently accurate at very low ART concentrations to establish whether the effector/receptor ratio does or does not pass through a maximum at [ART] <100 pm, and it is not valid to use the empirical logistic curve fits to extrapolate beyond the ART concentration range that was measured experimentally.
Overall, the above analysis indicates the following: when EC50(effector) < EC50(receptor) then (i) the effector/receptor ratio will increase to a maximum as the concentration of stimulating growth factor decreases, and (ii) the larger the EC50 difference between receptor and effector, the greater the effector/receptor ratio at any given subsaturating ligand concentration. Importantly, these two conclusions are independent of the precise mathematic equation used to fit the data, as they reside in the data themselves. We chose a logistic curve fit as the basis for our analysis because it is commonly used to fit experimental dose-response data, and thus is familiar to experimental workers in the field, and because it can easily be manipulated, as in Equation 6, to provide a quantitative empirical description of the observed behavior. It is important to note, however, that an empirical treatment of this kind cannot be used predict phosphoprotein levels or receptor-effector coupling ratios at GF concentrations below the levels that were measured experimentally. In the case of the RET system, we were able to experimentally measure the concentrations of both activated effector (pERK or pAkt) and activated receptor (pRET) with reasonable accuracy at ART concentrations down to 0.1 nm, and so were able to experimentally verify that this assumption holds quite well down to the low ART concentrations required for biological response in these cells.
Application to Evaluate Relative Effector Levels in Divergent Signaling Pathways
The relative amplitudes of different signaling events in divergent signaling pathways downstream of a common receptor can be treated exactly as described above for effector/receptor ratios, provided that each of the effector dose responses can be well described using a logistic equation. Thus, as we saw above when comparing effector and receptor levels, if the EC50 values for two effector phosphoproteins, pX and pY, are different, the relative amplitudes of the two events, i.e. the ratio pX/pY, will necessarily vary as a function of GF concentration, showing the greatest differences at low stimulus levels. For example, Fig. 6A showed that the ratio of pERK to pAkt was higher at low ART than at higher levels of stimulation, and this trend could be quantitatively modeled using Equation 6 but using as variables pX, pY in place of pX, pR. The actual value of the pX/pY ratio will depend on both the EC50 values of the two effector responses and the relative total abundance of the two effector proteins available for activation by the receptor, as described in Equation 6. Thus, the level of discrimination in the amplitude of signaling though different downstream pathways will be greatest at growth factor levels below the EC50 value for the more sensitive of the two effector responses, unless offset by comparably large and opposite differences in the total effector protein levels (see Equation 7).
This work was supported, in whole or in part, by National Institutes of Health Grant GM087469 (to A. W.) and F31 Predoctoral Fellowship CA177224 (to J. M. C.).
This article was selected as a Paper of the Week.
- GF
- growth factor
- ART
- artemin
- GDNF
- glial cell line-derived neurotrophic factor
- GFRα
- GDNF family receptor α
- KIRA
- kinase receptor activation.
REFERENCES
- 1. Janes K. A., Lauffenburger D. A. (2013) Models of signalling networks–what cell biologists can gain from them and give to them. J. Cell Sci. 126, 1913–1921 [DOI] [PMC free article] [PubMed] [Google Scholar]
- 2. Shankaran H., Resat H., Wiley H. S. (2007) Cell surface receptors for signal transduction and ligand transport: a design principles study. PLoS Comput. Biol. 3, e101. [DOI] [PMC free article] [PubMed] [Google Scholar]
- 3. Haugh J. M. (2012) Cell regulation: a time to signal, a time to respond. Bioessays 34, 528–529 [DOI] [PMC free article] [PubMed] [Google Scholar]
- 4. Chew Y. H., Smith R. W., Jones H. J., Seaton D. D., Grima R., Halliday K. J. (2014) Mathematical models light up plant signaling. Plant Cell 26, 5–20 [DOI] [PMC free article] [PubMed] [Google Scholar]
- 5. Androulakis I. P., Kamisoglu K., Mattick J. S. (2013) Topology and dynamics of signaling networks: in search of transcriptional control of the inflammatory response. Annu. Rev. Biomed. Eng. 15, 1–28 [DOI] [PubMed] [Google Scholar]
- 6. Samaga R., Klamt S. (2013) Modeling approaches for qualitative and semi-quantitative analysis of cellular signaling networks. Cell Commun. Signal. 11, 43. [DOI] [PMC free article] [PubMed] [Google Scholar]
- 7. Gherardini P. F., Helmer-Citterich M. (2013) Experimental and computational methods for the analysis and modeling of signaling networks. N. Biotechnol. 30, 327–332 [DOI] [PubMed] [Google Scholar]
- 8. Zi Z., Chapnick D. A., Liu X. (2012) Dynamics of TGF-β/Smad signaling. FEBS Lett. 586, 1921–1928 [DOI] [PMC free article] [PubMed] [Google Scholar]
- 9. Hughey J. J., Lee T. K., Covert M. W. (2010) Computational modeling of mammalian signaling networks. Wiley Interdiscip. Rev. Syst. Biol. Med. 2, 194–209 [DOI] [PMC free article] [PubMed] [Google Scholar]
- 10. Cheong R., Levchenko A. (2008) Wires in the soup: quantitative models of cell signaling. Trends Cell Biol. 18, 112–118 [DOI] [PMC free article] [PubMed] [Google Scholar]
- 11. Di Ventura B., Lemerle C., Michalodimitrakis K., Serrano L. (2006) From in vivo to in silico biology and back. Nature 443, 527–533 [DOI] [PubMed] [Google Scholar]
- 12. Kitano H. (2002) Computational systems biology. Nature 420, 206–210 [DOI] [PubMed] [Google Scholar]
- 13. Wiley H. S., Shvartsman S. Y., Lauffenburger D. A. (2003) Computational modeling of the EGF-receptor system: a paradigm for systems biology. Trends Cell Biol. 13, 43–50 [DOI] [PubMed] [Google Scholar]
- 14. Piehler J., Thomas C., Garcia K. C., Schreiber G. (2012) Structural and dynamic determinants of type I interferon receptor assembly and their functional interpretation. Immunol. Rev. 250, 317–334 [DOI] [PMC free article] [PubMed] [Google Scholar]
- 15. Marunaka Y., Niisato N., Miyazaki H. (2005) New concept of spare receptors and effectors. J. Membr. Biol. 203, 31–39 [DOI] [PubMed] [Google Scholar]
- 16. Runkel L., deDios C., Karpusas M., Betzenhauser M., Muldowney C., Zafari M., Benjamin C. D., Miller S., Hochman P. S., Whitty A. (2000) Systematic mutational mapping of sites on human interferon-β-1a that are important for receptor binding and functional activity. Biochemistry 39, 2538–2551 [DOI] [PubMed] [Google Scholar]
- 17. Chen W. W., Schoeberl B., Jasper P. J., Niepel M., Nielsen U. B., Lauffenburger D. A., Sorger P. K. (2009) Input-output behavior of ErbB signaling pathways as revealed by a mass action model trained against dynamic data. Mol. Syst. Biol. 5, 239. [DOI] [PMC free article] [PubMed] [Google Scholar]
- 18. Nandagopal K., Popp D. M., Niyogi S. K. (2001) Utilization of a receptor reserve for effective amplification of mitogenic signaling by an epidermal growth factor mutant deficient in receptor activation. J. Cell. Biochem. 83, 326–341 [DOI] [PubMed] [Google Scholar]
- 19. Zhu B. T. (1993) The competitive and noncompetitive antagonism of receptor-mediated drug actions in the presence of spare receptors. J. Pharmacol. Toxicol. Methods 29, 85–91 [DOI] [PubMed] [Google Scholar]
- 20. Bakstad D., Adamson A., Spiller D. G., White M. R. (2012) Quantitative measurement of single cell dynamics. Curr. Opin. Biotech. 23, 103–109 [DOI] [PubMed] [Google Scholar]
- 21. Awais M., Ozawa T. (2011) Illuminating intracellular signaling and molecules for single cell analysis. Mol. BioSyst. 7, 1376–1387 [DOI] [PubMed] [Google Scholar]
- 22. Spiller D. G., Wood C. D., Rand D. A., White M. R. (2010) Measurement of single-cell dynamics. Nature 465, 736–745 [DOI] [PubMed] [Google Scholar]
- 23. Kolitz S. E., Lauffenburger D. A. (2012) Measurement and modeling of signaling at the single-cell level. Biochemistry 51, 7433–7443 [DOI] [PMC free article] [PubMed] [Google Scholar]
- 24. Huang P. H., White F. M. (2008) Phosphoproteomics: unraveling the signaling web. Mol. Cell 31, 777–781 [DOI] [PMC free article] [PubMed] [Google Scholar]
- 25. Rogne M., Taskén K. (2013) Cell signalling analyses in the functional genomics era. N. Biotechnol. 30, 333–338 [DOI] [PubMed] [Google Scholar]
- 26. Purvis J. E., Lahav G. (2013) Encoding and decoding cellular information through signaling dynamics. Cell 152, 945–956 [DOI] [PMC free article] [PubMed] [Google Scholar]
- 27. Ganesan A., Zhang J. (2012) How cells process information: quantification of spatiotemporal signaling dynamics. Protein Sci. 21, 918–928 [DOI] [PMC free article] [PubMed] [Google Scholar]
- 28. Slusarczyk A. L., Weiss R. (2012) Understanding signaling dynamics through synthesis. Sci. Signal. 5, pe16. [DOI] [PubMed] [Google Scholar]
- 29. Lee H.-W., Kyung T., Yoo J., Kim T., Chung C., Ryu J. Y., Lee H., Park K., Lee S., Jones W. D., Lim D.-S., Hyeon C., Heo W. D., Yoon T.-Y. (2013) Real-time single-molecule co-immunoprecipitation analyses reveal cancer-specific Ras signalling dynamics. Nat. Commun. 4, 1505. [DOI] [PMC free article] [PubMed] [Google Scholar]
- 30. Zi Z., Feng Z., Chapnick D. A., Dahl M., Deng D., Klipp E., Moustakas A., Liu X. (2011) Quantitative analysis of transient and sustained transforming growth factor-β signaling dynamics. Mol. Syst. Biol. 7, 492. [DOI] [PMC free article] [PubMed] [Google Scholar]
- 31. Ciaccio M. F., Wagner J. P., Chuu C.-P., Lauffenburger D. A., Jones R. B. (2010) Systems analysis of EGF receptor signaling dynamics with microwestern arrays. Nat. Methods 7, 148–155 [DOI] [PMC free article] [PubMed] [Google Scholar]
- 32. Schmierer B., Tournier A. L., Bates P. A., Hill C. S. (2008) Mathematical modeling identifies Smad nucleocytoplasmic shuttling as a dynamic signal-interpreting system. Proc. Natl. Acad. Sci. U.S.A. 105, 6608–6613 [DOI] [PMC free article] [PubMed] [Google Scholar]
- 33. Yosef N., Regev A. (2011) Impulse control: temporal dynamics in gene transcription. Cell 144, 886–896 [DOI] [PMC free article] [PubMed] [Google Scholar]
- 34. Chan S. M., Ermann J., Su L., Fathman C. G., Utz P. J. (2004) Protein microarrays for multiplex analysis of signal transduction pathways. Nat. Med. 10, 1390–1396 [DOI] [PubMed] [Google Scholar]
- 35. Wang C. C., Cirit M., Haugh J. M. (2009) PI3K-dependent cross-talk interactions converge with Ras as quantifiable inputs integrated by Erk. Mol. Syst. Biol. 5, 246. [DOI] [PMC free article] [PubMed] [Google Scholar]
- 36. Blagoev B., Ong S. E., Kratchmarova I., Mann M. (2004) Temporal analysis of phosphotyrosine-dependent signaling networks by quantitative proteomics. Nat. Biotechnol. 22, 1139–1145 [DOI] [PubMed] [Google Scholar]
- 37. Albeck J. G., Mills G. B., Brugge J. S. (2013) Frequency-modulated pulses of ERK activity transmit quantitative proliferation signals. Mol. Cell 49, 249–261 [DOI] [PMC free article] [PubMed] [Google Scholar]
- 38. Fujita K. A., Toyoshima Y., Uda S., Ozaki Y., Kubota H., Kuroda S. (2010) Decoupling of receptor and downstream signals in the Akt pathway by its low-pass filter characteristics. Sci. Signal. 3, ra56. [DOI] [PubMed] [Google Scholar]
- 39. Runeberg-Roos P., Saarma M. (2007) Neurotrophic factor receptor RET: structure, cell biology, and inherited diseases. Ann. Med. 39, 572–580 [DOI] [PubMed] [Google Scholar]
- 40. Salehian B., Samoa R. (2013) RET gene abnormalities and thyroid disease: who should be screened and when. J. Clin. Res. Pediatr. Endocrinol. 5, suppl. 1, 70–78 [DOI] [PMC free article] [PubMed] [Google Scholar]
- 41. Gattelli A., Nalvarte I., Boulay A., Roloff T. C., Schreiber M., Carragher N., Macleod K. K., Schlederer M., Lienhard S., Kenner L., Torres-Arzayus M. I., Hynes N. E. (2013) Ret inhibition decreases growth and metastatic potential of estrogen receptor positive breast cancer cells. EMBO Mol. Med. 5, 1335–1350 [DOI] [PMC free article] [PubMed] [Google Scholar]
- 42. Morandi A., Martin L.-A., Gao Q., Pancholi S., Mackay A., Robertson D., Zvelebil M., Dowsett M., Plaza-Menacho I., Isacke C. M. (2013) GDNF-RET signaling in ER-positive breast cancers is a key determinant of response and resistance to aromatase inhibitors. Cancer Res. 73, 3783–3795 [DOI] [PMC free article] [PubMed] [Google Scholar]
- 43. Phay J. E., Shah M. H. (2010) Targeting RET receptor tyrosine kinase activation in cancer. Clin. Cancer Res. 16, 5936–5941 [DOI] [PubMed] [Google Scholar]
- 44. Plaza-Menacho I., Morandi A., Robertson D., Pancholi S., Drury S., Dowsett M., Martin L. A., Isacke C. M. (2010) Targeting the receptor tyrosine kinase RET sensitizes breast cancer cells to tamoxifen treatment and reveals a role for RET in endocrine resistance. Oncogene 29, 4648–4657 [DOI] [PubMed] [Google Scholar]
- 45. Airaksinen M. S., Titievsky A., Saarma M. (1999) GDNF family neurotrophic factor signaling: four masters, one servant? Mol. Cell. Neurosci. 13, 313–325 [DOI] [PubMed] [Google Scholar]
- 46. Ibáñez C. F. (2013) Structure and physiology of the RET receptor tyrosine kinase. Cold Spring Harb. Perspect. Biol. 5, a009134. [DOI] [PMC free article] [PubMed] [Google Scholar]
- 47. Kawamoto Y., Takeda K., Okuno Y., Yamakawa Y., Ito Y., Taguchi R., Kato M., Suzuki H., Takahashi M., Nakashima I. (2004) Identification of RET autophosphorylation sites by mass spectrometry. J. Biol. Chem. 279, 14213–14224 [DOI] [PubMed] [Google Scholar]
- 48. Prazeres H., Torres J., Rodrigues F., Couto J. P., Vinagre J., Sobrinho-Simões M., Soares P. (2011) How to treat a signal? Current basis for RET-genotype-oriented choice of kinase inhibitors for the treatment of medullary thyroid cancer. J. Thyroid Res. 2011, 678357. [DOI] [PMC free article] [PubMed] [Google Scholar]
- 49. Carter Y., Jaskula-Sztul R., Chen H., Mazeh H. (2013) Signaling pathways as specific pharmacologic targets for neuroendocrine tumor therapy: RET, PI3K, MEK, growth factors, and Notch. Neuroendocrinology 97, 57–66 [DOI] [PMC free article] [PubMed] [Google Scholar]
- 50. Schlee S., Carmillo P., Whitty A. (2006) Quantitative analysis of the activation mechanism of the multicomponent growth-factor receptor Ret. Nat. Chem. Biol. 2, 636–644 [DOI] [PubMed] [Google Scholar]
- 51. Hanada M., Feng J., Hemmings B. A. (2004) Structure, regulation and function of PKB/AKT– a major therapeutic target. Biochim. Biophys. Acta 1697, 3–16 [DOI] [PubMed] [Google Scholar]
- 52. Roskoski R., Jr. (2012) ERK1/2 MAP kinases: structure, function, and regulation. Pharmacol. Res. 66, 105–143 [DOI] [PubMed] [Google Scholar]
- 53. Gardell L. R., Wang R., Ehrenfels C., Ossipov M. H., Rossomando A. J., Miller S., Buckley C., Cai A. K., Tse A., Foley S. F., Gong B., Walus L., Carmillo P., Worley D., Huang C., et al. (2003) Multiple actions of systemic artemin in experimental neuropathy. Nat. Med. 9, 1383–1389 [DOI] [PubMed] [Google Scholar]
- 54. Sanicola M., Hession C., Worley D., Carmillo P., Ehrenfels C., Walus L., Robinson S., Jaworski G., Wei H., Tizard R., Whitty A., Pepinsky R. B., Cate R. L. (1997) Glial cell line-derived neurotrophic factor-dependent RET activation can be mediated by two different cell-surface accessory proteins. Proc. Natl. Acad. Sci. U.S.A. 94, 6238–6243 [DOI] [PMC free article] [PubMed] [Google Scholar]
- 55. Carmillo P., Dagø L., Day E. S., Worley D. S., Rossomando A., Walus L., Orozco O., Buckley C., Miller S., Tse A., Cate R. L., Rosenblad C., Sah D. W., Grønborg M., Whitty A. (2005) Glial cell line-derived neurotrophic factor (GDNF) receptor α-1 (GFR α1) is highly selective for GDNF versus artemin. Biochemistry 44, 2545–2554 [DOI] [PubMed] [Google Scholar]
- 56.Manufacturer's Data Sheet, PDF-PathScan Phospho-p44/42 MAPK (Thr-202/Tyr-204) Sandwich ELISA Kit (7177). Cell Signaling Technology, Beverly, MA [Google Scholar]
- 57.Manufacturer's Data Sheet, PDF-PathScan Phospho-Akt1 (Ser-473) Sandwich ELISA Kit (7160). Cell Signaling Technology, Beverly, MA [Google Scholar]
- 58. Baloh R. H., Tansey M. G., Lampe P. A., Fahrner T. J., Enomoto H., Simburger K. S., Leitner M. L., Araki T., Johnson E. M., Jr., Milbrandt J. (1998) Artemin, a novel member of the GDNF ligand family, supports peripheral and central neurons and signals through the GFRα3-RET receptor complex. Neuron 21, 1291–1302 [DOI] [PubMed] [Google Scholar]
- 59. Masure S., Geerts H., Cik M., Hoefnagel E., Van Den Kieboom G., Tuytelaars A., Harris S., Lesage A. S., Leysen J. E., Van Der Helm L., Verhasselt P., Yon J., Gordon R. D. (1999) Enovin, a member of the glial cell-line-derived neurotrophic factor (GDNF) family with growth promoting activity on neuronal cells. Existence and tissue-specific expression of different splice variants. Eur. J. Biochem. 266, 892–902 [DOI] [PubMed] [Google Scholar]
- 60. Andres R., Forgie A., Wyatt S., Chen Q., de Sauvage F. J., Davies A. M. (2001) Multiple effects of artemin on sympathetic neurone generation, survival and growth. Development 128, 3685–3695 [DOI] [PubMed] [Google Scholar]
- 61. Paveliev M., Airaksinen M. S., Saarma M. (2004) GDNF family ligands activate multiple events during axonal growth in mature sensory neurons. Mol. Cell. Neurosci. 25, 453–459 [DOI] [PubMed] [Google Scholar]
- 62. Zihlmann K. B., Ducray A. D., Schaller B., Huber A. W., Krebs S. H., Andres R. H., Seiler R. W., Meyer M., Widmer H. R. (2005) The GDNF family members neurturin, artemin and persephin promote the morphological differentiation of cultured ventral mesencephalic dopaminergic neurons. Brain Res. Bull. 68, 42–53 [DOI] [PubMed] [Google Scholar]
- 63. Warnecke A., Scheper V., Buhr I., Wenzel G. I., Wissel K., Paasche G., Berkingali N., Jørgensen J. R., Lenarz T., Stöver T. (2010) Artemin improves survival of spiral ganglion neurons in vivo and in vitro. Neuroreport 21, 517–521 [DOI] [PubMed] [Google Scholar]
- 64. Ramos J. W. (2008) The regulation of extracellular signal-regulated kinase (ERK) in mammalian cells. Int. J. Biochem. Cell Biol. 40, 2707–2719 [DOI] [PubMed] [Google Scholar]
- 65. Adachi T., Kar S., Wang M., Carr B. I. (2002) Transient and sustained ERK phosphorylation and nuclear translocation in growth control. J. Cell. Physiol. 192, 151–159 [DOI] [PubMed] [Google Scholar]
- 66. Sasagawa S., Ozaki Y., Fujita K., Kuroda S. (2005) Prediction and validation of the distinct dynamics of transient and sustained ERK activation. Nat. Cell Biol. 7, 365–373 [DOI] [PubMed] [Google Scholar]
- 67. Marshall C. J. (1995) Specificity of receptor tyrosine kinase signaling: transient versus sustained extracellular signal-regulated kinase activation. Cell 80, 179–185 [DOI] [PubMed] [Google Scholar]
- 68. Shankaran H., Ippolito D. L., Chrisler W. B., Resat H., Bollinger N., Opresko L. K., Wiley H. S. (2009) Rapid and sustained nuclear-cytoplasmic ERK oscillations induced by epidermal growth factor. Mol. Syst. Biol. 5, 332. [DOI] [PMC free article] [PubMed] [Google Scholar]
- 69. Birtwistle M. R., Rauch J., Kiyatkin A., Aksamitiene E., Dobrzyński M., Hoek J. B., Kolch W., Ogunnaike B. A., Kholodenko B. N. (2012) Emergence of bimodal cell population responses from the interplay between analog single-cell signaling and protein expression noise. BMC Syst. Biol. 6, 109. [DOI] [PMC free article] [PubMed] [Google Scholar]
- 70. Shankaran H., Wiley H. S. (2010) Oscillatory dynamics of the extracellular signal-regulated kinase pathway. Curr. Opin. Genet. Dev. 20, 650–655 [DOI] [PubMed] [Google Scholar]
- 71. Houser B. (2012) Bio-Rad's Bio-Plex suspension array system, xMAP technology overview. Arch. Physiol. Biochem. 118, 192–196 [DOI] [PMC free article] [PubMed] [Google Scholar]
- 72. Meyer R., D'Alessandro L. A., Kar S., Kramer B., She B., Kaschek D., Hahn B., Wrangborg D., Karlsson J., Kvarnström M., Jirstrand M., Lehmann W.-D., Timmer J., Höfer T., Klingmüller U. (2012) Heterogeneous kinetics of AKT signaling in individual cells are accounted for by variable protein concentration. Front. Physiol. 3, 451. [DOI] [PMC free article] [PubMed] [Google Scholar]
- 73. Park C. S., Schneider I. C., Haugh J. M. (2003) Kinetic analysis of platelet-derived growth factor receptor/phosphoinositide 3-kinase/Akt signaling in fibroblasts. J. Biol. Chem. 278, 37064–37072 [DOI] [PubMed] [Google Scholar]
- 74. Rogers K. W., Schier A. F. (2011) Morphogen gradients: from generation to interpretation. Annu. Rev. Cell Dev. Biol. 27, 377–407 [DOI] [PubMed] [Google Scholar]
- 75. Guthridge M. A., Powell J. A., Barry E. F., Stomski F. C., McClure B. J., Ramshaw H., Felquer F. A., Dottore M., Thomas D. T., To B., Begley C. G., Lopez A. F. (2006) Growth factor pleiotropy is controlled by a receptor Tyr/Ser motif that acts as a binary switch. EMBO J. 25, 479–489 [DOI] [PMC free article] [PubMed] [Google Scholar]
- 76. Perrett R. M., Fowkes R. C., Caunt C. J., Tsaneva-Atanasova K., Bowsher C. G., McArdle C. A. (2013) Signaling to extracellular signal-regulated kinase from ErbB1 kinase and protein kinase C: feedback, heterogeneity, and gating. J. Biol. Chem. 288, 21001–21014 [DOI] [PMC free article] [PubMed] [Google Scholar]
- 77. Humphrey S. J., Yang G., Yang P., Fazakerley D. J., Stöckli J., Yang J. Y., James D. E. (2013) Dynamic adipocyte phosphoproteome reveals that Akt directly regulates mTORC2. Cell Metab. 17, 1009–1020 [DOI] [PMC free article] [PubMed] [Google Scholar]