Background: The in vivo functions of PKD1 are potentially associated with cancer development and aging.
Results: Our results indicate that PKD1 is a key regulator involved in determining the threshold at which mitochondrial membranes depolarize after reactive oxygen-induced stress.
Conclusion: This study defines a new function for PKD1 during reactive oxygen signaling.
Significance: The involvement of PKD1 in mitochondrial depolarization suggests that PKD1 may be a therapeutic target.
Keywords: Cell Signaling, Gene Knockout, Mitochondrial Apoptosis, Protein Kinase C (PKC), Protein Kinase D (PKD), Reactive Oxygen Species (ROS)
Abstract
In this study, we used gene targeting in mice to identify the in vivo functions of PKD1. In addition to phenotypically characterizing the resulting knock-out animals, we also used mouse embryonic fibroblasts to investigate the associated signaling pathways in detail. This study is the first to use genetic deletion to reveal that PKD1 is a key regulator involved in determining the threshold of mitochondrial depolarization that leads to the production of reactive oxygen species. In addition, we also provide clear evidence that PKCδ is upstream of PKD1 in this process and acts as the activating kinase of PKD1. Therefore, our in vivo data indicate that PKD1 functions not only in the context of aging but also during nutrient deprivation, which occurs during specific phases of tumor growth.
Introduction
The protein kinase D (PKD) family of Ser/Thr specific kinases consists of three members: PKD1–3. Originally identified as new members of the protein kinase C (PKC) family, the PKCs and PKDs share the overall molecular structure of an N-terminal regulatory domain and a C-terminal kinase domain. In addition, PKDs also contain tandem C1A/C1B motifs within the N terminus, similar to PKCs. This motif connects PKDs to the diacylglycerol-mediated signaling pathway, which is involved in diverse functions, and thereby defines them as multifunctional kinases (1). One major structural difference between PKC and PKD enzymes is that the latter enzymes contain a pleckstrin homology domain in the N terminus that is believed to provide an auto-inhibitory function by influencing the conformational status of the enzyme. Currently, PKDs are classified into the calcium/calmodulin-dependent kinase (CaMK) family (2). PKD1, formerly called PKCμ, represents the first isoform to be identified and has thus served as a representative for this kinase family in many studies. By contrast, isoform-specific data regarding the in vivo functions of all PKD family members are limited. The general activation of PKDs has been proposed to be mediated by the transphosphorylation of PKD1 Ser-744 and Ser-748 in mice by novel PKC isoforms; these isoforms must co-localize at lipid membranes, thereby providing a link between the PKC and PKD signaling cascades. As a consequence, the C-terminal Ser-910 is auto-phosphorylated. Both events are established markers of the activation status of PKDs. However, recent research also identified a signaling pathway that activates PKDs without PKC activity (3). Nevertheless, the PKC/PKD axis represents an established signaling cascade of PKD-mediated signal transduction (4). In particular, PKCδ and PKD1 have been established as a signaling pair in the context of reactive oxygen species (ROS)2-mediated signaling. PKCδ has been established as a mediator of apoptotic responses to various stimuli and to possibly modulate the mitochondrial membrane potential (5). In this context, as a nuclear protein of unknown function (6), PKD1 was identified as a binding protein of PKCδ and an intermediary of NFκB-mediated transcriptional responses, such as manganese superoxide dismutase expression, to support cell survival (7). Mitochondria, in addition to their substantial function in energy metabolism, have also been shown to play essential roles in the initiation of intracellular apoptotic signaling (8). Upon oxidative stress, pores are established or activated at the mitochondrial membrane, causing the release of cytochrome c and the subsequent induction of an apoptotic signaling cascade that leads to cell death. This process can be mediated by either (i) mitochondrial apoptosis-induced channels that are formed in the outer mitochondrial membrane by the pro-apoptotic Bcl-2 family members Bax and Bak (9) or (ii) the mitochondrial permeability transition pore, which consists of several proteins, including VDAC, in addition to Bax, which is proposed to exert modulatory functions in this context (10, 11). In both mechanisms, the exact details of pore assembly and/or activation are still debated, and the number of required phosphorylation events is unclear. In the present study, we identified PKCδ and PKD1 to be functionally involved in these processes.
EXPERIMENTAL PROCEDURES
Generation of a Mutant PKD1 Allele in Mice
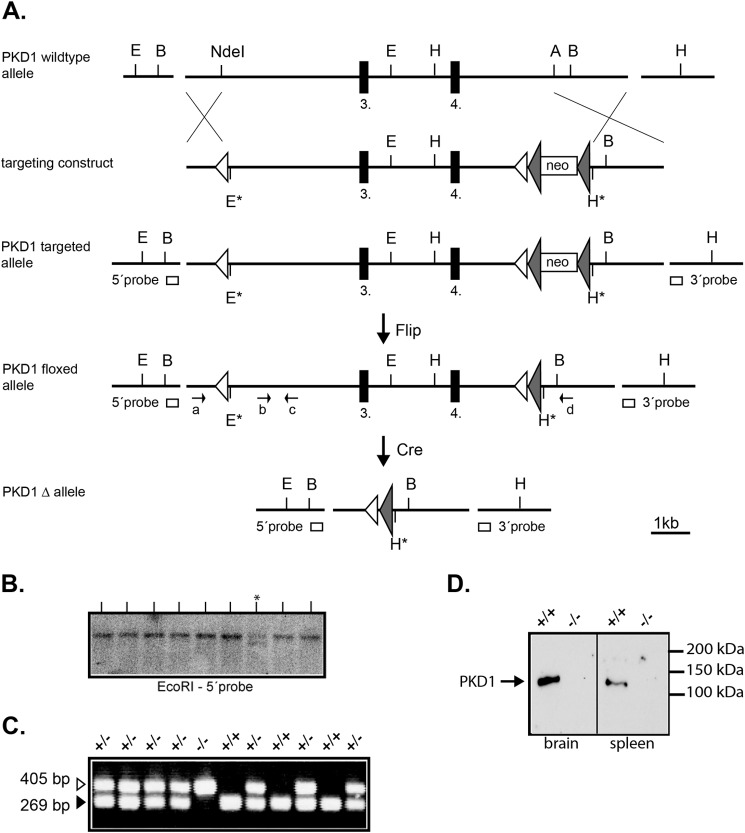
To clone a targeting vector for the PKD1 gene locus, we obtained a bacterial artificial chromosome clone from Source BioScience and identified the desired sequence via the Ensembl gene browser. This bacterial artificial chromosome contained the 3rd and 4th exon of the PKD1 gene (clone ID: bMQ-293J18). After verifying the sequence of the obtained bacterial artificial chromosome clone, we applied recombineering tools and strategies (http://redrecombineering.ncifcrf.gov/) to clone a targeting vector for the PKD1 gene locus. The final construct contained a single LoxP site 5′ of the 3rd exon and a second LoxP site 3′ of the 4th exon. This latter site was immediately followed by a neomycin expression cassette flanked by Frt sites. Thus, upon incubation with the Cre and the Flp recombinase, a deletion of an ∼8.0-kb genomic fragment, including exons 3 and 4, is predicted to occur, causing a frameshift within the transcript and leading to a nonsense mRNA. Overall, the generated targeting vector contained an 11.9-kb genomic sequence of the PKD1 locus. Prior to electroporation, the targeting vector was linearized with NotI at the 5′ end of the genomic sequence. Embryonic stem (ES) cells from the substrain E14.1 (129/Ola background), kindly provided by Ralf Kühn, Institute for Genetics, Cologne, Germany, were electroporated with 40 μg of linearized vector and selected for G418 resistance for 10 days. Out of three independent electroporations, at least 2 × 96 resistant clones per electroporation were screened for homologous recombination of the targeting vector by Southern blot analysis. An endogenous probe (5′ probe; see Fig. 1) was used to identify a 19-kb fragment in the wild type in addition to a 15.3-kb fragment after homologous recombination. Positive clones were then further characterized for correct and single integration of the targeting vector using different probes and restriction enzymes. The observed targeting frequency was ∼1%. Two verified, independent ES cell clones were then further used for injections into C57Bl/6 blastocysts. Chimeric males were obtained for both clones and subsequently mated to C57Bl/6 females to test for germ-line transmission. Both lines generated F1 heterozygous males, which were then immediately crossed to a ubiquitously expressing Flp transgenic line to delete the neomycin cassette. The success of this deletion was confirmed with a specific neomycin PCR and a Southern blot analysis using the neo gene as a probe. The resulting mouse line represents a floxed PKD1 allele (PKD1flox/+), which can be used for tissue- and cell-specific deletion analysis using Cre transgenic animals. For this study, we crossed the PKD1flox/+ mice to a ubiquitous Cre-expressing transgenic line to obtain a null allele (PKD1Δ/+). Again, the functionality of the LoxP sites was confirmed by Southern blot analysis and a specific PCR assay. PKD1Δ/+ heterozygous breeding pairs were then used to establish a homozygous PKD1Δ/Δ mouse line for the initial analysis. For standard genotyping, genomic DNA was prepared from ear tag biopsies and used as the template in a specific PCR using the following primers: a: CCT ACC TTG AGC TTA GAG CAA CTC C; b: GCT TGG CAT GCT TGT TTG GAG ATG GG; c: GAT GAC AGG AGG ATG CTC ATG AGT GG; and d: CCT TCT CCT CAT GGA AGG GAA CAC C. The primer pair a/d gave rise to a 405-bp mutant fragment in the case of a deletion, whereas primer pair b/c gave rise to a 262-bp wild-type fragment, which only occurs when no deletion is present.
FIGURE 1.
Targeting the PKD1 locus in mice. A, a schematic representation of the chosen gene targeting strategy is shown. The relevant restriction sites are indicated (A, AflII; B, BamHI; E, EcoRI; H, HindIII and NdeI). The black boxes represent the 3rd and 4th exon of the PKD1 gene. The white boxes represent the PCR-amplified DNA probes (5′ and 3′ probe) used for the Southern blot analysis. The open triangles are loxP sites, and the filled triangles represent FRT sites. The top shows the wild-type PKD1 gene locus, part of which was chosen for targeting, followed below by a schematic view of the targeting vector containing a single loxP site 5′ of the 3rd exon and an inserted neo cassette 3′ of the 4th exon. The targeted PKD1 allele represents the PKD1 gene locus after homologous recombination with the targeting vector, which gave rise to the PKD1 floxed allele shown after crossing to a ubiquitously expressing Flp mouse line. Subsequently, the PKD1 floxed allele was crossed to a mouse line with ubiquitous Cre expression, generating the PKD1Δ allele shown at the bottom. B, representative Southern blot screen of G418-resistant ES cell clones after electroporation of the targeting vector. An EcoRI digest identifies a wild-type 19.0-kb genomic DNA fragment (present in all lanes) and a recombinant 15.3-kb (lane marked with asterisk) genomic DNA fragment using the 5′ probe. C, representative PCR genotyping of one litter generated from crossing PKD1Δ/+ mice. The primer pairs used amplify either a 269-bp WT fragment (b-c) or a deletion-specific fragment of 405 bp (a-d). The genotypes are indicated above (+/+; +/−; −/−). D, Western blot analysis of wild-type (+/+) and PKD1-deficient (−/−) whole cell brain and spleen extracts. Western blots were performed as described under “Experimental Procedures” using a PKD1-specific antibody to show the lack of PKD1 protein.
Isolation of MEFs, Immortalization, and Cell Culture
For the isolation of mouse embryonic fibroblasts (MEFs) expressing the PKD1 mutant allele, we used heterozygous matings of PKD1Δ/+ animals. Embryos that were 12.5–13.5 days post coitum were used for the preparation, according to standard protocols (12). To immortalize MEFs, we used a modified NIH 3T3 protocol. The MEFs were cultured in Gibco DMEM+ GlutaMAXTM-I (Invitrogen) medium with 10% Gibco fetal calf serum (Invitrogen), Gibco non-essential amino acids (Invitrogen), penicillin (50 units/ml), and streptomycin (100 μg/ml) (Invitrogen).
Mitochondrial Depolarization Assay
MEFs were collected via trypsinization and washed twice with cold PBS. Then, to load the mitochondria, the cells were resuspended in serum- and cresol red-free medium containing tetramethylrhodamine methyl ester (TMRM) in MeOH at 100 nm and incubated in the dark for 45 min at 37 °C. Mitochondrial depolarization was induced by H2O2 treatment at a given concentration. The released TMRM was washed out with PBS, and the cells were analyzed using a BD FACSCantoTM II flow cytometer. Intact mitochondria show an emission in the phycoerythrin channel, whereas depolarized mitochondria show a reduced emission.
Protein Extraction and Western Blotting
Whole cell and fractionated protein extraction were performed using the TransFactor extraction kit from Clontech Laboratories, Inc. (catalog number 631921), following the manufacturer's instructions. Protein extracts were analyzed by SDS-polyacrylamide gel electrophoresis (8% for PKD1 and 15% for VDAC, cytochrome c, Bax, and Bcl-xL). This step was followed by wet blotting onto Bio-Rad nitrocellulose membranes using a Hoefer apparatus. The protein levels used for electrophoresis were evaluated using the Bradford assay. The membranes were blocked with 1% Tween-PBS containing 5% (w/v) skim milk PBST for 1 h at room temperature. Then, the membranes were incubated with primary antibodies in 5% (w/v) skim milk PBST (3.2 mm Na2HPO4, 0.5 mm KH2PO4, 1.3 mm KCl, 135 mm NaCl, 0.05% Tween® 20, pH 7.4) overnight at 4 °C, followed by incubation with secondary antibodies in 2.5% (w/v) skim milk PBST for various durations, depending on the epitope (2 h at room temperature to overnight at 4 °C). For chemiluminescence detection, SuperSignal West Pico from Pierce (product number 34078) was used according to the manufacturer's protocol.
Antibodies Used
Anti-PKD/PKCμ (2052) (1:1000 dilution), anti-phospho-PKD Ser-744/Ser-748 (2054S)(1:1000 dilution), anti-Bcl-xL (2764) (1:5000 dilution), anti-Bax (2772)(1:2000 dilution), anti-cytochrome c (4272) (1:500 dilution), anti-GAPDH (2118) (1:5000 dilution), and anti-VDAC (4661) (1:5000 dilution) were purchased from Cell Signaling. Anti-Bax[6A7] (ab5714) (1:500 dilution) was purchased from Abcam. A goat anti-rabbit HRPO antibody (111-035-003) (1:10000) was purchased from Jackson ImmunoResearch Laboratories. Alexa Fluor® 488 anti-BrdU (A23210) and Alexa Fluor® 647 goat anti-rabbit IgG (H+L) antibodies (A22287) (1:500 dilution) were purchased from Invitrogen.
ROS Detection
2′,7′-dichlorodihydrofluorescein diacetate (H2DCFDA) was purchased from Invitrogen. ROS detection was performed according to the manufacturer's protocol. Cells that were either treated with peroxide or starved were collected and stained with 2 mm H2DCFDA in prewarmed Hanks' buffered saline solution at 37 °C in the dark for 45 min. ROS oxidize H2DCFDA to DCFDA, which is highly fluorescent. The cells in suspension after washing were analyzed using a BD FACSCaliburTM flow cytometer. The strength of the fluorescent signal indicates the intracellular amount of ROS.
Confocal Immunofluorescent Imaging and Quantification
Cells growing on gelatin-coated coverslips (Marienfeld-Superior) were treated with different concentrations of peroxide and fixed with 4% paraformaldehyde for 15 min. The cells were then permeabilized with 0.01% Triton X-100 for 15 min at room temperature. The primary antibody was diluted in 3% BSA with 0.1% Tween in PBS and incubated with the cells overnight at 4 °C. The cells were incubated with the secondary antibody for 2 h at room temperature. We used VECTASHIELD mounting medium containing DAPI (purchased from Vector Laboratories) for mounting prior to the microscopic analysis. The cells were visualized using a Zeiss LSM 510 Meta inverted microscope equipped with a Zeiss LSM laser module. Images were acquired with an AxioCam HMr digital camera. The digital color pictures were processed and enhanced using Adobe Photoshop CS6 (Adobe Systems Inc.) and analyzed using the ImageJ 1.47v software. The regions of interest were circled, and the functional plugin “analyze” was used to obtain the “Mean Gray Value.” Standard deviations were calculated.
TUNEL
The APO-BrdUTM TUNEL assay kit was purchased from Invitrogen, and the assay was performed according to the user manual. Cells were collected by trypsinization, washed twice with PBS, and fixed with −20 °C ethanol. The fixed cells were incubated at room temperature overnight with terminal deoxynucleotidyl transferase and the deoxythymidine analog BrdUTP. The cells were then incubated with the Alexa Fluor® 488-labeled anti-BrdU antibody. Suspended cells were analyzed with a BD FACSCaliburTM flow cytometer.
Reverse Transcription and Quantitative PCR
Wild-type, PKCδ−/−, and PKD1−/− MEFs were collected by trypsinization, and mRNA was extracted using an RNeasy® micro kit (Qiagen). Reverse transcription was performed with the iScriptTM cDNA synthesis kit (Bio-Rad). For real-time PCR, the following primer pairs were used: bax (TTGCTGATGGCAACTTCAAC; GATCAGCTCGGGCACTTTAG); bcl-xL (GTTGGATGGCCACCTATCTG; GCTGCATTGTTCCCGTAGAG); and Gapdh (TCGTCCCGTAGACAAAATGG; TTGAGGTCAATGAAGGGGTC). For the quantitative PCR reaction, iQTM SYBR® Green supermix (Bio-Rad) was used in combination with the iCycler iQTM multicolor real-time PCR detection system (iCycler iQTM Optical module). The generated data were processed primarily using the iCycler software. The relative transcription level was calculated by comparing the target gene values with the Gapdh expression levels. The data were further analyzed with Microsoft Office Excel (2007) to calculate the mean and S.D. and to perform the t test.
Generation of PKD-overexpressing MEF Lines
To overexpress individual PKD1–3 isoforms in PKD1−/− MEFs, we used the pLenti6/TR vector system according to manufacturer's instructions obtained from Invitrogen (catalog number V480-20). To use the Gateway system (Invitrogen) for subcloning, mouse cDNAs for each PKD isoform were subcloned into the pENTRTM/d-TOPO vector (Invitrogen, catalog number K2400-20).
RESULTS
Targeted Inactivation of the PKD1 Gene in Mouse
To identify and analyze the in vivo functions of PKD1, we generated a PKD1-deficient mouse line using standard gene targeting approaches (details under “Experimental Procedures” and in Fig. 1). Heterozygous intercrosses of PKD1+/− mice revealed a change of the normal Mendelian ratio from 25 to 14% of the PKD−/− genotype (in total 166 progeny were genotyped, and 45 wild-type (27%), 98 heterozygous (59%), and 23 (14%) homozygous individuals were obtained). The reason for this partial embryonic lethality is not clear but will be analyzed in future studies. Aside from this phenomenon, PKD1-deficient animals appear normal upon gross analysis, showing no obvious abnormal phenotype within the first 6–9 months of age. The mice are fertile and exhibit normal productive rates, with an average litter size of six on the given hybrid 129.C57Bl/6 background. To further characterize alterations of PKD1-dependent signaling pathways in the absence of PKD1, we established immortalized MEFs from PKD1-depleted embryos, which were used in the following experiments.
Altered ROS-mediated Depolarization of the Mitochondrial Membrane in PKD1- and PKCδ-deficient MEFs
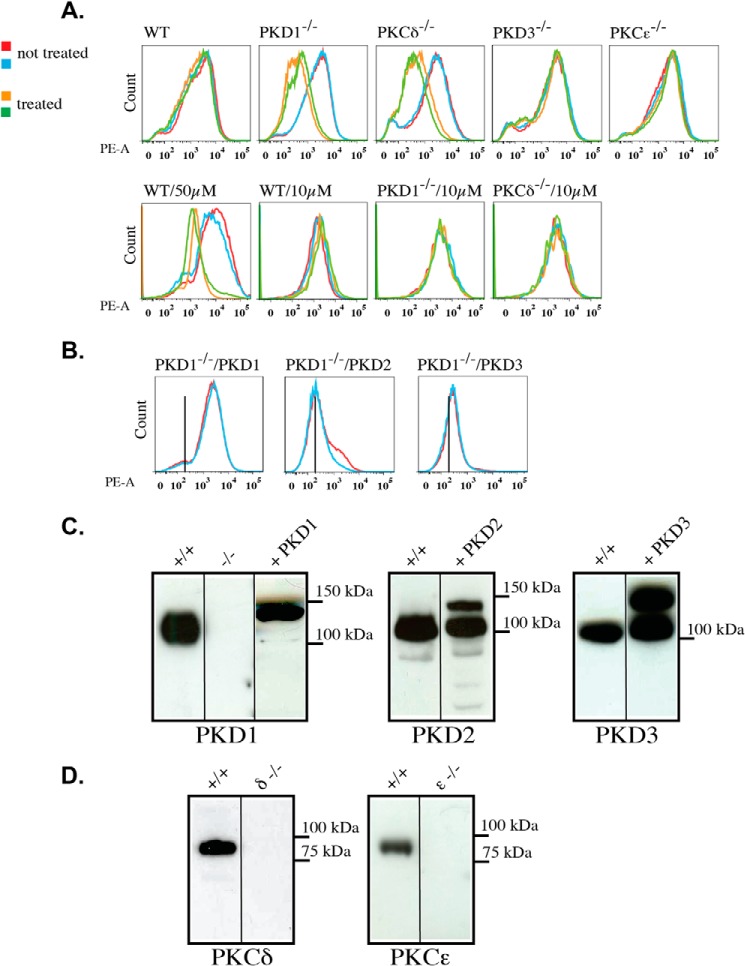
Among other signaling pathways, PKD1 has been particularly associated with ROS-mediated cellular responses in the context of mitochondria-induced cell death. Thus, in the first set of experiments, we analyzed the depolarization behavior of mitochondria to characterize PKD1-deficient MEFs. MEFs were loaded with TMRM to measure the inner mitochondrial membrane potential and permeability transition in response to H2O2. Specifically, the MEFs were incubated with 10, 25, or 50 μm H2O2 for 15 min at 37 °C and then analyzed by FACS. As indicated in the histograms in Fig. 2A, wild-type mitochondria do not depolarize following treatment with 10 and 25 μm H2O2, but they showed clear mitochondrial membrane depolarization upon 50 μm H2O2 treatment. This shift was indicated by the left shift of the peak, which is the expected result based on the published literature. In sharp contrast, PKD1−/− mitochondria showed a robust depolarization after 25 μm, but not 10 μm, H2O2 treatment, indicating that the threshold of depolarization is decreased in PKD1-deficient MEFs. Interestingly, PKCδ−/− mitochondria exhibited the same phenotype, implying that PKCδ and PKD1 might act in the same pathway. To obtain a clearer picture of isoform specificity in this context, we also used PKCϵ- (as another novel PKC family member) and PKD3- (another PKD isoform) deficient MEFs in the TMRM assay. When using these cells, we did not detect mitochondrial depolarization after 25 μm H2O2 treatment (Fig. 2A). Furthermore, we performed rescue experiments using lentivirus-based expression of all three PKD enzymes in PKD1−/− MEFs. Only the re-expression of PKD1 (but not PKD2 or PKD3) was able to reverse the observed phenotype to the wild-type status (Fig. 2B). The corresponding expression levels of the exogenously introduced PKDs are indicated in Fig. 2C. It should be noted that the high endogenous expression levels of PKD2 and PKD3 in PKD1-deficient MEFs are unchanged when compared with wild-type MEFs (data not shown). In addition, individual deficiencies in the levels of PKD1 (Fig. 2C) and PKCδ and PKCϵ (Fig. 2D) were confirmed by the lack of a signal in Western blot analysis. In summary, these data identified PKD1 and PKCδ to be involved in the regulation of mitochondrial depolarization following H2O2 treatment. This initial characterization was also performed with primary MEFs of all genotypes, and no difference was observed from the results obtained with immortalized MEFs (data not shown). Thus, for practical reasons, we subsequently used immortalized MEFs exclusively.
FIGURE 2.
Mitochondrial depolarization in mouse embryonic fibroblasts of various genotypes. A, top line, histograms of depolarization assays using TMRM, as described under “Experimental Procedures.” The mitochondrial membrane depolarization is indicated by a left shift of the peak. The blue and red lines represent no treatment, whereas the green and brown lines indicate treatment with 25 μm H2O2. Bottom line, mitochondrial membrane depolarization using 50 and 10 μm H2O2, as indicated. All of the genotypes tested are indicated on the top left of each histogram. B, rescue experiments with cells overexpressing the indicated PKD isoforms in the PKD1−/− background. The histograms show depolarization assays using 25 μm H2O2. All of the results are typical of at least three independent experiments. C, Western blot analysis of whole cell extracts from wild-type +/+, PKD1−/−, and PKD1−/− + PKD1–3-overexpressing cells. A total of 50 μg of protein per lane was loaded. The applied antibodies are indicated below the graph. D, Western blot analysis of whole cell extracts from wild-type +/+, PKCδ−/−, and PKCϵ−/− MEFs. A total of 50 μg of protein per lane was loaded. The applied antibodies are indicated below the graph.
H2O2-mediated Translocation of PKD1 to the Mitochondrial Membrane Is Independent of PKCδ
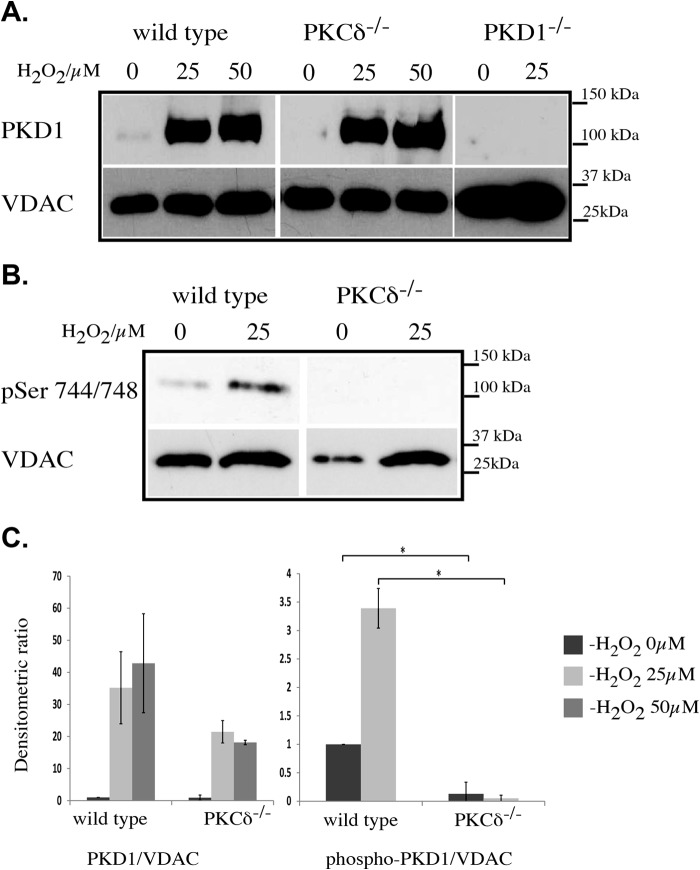
We next examined whether PKD1 translocates to the mitochondria fraction after H2O2 treatment and whether PKCδ is involved in this process. We treated MEFs of different genotypes with 25 or 50 μm H2O2. We then harvested the cells and prepared the mitochondrial protein extract for SDS-PAGE analysis. Fig. 3A indicates that in wild-type MEFs, PKD1 translocates to the mitochondria after treatment with 25 μm H2O2. Interestingly, no increase in signal strength was detected after treatment with 50 μm H2O2, suggesting that the vast majority of PKD1 translocates to the mitochondrial membrane at ROS levels that are insufficient to cause mitochondrial depolarization (see quantification in Fig. 3C). The depletion of PKCδ did not influence the translocation behavior of PKD1 in this context. We then investigated the activity status of PKD1 once the enzyme had localized to the mitochondrial membrane using a phospho-specific antibody directed against Ser-744/748 (Fig. 3B). We observed that Ser-744/748 phosphorylation occurs at 25 μm, indicating that PKD1 becomes activated once it is associated with the mitochondrial membrane; therefore, PKD1 activation appears to be a prerequisite for depolarization. In addition, we also observed that this phosphorylation event is mediated by PKCδ given that the depletion of PKCδ prevents Ser-744/748 phosphorylation. Taken together, these data show that PKD1 translocates to the mitochondria at low ROS concentrations in a PKCδ-independent fashion but that PKCδ is required to activate PKD1 after ROS-induced translocation.
FIGURE 3.
H2O2-mediated PKD1 translocation to the mitochondria. A, Western blot analysis of mitochondrial extracts from wild-type, PKCδ−/−, and PKD1−/− MEFs after 15 min of H2O2 treatment at the indicated concentrations (0, 25, and 50 μm). Top lane, anti-PKD1 antibody; bottom lane, anti-VDAC antibody as a loading control. B, Western blot analysis of mitochondrial extracts from wild-type and PKCδ−/− MEFs after 15 min of H2O2 treatment at the indicated concentrations. Top lane, anti-phospho Ser-744/Ser-748 (pSer 744/748) PKD1 antibody (corresponds to human Ser-738/742); bottom lane, anti-VDAC antibody as loading control. C, densitometric quantification of A (left) and B (right) using ImageJ. The results were normalized to endogenous VDAC protein levels. The error bars represent S.D., and * indicates p < 0.001 by t test. All of the results are typical of at least three independent experiments.
Enhanced Cytochrome c Release and Increased Cell Death in PKD1- and PKCδ-depleted MEFs
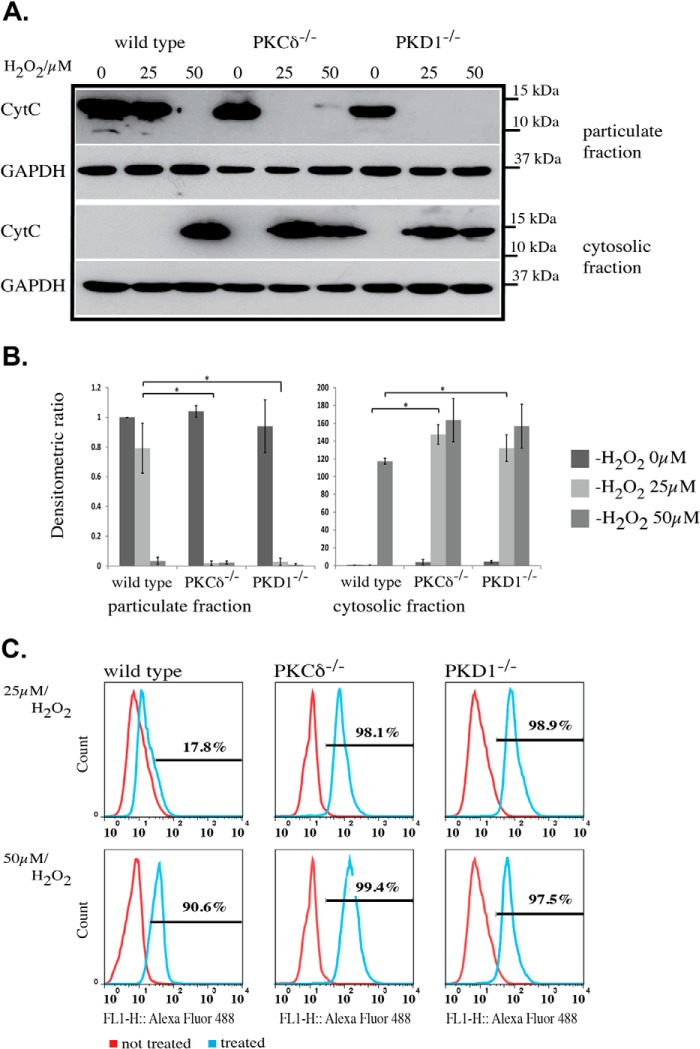
Because the increased sensitivity to ROS results in mitochondrial depolarization, we examined whether cytochrome c (Cyt c) is also released after treatment with 25 μm H2O2 in PKD1- and PKCδ-deficient MEFs. When wild-type MEFs were treated with 25 μm H2O2 for 15 min at 37 °C, no release of Cyt c into the cytosolic fraction was detectable, whereas 50 μm H2O2 caused a complete loss of Cyt c in the particulate fraction, which contains the mitochondria and was used in the following experiments instead of a specific mitochondria extract. Consistently, Cyt c accumulated in the cytosolic fraction of wild-type MEFs following treatment with 50 μm H2O2 (Fig. 4, A and B). By contrast, PKCδ−/− and PKD1−/− MEFs showed robust Cyt c release into the cytoplasm after treatment with 25 μm H2O2, which was accompanied by a loss of Cyt c in the particulate fraction (Fig. 4, A and B). The release of Cyt c from the inner mitochondrial membrane space into the cytosol is believed to be the first step in a cascade that results in apoptosis. Thus, we analyzed the content of apoptotic cells in wild-type, PKCδ−/−, and PKD1−/− MEFs after H2O2 treatment using a FACS-based TUNEL assay. Wild-type MEFs treated with 25 μm H2O2 showed a weak apoptotic response (17.8%; Fig. 4C, top panel), whereas 50 μm H2O2 caused a clear increase of apoptotic cells (90.6%; Fig. 4C, bottom panel), which is indicated by the right shift in the histogram. Again, it became apparent that MEFs from both mutant genotypes showed a robust apoptotic response after treatment with 25 μm H2O2 (PKCδ−/− 98.1% and PKD1−/− 98.9%; Fig. 4C, top panel). In summary, these data confirm that PKCδ−/− and PKD1−/− MEFs show an increased sensitivity to ROS, leading to apoptosis.
FIGURE 4.
Cytochrome c release and induced apoptosis in PKCδ−/− and PKD1−/− MEFs. A, Western blot analysis of Cyt c release after H2O2 treatment. The top represents the particulate fraction, and the bottom represents the corresponding cytosolic fraction. The genotypes of the MEFs and the H2O2 concentrations are indicated on the top of the graph. CytC, anti-cytochrome c antibody; GAPDH, anti-GAPDH antibody as loading control. B, densitometric quantification of A using ImageJ, with the particulate fraction on the left and the cytosolic fraction on the right. The results were normalized to the endogenous GAPDH protein levels. The error bars represent 1 ± S.D., and * indicates p values < 0.001 (particulate fraction) and < 0.003 (cytosolic fraction) by t test. C, histograms of TUNEL assays from different mouse embryonic fibroblast lines. The genotypes are indicated above, and the H2O2 concentrations (25 and 50 μm) are indicated on the left. Within the graph, the red line corresponds to untreated cells, whereas the blue line corresponds to treated cells. The percentage of apoptotic cells is indicated within the individual histograms. All of the results are typical of at least three independent experiments.
Bax and Bcl-xL Protein Levels Are Altered in Opposite Directions in PKCδ−/− and PKD1−/− MEFs
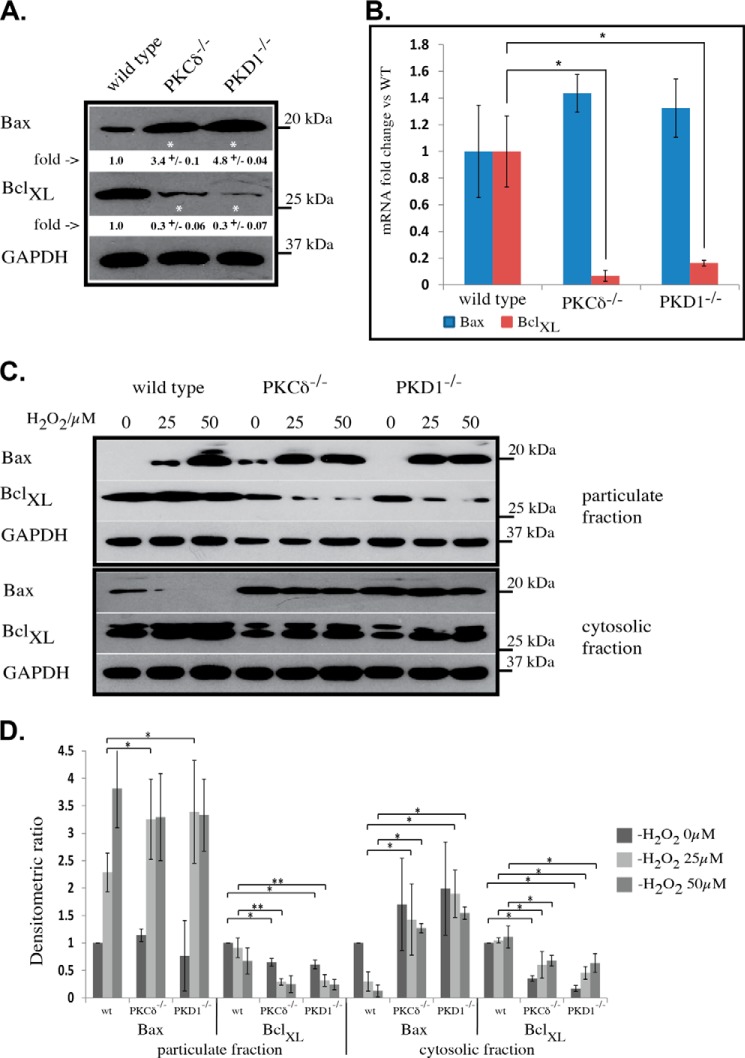
Bcl-2 protein family members have been established as mediators of apoptotic signaling, exhibiting either pro-apoptotic (e.g. Bax) or anti-apoptotic (e.g. Bcl-xL) functions. Given that we observed a change in the apoptotic response in PKCδ- and PKD1-depleted MEFs, we next determined whether this effect was caused by functional alterations in proteins of the Bcl-2 family. Indeed, analysis of whole cell extracts by Western blotting indicated that Bax protein levels were noticeably increased in both mutant cell lines, whereas Bcl-xL levels were decreased when compared with wild-type extracts (Fig. 5A). A subsequent quantitative PCR analysis revealed that Bcl-xL transcript levels were down-regulated in both mutant cell lines (PKCδ−/−, 14.3-fold change; PKD1−/−, 6.25-fold change), whereas Bax transcript levels appeared unchanged (Fig. 5B). We next analyzed the translocation behavior of Bax and Bcl-xL given that a shift in the balance of pro- and anti-apoptotic Bcl-2 protein members could also influence the individual distribution of these proteins. After treatment with 25 μm H2O2, wild-type MEFs showed a small proportion of Bax in the particulate fraction, whereas treatment with 50 μm H2O2 resulted in an increased amount of Bax in the particulate fraction (Fig. 5, C and D). This effect was accompanied by the depletion of Bax from the cytosolic fraction (Fig. 5, C and D). Regarding Bcl-xL, no major changes were detected in the wild-type cells other than a slight decrease in the particulate fraction and an increase in the cytosol after treatment with 50 μm H2O2. In sharp contrast, both mutant cell lines showed a clear shift of Bax to the particulate fraction after treatment with 25 μm H2O2, with no significant increase following treatment with 50 μm H2O2 (Fig. 5, C and D). It is worth noting that the amount of Bax in the particulate fraction after treatment with 25 μm H2O2 appears to be comparable with the amount observed after treatment with 50 μm H2O2 in wild-type MEFs. This observation correlates well with the differences seen in the depolarization behavior described above. Given the lower levels of Bcl-xL protein in both mutant cell lines, a rapid depletion from the particulate fraction was clear in cells treated with 25 μm H2O2, with no further decrease at 50 μm (Fig. 5, C and D). Again, this effect was accompanied by an increase in the levels of Bcl-xL protein in the cytosolic fraction.
FIGURE 5.
Bax and Bcl-xL analysis in PKCδ−/− and PKD1−/− MEFs. A, Western blot analysis of whole cell extracts from mouse embryonic fibroblasts. The individual genotypes and the antibodies used are indicated. Densitometric quantification was performed with ImageJ. The -fold changes are indicated below each Western blot, including the S.D. The results were normalized to the levels of endogenous GAPDH protein, and * indicates p < 0.001 by t test. B, quantitative PCR analysis of Bax (blue) and Bcl-xL (red) mRNA extracted from wild-type, PKCδ−/−, and PKD1−/− MEFs. The error bars represent the S.D., and * indicates p < 0.01 by t test. C, the translocation of Bax and Bcl-xL as determined by Western blot. MEFs of the indicated genotypes were treated with 0, 25, and 50 μm H2O2 and then fractionated into particulate (top) and cytosolic (bottom) fractions as described under “Experimental Procedures.” Bax, anti-Bax antibody; BclXL, anti-Bcl-xL antibody; GAPDH, anti-GAPDH antibody as the loading control. D, densitometric quantification of C using ImageJ with the particulate fraction on the left and the cytosolic fraction on the right. The results were normalized to the levels of endogenous GAPDH protein. The error bars represent 1 ± S.D., * indicates p values < 0.01, and ** indicates p values < 0.05 by t test. All of the results are typical of at least three independent experiments.
Increased Bax Activation in PKCδ−/− and PKD1−/− MEFs
We found high levels of Bax in PKCδ- and PKD1-depleted MEFs and found that Bax translocates to the mitochondrial membrane (i.e. the particulate fraction) at lower ROS concentrations. Therefore, we analyzed the activity status of Bax after H2O2 treatment. We performed an antibody-based immunofluorescence assay that detects only activated Bax through an N-terminal epitope. Specifically, this epitope becomes exposed only after activation and integration into the outer mitochondrial membrane (13). As shown in Fig. 6A (top panel), no activated Bax was detectable in wild-type MEFs following treatment with 25 μm H2O2, whereas a clear activation signal was visible following treatment with 50 μm H2O2. In agreement with our previous observations, both mutations resulted in activated Bax after treatment with 25 μm H2O2 (Fig. 6A, middle and bottom panel). In addition, the activation status of Bax increases following treatment with 50 μm H2O2, as demonstrated by the increased intensity of the immunofluorescence signal. A quantification of the immunofluorescence data revealed that the values detected in wild-type MEFs treated with 50 μm H2O2 were in the range of those observed for 25 μm H2O2-treated PKCδ- and PKD1-depleted MEFs. In PKCδ- and PKD1-depleted MEFs treated with 50 μm H2O2, both mutations showed a 3-fold higher Bax activity when compared with wild-type cells (Fig. 6B).
FIGURE 6.
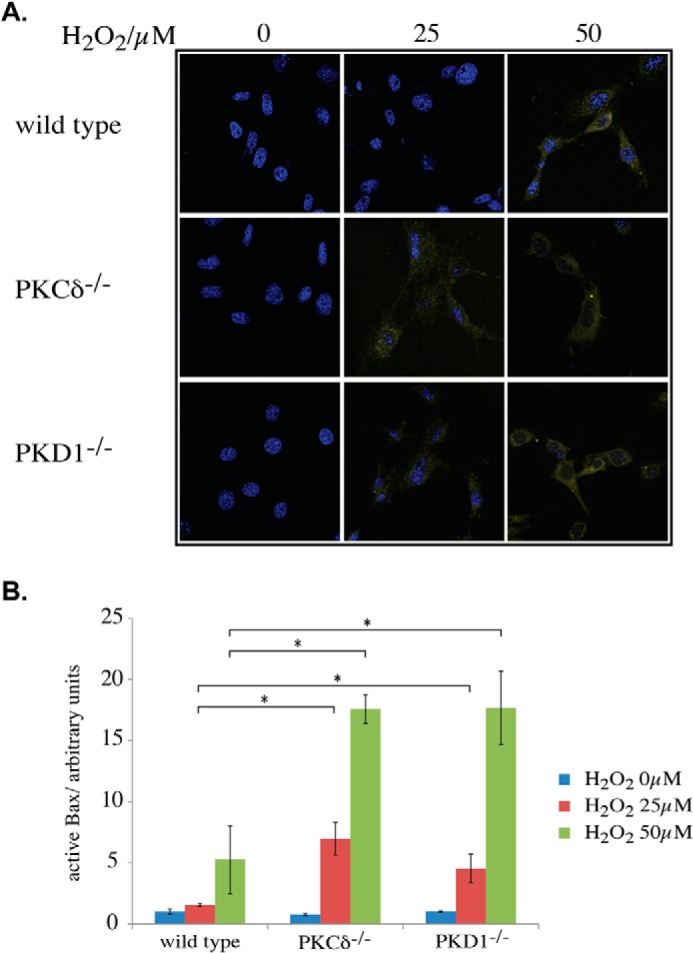
Activation of Bax. A, immunofluorescence analysis of active Bax after H2O2 treatment at the indicated concentrations. The cells were fixed and incubated with an activation-specific antibody, as described under “Experimental Procedures.” B, quantification of A, as described under “Experimental Procedures.” The error bars represent S.D., * indicates p values < 0.0005 by t test, blue corresponds to 0 μm H2O2 treatment, red corresponds to 25 μm H2O2 treatment, and green corresponds to 50 μm H2O2 treatment.
ROS-induced Apoptosis in PKCδ−/− and PKD1−/− MEFs Is Cyclosporin A-independent
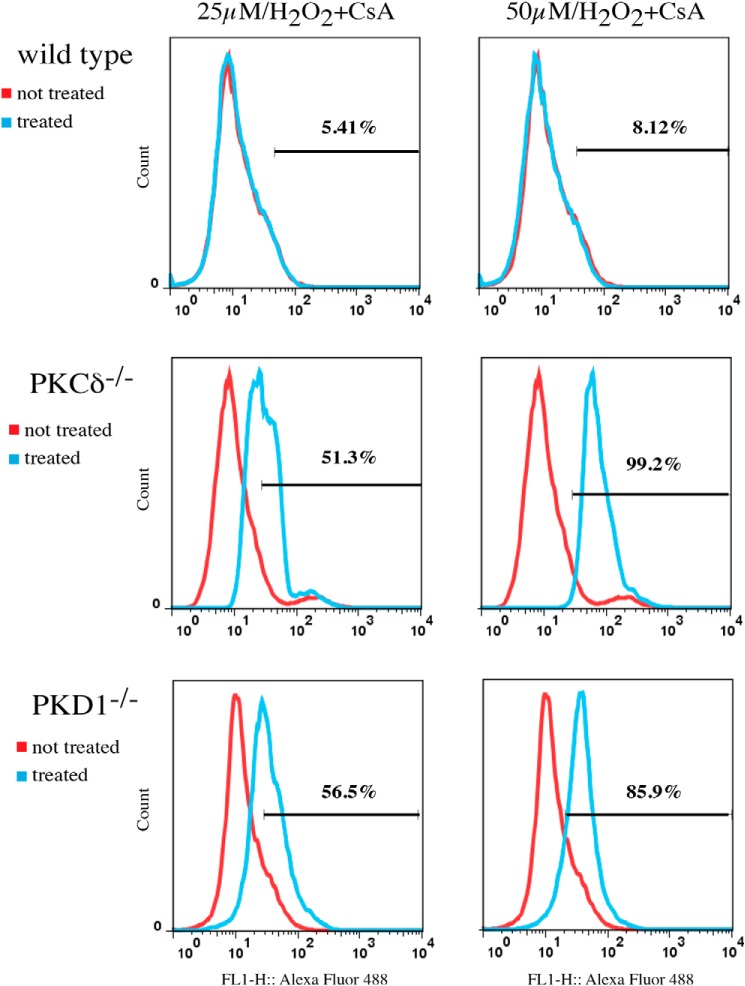
We observed that deficiencies in both genes resulted in a higher level of Bax, which is activated at lower ROS concentrations. We therefore examined whether the resulting mitochondrial depolarization and subsequent induction of apoptosis are mediated via (i) mitochondrial apoptosis-induced channel (MAC), a homo- and/or heteromeric ion channel consisting of Bax and Bak proteins or (ii) the mitochondrial permeability transition pore (MPTP), which is composed of VDAC and other proteins, including Bax. To distinguish between these two possibilities, we treated cells with H2O2, but this time we included cyclosporin A as an inhibitor of MPTP. As shown in Fig. 7, cyclosporin A completely abolished the apoptotic response in wild-type MEFs following treatment with 50 μm H2O2, as determined by the TUNEL assay. By contrast, PKCδ- and PKD1-deficient MEFs were not affected by cyclosporin A treatment. Thus, we concluded that the mitochondrial depolarization and subsequent apoptosis observed in wild-type MEFs treated with 50 μm H2O2 are mediated by MPTP. This result is in contrast to PKCδ- and PKD1-deficient MEFs, in which we detected MAC-dependent depolarization.
FIGURE 7.
Cyclosporin A-independent depolarization. The cells were treated with the indicated H2O2 concentrations, and the induced apoptosis was measured by TUNEL, as described under “Experimental Procedures.” The histograms shown represent typical results of at least three independent experiments. The red line corresponds to untreated cells, the blue line corresponds to treated cells, and the percentage of apoptotic cells is indicated in each individual histogram.
PKCδ−/− and PKD1−/− MEFs Are More Susceptible to Starvation-induced Apoptosis
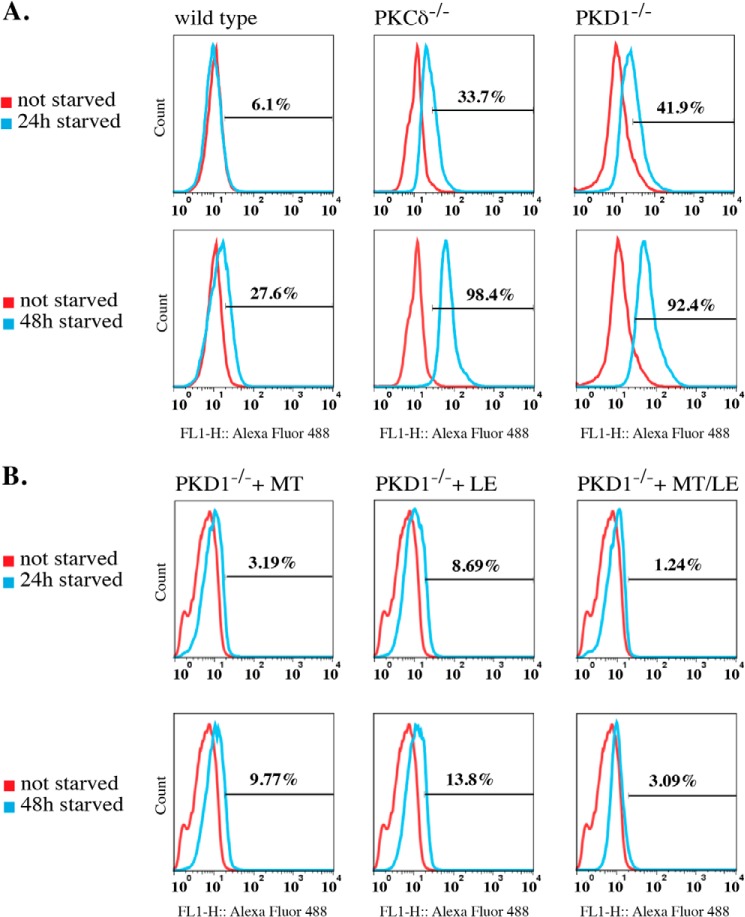
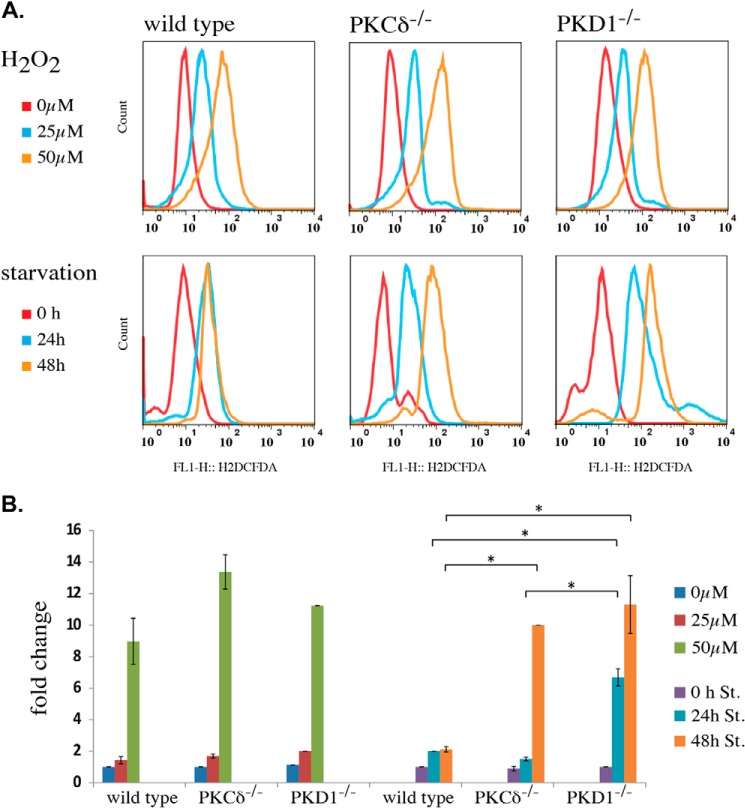
Both loss-of-function mutations caused an increased apoptotic response to low ROS concentrations. Thus, we next determined whether starvation by nutrient deprivation leads to earlier cell death in PKCδ−/− and PKD1−/− MEFs. We cultured wild-type, PKCδ−/−, and PKD1−/− MEFs in serum-free medium (DMEM; 0% FCS) for 24 and 48 h and measured the number of apoptotic cells using the TUNEL assay. Indeed, when analyzing wild-type MEFs after 24 h of starvation, only a small fraction of apoptotic cells (6.1%) was observed. Further starvation for 48 h led to a 27.6% increase in that fraction (Fig. 8A, left row). In sharp contrast, both mutations resulted in a robust induction of apoptosis after only 24 h of starvation (Fig. 8A; PKCδ−/−, 33.7%; PKD1−/−, 41.9%; middle and right row, respectively) and in an almost complete apoptotic response after 48 h of starvation (Fig. 8A; PKCδ−/−, 98.4%; PKD1−/−, 92.4%). To confirm that this apoptotic response was due to the accumulation of ROS during starvation, we performed another set of experiments using PKD1−/− MEFs, this time including antioxidants in the medium during starvation. We selected two antioxidant compounds, mito-TEMPO and l-ergothioneine, both of which have free radical-scavenging properties. For both compounds, we detected a robust decrease in the apoptotic response in PKD1−/− MEFs after 24 and 48 h. As indicated in Fig. 8B (top line), the fraction of apoptotic cells was small after 24 h of starvation (3.19% for mito-TEMPO; 8.69% for l-ergothioneine); this percentage increased slightly to 9.77% (mito-TEMPO) and 13.8% (l-ergothioneine) after 48 h of starvation. Remarkably, a combination of both antioxidants nearly abolished any apoptotic response, even after 48 h of starvation (3.09%). Thus, we concluded that the high proportion of apoptotic cells in PKD1−/− MEFs during starvation is mediated by endogenous ROS, which are generated during fasting. We then aimed to correlate the amount of ROS generated in MEFs during starvation with the H2O2 concentrations that we used for the depolarization assays. We therefore measured the ROS content using H2DCFDA, which is oxidized to DCFDA, a highly fluorescent dye upon incubation with ROS. As shown in Fig. 9A (top row), the amount of ROS after H2O2 incubation did not vary significantly among the different genotypes; this result was confirmed in the quantification shown in Fig. 9B. When starved, wild-type cells showed a slight (but not significant) increase in ROS levels after 24 h when compared with the 25 μm H2O2-treated cells, with no change observed after 48 h of starvation (Fig. 9, A and B). We took these results as a plausible explanation for the moderate induction of apoptosis after 48 h, which also indicates that the detoxification machinery is functional in immortalized wild-type MEFs. In sharp contrast, when compared with the wild-type cells, PKCδ deficiency resulted in a constant increase in ROS levels over the period of starvation, with a ROS concentration comparable with that observed in cells treated with 25 μm for 24 h; a 10-fold increase was observed after 48 h. PKD1-deficient MEFs showed an even more pronounced phenotype. Specifically, 24 h of starvation led to an intercellular ROS concentration that was 7-fold higher when compared with the no-starvation condition and a 10-fold increase after 48 h, resembling the PKCδ−/− ROS concentration at that time point. Taken together, these data show that treatment of wild-type MEFs with 25 μm H2O2 results in the ROS levels that occur after 24 h of starvation, whereas longer starvation periods do not result in higher ROS levels. By contrast, both mutations resulted in a clear increase in ROS concentrations over the period of starvation. Strikingly, after 24 h, PKD1-deficient MEFs reach ROS concentrations that are ∼3 times higher than are observed for wild-type and PKCδ−/− MEFs, implying that, in addition to the altered depolarization phenotype, the detoxification machinery is strongly affected in these cells. It should be noted that the ROS concentrations detected after only 24 h of starvation were sufficient to depolarize the mitochondria in cells with either mutation.
FIGURE 8.
Starvation-induced apoptosis. A, the cells were starved for 24 and 48 h, and the induced apoptosis was measured by TUNEL assay, as described under “Experimental Procedures.” The histograms represent typical results of at least three independent experiments. The red line corresponds to non-starved cells, the blue line correspond to starved cells, and the percentage of apoptotic cells is indicated in each individual histogram. B, PKD1−/− MEFs were starved for 24 and 48 h with antioxidants included in the starvation medium. MT: Mito-TEMPO, final concentration 5 μm; LE: l-ergothioneine, final concentration 20 μm; MT/LE: a combination of Mito-TEMPO and l-ergothioneine. The histograms shown represent typical results of two independent experiments. The red line corresponds to non-starved cells, the blue line corresponds to starved cells, and the percentage of apoptotic cells is indicated in each individual histogram.
FIGURE 9.
Comparison of intercellular ROS content after H2O2 treatment and starvation. A, the cells were either treated with H2O2 or starved, as indicated. The intercellular ROS content was measured by H2DCFDA, as described under “Experimental Procedures.” For the H2O2 treatment, the red line indicates the untreated condition, the blue line represents the 25 μm condition, and the brown line represents the 50 μm H2O2 condition. For the starvation experiment, the red line indicates the non-starved condition, the blue line represents 24 h, and the brown line represents 48 h of starvation. All of the histograms shown represent a typical result of at least three independent experiments. B, quantification of A, as described under “Experimental Procedures.” The error bars represent the S.D., * indicates p values < 0.005 by t test.
DISCUSSION
We showed here for the first time that PKD1 deficiency in MEFs causes increased sensitivity to ROS, leading to mitochondrial depolarization and ultimately apoptosis. Previous work has indicated a functional involvement of PKD1 in the NFκB-mediated transcriptional regulation of genes important for defense (e.g. cellular detoxification) against oxidative stress (14). Here, we show that the initial events in ROS-mediated apoptotic signaling are also regulated specifically by PKD1. In addition, given that all alterations described in this study are phenotypically copied by both PKCδ and PKD1 deficiencies, we provide additional support for the hypothesized signaling axis involving these proteins. Thus, we have identified a previously unrecognized PKCδ phenotype linked to PKD1 signaling. Within the H2O2-mediated signaling cascade, PKD1 is translocated to the outer mitochondrial membrane. This translocation occurs in wild-type MEFs at H2O2 concentrations that do not cause membrane depolarization. An interaction between PKCδ and PKD1 through the phosphorylation of PKD1 tyrosine 95 after H2O2 treatment has been precisely characterized (15); however, to what degree this interaction regulates the translocation process was not clear. Our data show that PKD1 translocation is independent of PKCδ. Nevertheless, the subsequent activation of PKD1, as detected by Ser-738/742 phosphorylation, in the activation loop requires PKCδ activity. When PKCδ is depleted from the system (PKCδ−/−), no Ser-738/742 phosphorylation occurs, thereby defining PKD1 as a PKCδ-specific substrate. Although PKD1 may be activated by other mechanisms (3), PKCδ-mediated phosphorylation of PKD1 Ser-738/742 appears to be required to fulfill the latter's function in vivo in the context of ROS-mediated mitochondrial depolarization. When PKD1−/− MEFs were treated with 25 μm H2O2, the mitochondrial membrane depolarized, followed by Cyt c release and apoptosis (Figs. 2 and 4). Wild-type MEFs respond in the same manner following treatment with 50 μm H2O2, whereas no such response was detectable following treatment with 25 μm H2O2. Thus, we concluded that PKD1 is involved in modulating the threshold that regulates mitochondrial outer membrane permeabilization after ROS incubation. Bax and Bcl-xL are two Bcl-2 protein family members that have been shown to be involved in this process (16). The pro-apoptotic Bax is described as a pore-forming protein and is believed to translocate to the outer mitochondrial membrane in response to ROS. At the membrane, it can form either homomeric or heteromeric pores called MACs (in conjunction with Bak), or it can interact with the MPTP. In both cases, Bax is involved in the regulation of mitochondrial outer membrane permeabilization. In PKCδ−/− and PKD1−/− MEFs, Bax appeared to be stabilized at the protein level because we detected increased levels on Western blot analysis but no transcriptional alteration (Fig. 5). Currently, the only reported mechanism for the regulation of Bax protein levels is ubiquitination, which occurs after Bax is released from the mitochondrial membrane and leads to its degradation (17). Therefore, one reason for the increased Bax protein levels might be a lack of ubiquitination or increased deubiquitination. Both mechanisms can potentially be regulated by PKD1, either by interacting with the E1/E2/E3 enzyme network or by regulating the activities of deubiquitinating enzymes. In either case, the details related to this potential regulation are not clear and require further studies for clarification. In addition, we showed that in both PKCδ−/− and PKD1−/− cells, the amount of Bax that translocated to the mitochondria after treatment with 25 μm H2O2 is comparable with the levels observed after treatment of wild-type cells with 50 μm H2O2. These results correlate well with the observed alteration in mitochondrial depolarization. Furthermore, our analysis revealed that the amount of activated Bax at the mitochondrial outer membrane after treatment with 25 μm H2O2 was similar to that observed for wild-type cells following treatment with 50 μm H2O2. In addition, treatment with 50 μm H2O2 leads to a 3-fold increase in the level of activated Bax in mutant MEFs. The exact mechanism of Bax translocation from the cytoplasm to the mitochondria is unclear. One study (18) indicated that phosphorylation at Ser-184 by Akt maintains the protein in an inactive state bound to Bcl-xL in the cytoplasm. In this case, a prerequisite for the mitochondrial translocation of Bax is PP2A-mediated dephosphorylation of Ser-184 (19). Other phosphorylation events have also been identified to play a role in Bax translocation (20); a direct PKD1-mediated phosphorylation has not been observed but is possible based on our observation. Once Bax is located at the outer mitochondrial membrane, it undergoes conformational changes and results in the formation of oligomeric pores (MACs), leading to the release of Cyt c and apoptosis. Given that PKD1 deficiency caused an increase in the levels of active Bax after H2O2 treatment, it is possible that not only the translocation of Bax to the mitochondria but also its activation is modulated by PKD1, with the latter occurring by an independent yet unknown second mechanism. Bcl-xL has been described as a Bax-counteracting anti-apoptotic protein. Although it is known to be a rather multifunctional protein (21), one prominent in vivo function of Bcl-xL is a direct inhibitory interaction with Bax that prevents pore formation. A balance between pro- and anti-apoptotic Bcl-2 family members within cells is widely accepted to be a major regulator of cell survival or death. PKCδ−/− and PKD1−/− MEFs show clearly decreased Bcl-xL protein levels. This result was subsequently explained by transcriptional down-regulation. Previous studies have revealed that the Bcl-xL gene contains NFκB binding motifs within its promoter region (22), making it likely that Bcl-xL transcription is at least partially regulated by the predicted oxidative stress-induced PKCδ-PKD1-NFκB-mediated signaling axis (23). Our findings clearly support this interpretation. Thus, decreased Bcl-xL protein levels could well contribute to the observed accumulation of Bax protein at the mitochondrial membrane upon 25 μm H2O2 treatment. As a consequence, both mutations result in an obvious imbalance of Bax and Bcl-xL, an effect that most likely makes these cells more susceptible to cell death. This susceptibility was supported by apoptosis analysis during starvation conditions. Whereas the wild-type MEFs showed only moderate apoptosis after 48 h of starvation, PKCδ−/− and PKD1−/− MEFs had nearly all died, and antioxidants were able to rescue this phenotype. Our results therefore imply that the PKCδ/PKD1 signaling axis might represent a target for apoptosis induction under starvation conditions, as can occur during tumor growth. It was somewhat surprising that mice depleted of PKD1 by gene targeting appeared to be rather unaffected by this null mutation, particularly when MEFs derived from these mice exhibit such a pronounced phenotype. Some mutant mice carrying mutations linked to apoptosis develop an embryonic lethal phenotype, such as RelA-deficient mice (24); other mutants do not show obviously abnormal phenotypes in this context. The common argument is that there is redundancy within the system that allows for robust phenotypes to occur when key players are knocked out. Having shown that rescue experiments using the other two PKD isoforms are not able to compensate for the loss of PKD1, we do not believe that redundancy explains the lack of a severe phenotype in PKD1−/− animals. One possibility is that the observed higher sensitivity in MEFs against ROS would not necessarily be recapitulated in laboratory mice under standardized normal conditions. However, the situation may change when the animals are subjected to stressful conditions, e.g. when animals are crossed to specific tumor models. Another possibility is that the described ROS-mediated phenomena in PKD1−/− (and PKCδ−/−) MEFs are not ubiquitous in the organism but limited to specific cell types and/or tissues. Thus far, only the cardiac system has been intensively examined under pathological conditions using another PKD1-deficient mouse line. In these studies, PKD1 was identified as a key regulator of stress-induced abnormal remodeling of the heart via its phosphorylation of class II histone deacetylases and the subsequent regulation of MEF2 target genes (25, 26). Nevertheless, no mitochondrial dysfunction has been reported in that context. Addressing these questions will be a future goal for the field.
Taken together, this study identifies PKD1 as a regulator of mitochondrial outer membrane permeabilization. This result extends the previously described in vivo function of PKD1 in the context of ROS-mediated signaling. In addition, our data support the link between PKCδ and PKD1 signaling using genetically modified cells. We identified a higher sensitivity against ROS in both PKCδ and PKD1 deficiencies, with this effect subsequently leading to increased cell death.
Acknowledgments
We thank laboratory members for continuous discussion of the project and the Norwegian Transgene Unit (particular Mikael Vestberg) for blastocyst injections.
This work was supported by the Norwegian Research Council (Grant 197261).
- ROS
- reactive oxygen species
- VDAC
- voltage-dependent anion channel
- MEF
- mouse embryonic fibroblast
- TMRM
- tetramethylrhodamine methyl ester in MeOH
- H2DCFDA
- 2′,7′-dichlorodihydrofluorescein diacetate
- DCFDA
- 2′,7′-dichlorofluorescein diacetate
- BrdUTP
- 5-bromo-2′-deoxyuridine 5′-triphosphate
- Cyt c
- cytochrome c
- MAC
- mitochondrial apoptosis-induced channel
- MPTP
- mitochondrial permeability transition pore.
REFERENCES
- 1. Johannes F. J., Prestle J., Eis S., Oberhagemann P., Pfizenmaier K. (1994) PKCu is a novel, atypical member of the protein kinase C family. J. Biol. Chem. 269, 6140–6148 [PubMed] [Google Scholar]
- 2. Fu Y., Rubin C. S. (2011) Protein kinase D: coupling extracellular stimuli to the regulation of cell physiology. EMBO Rep. 12, 785–796 [DOI] [PMC free article] [PubMed] [Google Scholar]
- 3. Steinberg S. F. (2012) Regulation of protein kinase D1 activity. Mol. Pharmacol. 81, 284–291 [DOI] [PMC free article] [PubMed] [Google Scholar]
- 4. Zugaza J. L., Sinnett-Smith J., Van Lint J., Rozengurt E. (1996) Protein kinase D (PKD) activation in intact cells through a protein kinase C-dependent signal transduction pathway. EMBO J. 15, 6220–6230 [PMC free article] [PubMed] [Google Scholar]
- 5. Matassa A. A., Carpenter L., Biden T. J., Humphries M. J., Reyland M. E. (2001) PKCδ is required for mitochondrial-dependent apoptosis in salivary epithelial cells. J. Biol. Chem. 276, 29719–29728 [DOI] [PubMed] [Google Scholar]
- 6. DeVries T. A., Neville M. C, Reyland M. E. (2002) Nuclear import of PKCδ is required for apoptosis: identification of a novel nuclear import sequence. EMBO J. 21, 6050–6060 [DOI] [PMC free article] [PubMed] [Google Scholar]
- 7. Storz P., Döppler H., Toker A. (2004) Protein kinase Cδ selectively regulates protein kinase D-dependent activation of NF-κB in oxidative stress signaling. Mol. Cell. Biol. 24, 2614–2626 [DOI] [PMC free article] [PubMed] [Google Scholar]
- 8. Wang C., Youle R. J. (2009) The role of mitochondria in apoptosis. Annu Rev. Genet. 43, 95–118 [DOI] [PMC free article] [PubMed] [Google Scholar]
- 9. Dejean L. M., Martinez-Caballero S., Manon S., Kinnally K. W. (2006) Regulation of the mitochondrial apoptosis-induced channel, MAC, by BCL-2 family proteins. Biochim. Biophys. Acta 1762, 191–201 [DOI] [PubMed] [Google Scholar]
- 10. Zorov D. B., Juhaszova M., Yaniv Y., Nuss H. B., Wang S., Sollott S. J. (2009) Regulation and pharmacology of the mitochondrial permeability transition pore. Cardiovasc. Res. 83, 213–225 [DOI] [PMC free article] [PubMed] [Google Scholar]
- 11. Shi Y., Chen J., Weng C., Chen R., Zheng Y., Chen Q., Tang H. (2003) Identification of the protein-protein contact site and interaction mode of human VDAC1 with Bcl-2 family proteins. Biochem. Biophys. Res. Commun. 305, 989–996 [DOI] [PubMed] [Google Scholar]
- 12. Joyner A. (1999) Gene Targeting: A Practical Approach, 2nd Ed, pp. 36–39, Oxford University Press, Oxford, UK [Google Scholar]
- 13. Yethon J. A., Epand R. F., Leber B., Epand R. M., Andrews D. W. (2003) Interaction with a membrane surface triggers a reversible conformational change in Bax normally associated with induction of apoptosis. J. Biol. Chem. 278, 48935–48941 [DOI] [PubMed] [Google Scholar]
- 14. Storz P., Döppler H., Toker A. (2005) Protein kinase D mediates mitochondrion-to-nucleus signaling and detoxification from mitochondrial reactive oxygen species. Mol. Cell. Biol. 25, 8520–8530 [DOI] [PMC free article] [PubMed] [Google Scholar]
- 15. Döppler H., Storz P. (2007) A novel tyrosine phosphorylation site in protein kinase D contributes to oxidative stress-mediated activation. J. Biol. Chem. 282, 31873–31881 [DOI] [PubMed] [Google Scholar]
- 16. Renault T. T., Teijido O., Antonsson B., Dejean L. M., Manon S. (2013) Regulation of Bax mitochondrial localization by Bcl-2 and Bcl-xL: keep your friends close but your enemies closer. Int J. Biochem. Cell Biol. 45, 64–67 [DOI] [PubMed] [Google Scholar]
- 17. Li B., Dou Q. P. (2000) Bax degradation by the ubiquitin/proteasome-dependent pathway: involvement in tumor survival and progression. Proc. Natl. Acad. Sci. U.S.A. 97, 3850–3855 [DOI] [PMC free article] [PubMed] [Google Scholar]
- 18. Gardai S. J., Hildeman D. A., Frankel S. K., Whitlock B. B., Frasch S. C., Borregaard N., Marrack P., Bratton D. L., Henson P. M. (2004) Phosphorylation of Bax Ser184 by Akt regulates its activity and apoptosis in neutrophils. J. Biol. Chem. 279, 21085–21095 [DOI] [PubMed] [Google Scholar]
- 19. Xin M., Deng X. (2006) Protein phosphatase 2A enhances the proapoptotic function of Bax through dephosphorylation. J. Biol. Chem. 281, 18859–18867 [DOI] [PubMed] [Google Scholar]
- 20. Wang Q., Sun S. Y., Khuri F., Curran W. J., Deng X. (2010) Mono- or double-site phosphorylation distinctly regulates the proapoptotic function of Bax. PLOS One 5, e13393. [DOI] [PMC free article] [PubMed] [Google Scholar]
- 21. Michels J., Kepp O., Senovilla L., Lissa D., Castedo M., Kroemer G., Galluzzi L. (2013) Functions of BCL-XL at the interface between cell death and metabolism. Int. J. Cell Biol. 2013, 705294. [DOI] [PMC free article] [PubMed] [Google Scholar]
- 22. Sevilla L., Zaldumbide A., Pognonec P., Boulukos K. E. (2001) Transcriptional regulation of the bcl-x gene encoding the anti-apoptotic Bcl-xL protein by Ets, Rel/NFκB, STAT and AP1 transcription factor families. Histol Histopathol. 16, 595–601 [DOI] [PubMed] [Google Scholar]
- 23. Storz P., Toker A. (2003) Protein kinase D mediates a stress-induced NF-κB activation and survival pathway. EMBO J. 22, 109–120 [DOI] [PMC free article] [PubMed] [Google Scholar]
- 24. Beg A. A., Sha W. C., Bronson R. T., Ghosh S., Baltimore D. (1995) Embryonic lethality and liver degeneration in mice lacking the RelA component of NF-κB. Nature 376, 167–170 [DOI] [PubMed] [Google Scholar]
- 25. Harrison B. C., Kim M. S., van Rooij E., Plato C. F., Papst P. J., Vega R. B., McAnally J. A., Richardson J. A., Bassel-Duby R., Olson E. N., McKinsey T. A. (2006) Regulation of cardiac stress signaling by protein kinase d1. Mol. Cell. Biol. 26, 3875–3888 [DOI] [PMC free article] [PubMed] [Google Scholar]
- 26. Fielitz J., Kim M. S., Shelton J. M., Qi X., Hill J. A., Richardson J. A., Bassel-Duby R., Olson E. N. (2008) Requirement of protein kinase D1 for pathological cardiac remodeling. Proc. Natl. Acad. Sci. U.S.A. 105, 3059–3063 [DOI] [PMC free article] [PubMed] [Google Scholar]


