

Abstract
Background.
Mobility is an essential aspect of everyday life and enables autonomy and participation. Although many risk factors for mobility loss have been previously described, their relative importance and independent contributions to the long-term risk of losing mobility have not been well defined.
Methods.
This study is based on 1,013 men and women aged ≥65 years enrolled in 1998–2000 and followed for 9 years through 2007–2008 in the population-based InCHIANTI (Invecchiare in Chianti, aging in the Chianti area) study. We considered 44 different measures assessed at baseline to explore six subsystems: (i) central nervous system, (ii) peripheral nervous system, (iii) muscles, (iv) bone and joints, (v) energy production and delivery, and (vi) perceptual system. The outcome was incident mobility loss defined as self-report of inability to walk 400 m or climb and descend 10 steps without help from another person. Random survival forest analysis was used to rank the candidate predictors by their importance.
Results.
The most important physiological markers predicting mobility loss that emerged from the random survival forest modeling were older age among women (81–95 vs 65–68 years, hazard ratio [HR] 9.60 [95% CI 3.35, 27.50]), weaker ankle dorsiflexion strength (lowest vs highest quintile, HR 5.25 [95% CI 2.35, 11.72]), low hip flexion range of motion (lowest vs highest quintile, HR 2.30 [95% CI 1.20, 4.41]), presence of primitive reflexes (yes vs no, HR 1.47 [95% CI 1.03, 2.09]), and tremor (yes vs no, HR 1.91 [95% CI 1.18, 3.07]).
Conclusion.
Prevention of mobility loss with aging should focus on prevention and treatment of neuromuscular impairments.
Key Words: Physical functioning, Mobility loss, Physiological markers, Muscle strength, Central nervous system, Random survival forest
Mobility is an essential aspect of everyday life and enables autonomy and participation in meaningful social, cultural, and physical activities. Limitations in mobility, measured by both self-assessment and performance-based tests, predict progression of mobility loss, disability in activities of daily living, falls, institutionalization, and even death independent of demographics and comorbidities (1–4). Prevention of mobility loss is of fundamental importance for both individuals and populations.
Many clinical and epidemiological studies conducted over the last three decades have searched for risk factors for mobility decline (5).Overall, the findings of these studies revealed that age-associated decline in mobility results from a complex, multifactorial causal pathway where demographic factors, health status, physiological and psychological functions, health behaviors, and living environment all play a role (6–9). Notwithstanding this complexity, much of the recent literature has focused on single physiological subsystems, for example, muscle strength (10,11) and vision (9,12). Thus, the relative importance and independent contributions of different physiological subsystems potentially affecting mobility loss has not been well defined.
To tackle these topics, the Italian InCHIANTI (Invecchiare in Chianti, aging in the Chianti area) was established in 1997–1998 with the explicit goal of examining multiple physiological factors that influence walking ability (13). The two main goals for the InCHIANTI study were: (i) to understand multiple risk factors that influence loss of the ability to walk in older persons and (ii) to identify physiologic subsystems that are critical for walking. To accomplish this, a wide variety of physiological measurements were administered and they were classified based on a prespecified hypothesis into six main physiological subsystems: (i) central nervous system, (ii) peripheral nervous system, (iii) muscles, (iv) bone and joints, (v) energy production and delivery, and (vi) perceptual system. Subjects of the InCHIANTI study have been followed for 9 years, allowing a comprehensive analysis of the predictors of mobility loss.
Thus, the objective of this study is to explore and empirically identify the main physiological subsystems and individual physiological factors predicting onset of mobility loss in a population-based sample of older adults.
Methods
Study Design and Participants
InCHIANTI is an epidemiological study of factors contributing to loss of mobility in late life carried out in two Italian towns located in the Chianti geographic area. The baseline data were collected in 1998–2000, the 3-year follow-up took place in 2001–2003, the 6-year follow-up in 2004–2006, and the 9-year follow-up in 2007–2008. The design of the study and data collection methods have been described in detail (13). The study population consisted of a random sample of 1,260 community-dwelling persons aged ≥65 years selected from the population registries of two municipalities. A total of 1,155 older adults agreed to participate in the study (participation rate 91.7%). Of these, 1,013 were free of mobility disability at baseline, defined as self-report of ability to walk 400 m or climb and descend 10 steps without help from another person.
Participants received an extensive description of the study and participated after providing written informed consent. The Italian National Institute of Research and Care on Aging Ethical Committee approved the study protocol, which complied with the principles stated in the Declaration of Helsinki.
Baseline Measurement of Physiological Subsystems
In the InCHIANTI design, physiological measures that can potentially affect the risk of mobility loss were grouped into six physiological subsystems that, based on a prespecific hypothesis, are central for mobility. These subsystems include (i) central nervous system, (ii) peripheral nervous system, (iii) muscles, (iv) bone and joints, (v) energy production and delivery, and (vi) perceptual system. A detailed description of the measurements, measurement characteristic, and examination protocols are provided in the Online Supplement 1. All measurements were conducted at baseline and used as continuous variables, unless otherwise stated.
Incident Mobility Loss
Participants in these analyses were free of mobility disability at baseline. Incident mobility loss was defined as self-report of inability to walk 400 m or climb and descend 10 steps without help from another person. Follow-up visits were conducted every 3 years and mobility loss was followed up until 9 years postenrollment. The outcome variable for this study was incident mobility disability operationalized as “time to first bout of mobility disability.” Follow-up time was censored at the time of outcome development or the last available visit.
Statistical Analysis
Baseline descriptive data for candidate predictors are shown as means and standard deviations for continuous variables and frequencies for categorical variables. Next, we conducted confirmatory factor analysis via structural equation modeling to validate the six proposed subsystems (central nervous system, peripheral nervous system, muscle, bones/joints, energy, and perceptual). Additional details are shown in the Supplement 2.
To examine importance of candidate predictors as well as to take into account the complexity of their associations, we used the random survival forests (RSFs) method (14,15). RSF is a nonparametric approach to select predictors, assess predictor interactions, and perform an internal cross-validation of the final set of predictors. Briefly, an RSF is an ensemble of survival trees that quantifies predictive performance of each variable by accounting for potential multiway interactions and accommodates the competing risk of death (14). The randomSurvivalForest package in R version 2.15 was used for RSF analysis (15). We computed the RSF model ensemble c-index, a measure of cross-validated model discrimination. In this study, the RSF was an ensemble of 500 survival trees, where each tree was grown via recursive partitioning to identify the predictor and binary split that optimally predicts mobility loss. We then computed the importance for each variable and ranked each variable by absolute importance. Variable importance is the percent difference in the c-index due to including the variable in the model and hence is a measure of the predictive ability of a variable after accounting for all other variables in the model. Similarly, we computed the absolute importance for each subsystem. Next, we reran a series of nested RSF models to compute the c-index for each nested model and select the predictors for the final model. Additional details about the RSF analysis are provided in the Supplement 2.
Using the final model RSF results, we calculated the ensemble estimated cumulative incidence of mobility disability and displayed the cumulative incidence by categories of the final model predictors. For continuous predictors, we derived categories based by quintiles or published categories and calculated the average within-category estimated cumulative incidence.
To derive interpretable risk scores of mobility disability that account for the competing risk of death, we fit a competing risks proportional hazards model (16) using the categorized predictors of the final RSF model. Detailed description of the calibration assessment is included in the Supplement 2. The supplement also describes how to use the proportional hazards model results to compute risk scores and convert them to risks of mobility disability over time.
Results
Descriptive statistics for physiological indicators are presented in Online Supplement 3. During the 9 years of follow-up 23% of the participants developed mobility loss. In addition, 348 participants died and 36 were lost during the 9-year follow-up. Those who were lost to follow-up were older, had more chronic conditions, and were physically more sedentary at baseline than those who remained in the study (p < .05 for all). In addition, those who were lost to follow-up had lower walking speed at baseline compared with those who remained in the study (p < .001 for all). Additionally, we found that the proposed subsystems fit the observed data well (see Supplement 2).
RSF analysis was used to rank the candidate predictors by their importance (Table 1). In this and all subsequent event time analyses, time to mobility disability was operationalized as days from the baseline visit. The most important predictor was age followed by indicators from bones and joints (hip flexion range of motion and total bone density), energy production and delivery (ankle brachial index and dyspnea), central nervous system (primitive reflexes and tremor), and muscles (ankle dorsiflexion strength). The ensemble c-index for predicting mobility loss from all of the candidate predictors was 82.89% (SE 0.79%, 95% CI 81.34%–84.44%). We also examined the importance of different subsystems by including the top eight predictors from the random survival analysis and found that muscle, central nervous system, and bones and joints were the most important domains (Table 2).
Table 1.
Candidate Predictors Ranked by Their Importance for Mobility Loss Prediction—Random Forest Analysis
| Variable | Domain | Absolute Importance*, % (95% CI) | Nested c-Index† |
|---|---|---|---|
| Age | 3.09 | 77.05 | |
| Hip flexion range of motion | Bones/joints | 0.53 | 79.67 |
| Ankle brachial index | Energy | 0.26 | 79.31 |
| Dyspnea | Energy | 0.23 | 80.48 |
| Total bone density | Bones/joints | 0.20 | 80.59 |
| Primitive reflexes | CNS | 0.18 | 81.77 |
| Tremor | CNS | 0.17 | 82.46 |
| Ankle dorsiflexion strength | Muscles | 0.16 | 83.29 |
| Body mass index | Energy | 0.13 | 82.76 |
| Contrast sensitivity | Perceptual | 0.10 | 83.04 |
| Sex | 0.10 | 82.96 | |
| Motor coordination | CNS | 0.09 | 83.17 |
| Systolic blood pressure | Energy | 0.09 | 83.61 |
| Nerve conductive velocity | PNS | 0.09 | 83.35 |
| Mini-Mental State Examination | CNS | 0.08 | 83.46 |
| Knee pain, Womac | Bones/joints | 0.06 | 83.24 |
| Knee flexion range of motion | Bones/joints | 0.06 | 83.60 |
| Congestive heart failure | Energy | 0.06 | 83.04 |
| Diminished deep tendon reflexes | CNS | 0.05 | 83.26 |
| Compound muscle action potential | PNS | 0.05 | 82.91 |
| Far visual acuity | Perceptual | 0.05 | 83.33 |
| Ankle dorsiflexion range of motion | Bones/joints | 0.04 | 83.34 |
| Hearing | Perceptual | 0.03 | 83.38 |
| Hip extension range of motion | Bones/joints | 0.03 | 82.95 |
| Back pain, Womac | Bones/joints | 0.03 | 82.85 |
| Lower extremity muscle power | Muscles | 0.03 | 83.12 |
| Paresis of cranial nerves | CNS | 0.02 | 83.22 |
| Depression, CES-D | CNS | 0.02 | 82.83 |
| Resting heart rate | Energy | 0.01 | 83.33 |
| Hip osteoarthritis | Bones/joints | 0.01 | 83.21 |
| Ankle plant flexion range of motion | Bones/joints | 0.01 | 83.35 |
| Hip pain, Womac | Bones/joints | 0.01 | 83.37 |
| Knee osteoarthritis | Bones/joints | 0.01 | 83.21 |
| Muscle rigidity | CNS | 0.00 | 83.14 |
| Diastolic blood pressure | Energy | 0.00 | 83.14 |
| Pathological reflexes | CNS | 0.00 | 83.26 |
| Knee flexion strength | Muscles | 0.00 | 83.44 |
| Ankle plant flexion strength | Muscles | 0.00 | 83.13 |
| Leg muscle mass | Muscles | −0.01 | 83.12 |
| Hip extension strength | Muscles | −0.02 | 83.22 |
| Knee extension strength | Muscles | −0.02 | 82.80 |
| Waist circumference | Energy | −0.03 | 83.34 |
| Hyperactive deep tendon reflexes | CNS | −0.04 | 82.78 |
| Trail making test | CNS | −0.04 | 83.29 |
| Coronary heart disease | Energy | −0.06 | 83.14 |
| Somato sensory index | Perceptual | −0.07 | 83.28 |
| Hip abduction strength | Muscles | −0.08 | 82.65 |
| Hand grip strength | Muscles | −0.09 | 82.94 |
| Hip flexion strength | Muscles | −0.19 | 82.64 |
Notes: CES-D = Center for Epidemiological Studies-Depression scale; CNS = central nervous system; PNS = peripheral nervous system.
*Absolute importance is the absolute decrease in the c-index when the predictor is removed, after adjusting for all other predictors.
†c-index for a random forest including variables in the current and preceding rows only. The first dotted line indicates the most parsimonious model within 1 SE of the model with the maximum c-index. The second dotted line indicates the model with maximum c-index. Ensemble c-index from random forest analysis: 82.89% (SE 0.79%, 95% CI 81.34%–84.44%).
Table 2.
Importance of Subsystems in a Model Using Top Eight Predictors
| Subsystems | % Importance (95% CI) |
|---|---|
| CNS (primitive reflexes, tremor) | 1.12 (0.13, 1.67) |
| PNS (--) | N/A |
| Muscle (ankle dorsiflexion strength) | 1.31 (0.77, 2.56) |
| Bones/joints (range of motion hip flex, total bone density) | 0.72 (−0.65, 1.17) |
| Energy (ankle brachial index, dyspnea) | 0.85 (0.21, 1.64) |
| Perceptual (--) | N/A |
Notes: CNS = central nervous system; PNS = peripheral nervous system. Top eight predictors are composed of age and seven domain-specific predictors in parentheses.
The proportional hazards model was fit with the eight selected predictors as well as sex (Table 3). The proportional hazards model had a c-index of 83.2% (95% CI 78.3%–88.1%). Women had lower risk of developing mobility disability than men (hazard ratio [HR] 0.18 [95% CI 0.06–0.57]) and older age in women but not in men was an independent predictor of incident mobility disability. In addition, weaker ankle dorsiflexion strength (lowest vs highest quintile, HR 5.25 [95% CI 2.35–11.72]), lower hip flexion range of motion (lowest vs highest quintile, HR 2.30 [95% CI 1.20–4.41]), presence of primitive reflexes (yes vs no, HR 1.47 [95% CI 1.03–2.09]), and tremor (HR 1.91 [95% 95 1.18–3.07]) were independent predictors of incident mobility disability. Cumulative incidence of mobility loss by the most important predictors is shown in Figure 1. The 9-year risks from the proportional hazards model were comparable with those from cumulative incidence for competing risk (internal calibration) and RSF (cross-validated calibration). Additional details are shown in the Supplement 2.
Table 3.
Hazard Ratios of Mobility Loss Using Predictors From the Final Model.
| Variable | HR of Mobility Disability | 95% CI | P Value |
|---|---|---|---|
| Sex | |||
| Men | Ref | — | — |
| Women | 0.18 | 0.06, 0.57 | 0.004 |
| Age (y) among women | |||
| 65 to 68 | Ref | — | — |
| 68+ to 71 | 3.53 | 1.14, 10.89 | 0.028 |
| 71+ to 75 | 4.72 | 1.67, 13.29 | 0.003 |
| 75+ to 80 | 6.91 | 2.49, 19.19 | <0.001 |
| 80+ to 95 | 9.60 | 3.35, 27.50 | <0.001 |
| Age (y) among men | |||
| 65 to 68 | Ref | — | — |
| 68+ to 71 | 0.36 | 0.1, 1.26 | 0.11 |
| 71+ to 75 | 0.49 | 0.2, 1.19 | 0.12 |
| 75+ to 80 | 1.55 | 0.72, 3.34 | 0.27 |
| 80+ to 95 | 0.80 | 0.31, 2.07 | 0.65 |
| ROM hip flexion (degrees) | |||
| 130+ to 150 | Ref | — | — |
| 125+ to 130 | 1.55 | 0.73, 3.28 | 0.25 |
| 120+ to 125 | 1.79 | 0.90, 3.55 | 0.098 |
| 115+ to 120 | 1.85 | 0.95, 3.62 | 0.071 |
| 22 to 115 | 2.30 | 1.20, 4.41 | 0.012 |
| Ankle brachial index | |||
| 1.00 to 1.50 | Ref | — | — |
| 0.90 to 0.99 | 0.99 | 0.35, 2.78 | 0.98 |
| 0.80 to 0.89 | 0.46 | 0.11, 1.99 | 0.30 |
| 0.35 to 0.79 | 1.07 | 0.59, 1.92 | 0.83 |
| Dyspnea | |||
| No | Ref | — | — |
| Yes | 1.3 | 0.92, 1.83 | 0.14 |
| Tremor | |||
| No | Ref | — | — |
| Yes | 1.91 | 1.18, 3.07 | 0.008 |
| Total bone mineral density* | |||
| Normal | Ref | — | — |
| Osteopenic | 0.97 | 0.61, 1.54 | 0.90 |
| Osteoporotic | 1.01 | 0.67, 1.51 | 0.98 |
| Primitive reflexes | |||
| Normal | Ref | — | — |
| Abnormal | 1.47 | 1.03, 2.09 | 0.032 |
| Ankle dorsiflexion strength (kg) | |||
| 20.1+ to 31.4 | Ref | — | — |
| 16.4+ to 20.1 | 2.05 | 0.93, 4.52 | 0.075 |
| 14.0+ to 16.4 | 3.51 | 1.66, 7.45 | 0.001 |
| 11.2+ to 14.0 | 2.56 | 1.13, 5.81 | 0.025 |
| 2.0 to 11.2 | 5.25 | 2.35, 11.72 | <0.001 |
Notes: HR = hazard ratio, ROM = range of motion.
*Osteopenia is defined as −2.5 < SD < −1.0 and osteoporosis as ≤ −2.5 SD of bone mineral density of a young (20- to 40-year-old men and women). c-index from Cox model: 83.2% (SE = 2.5%).
Figure 1.
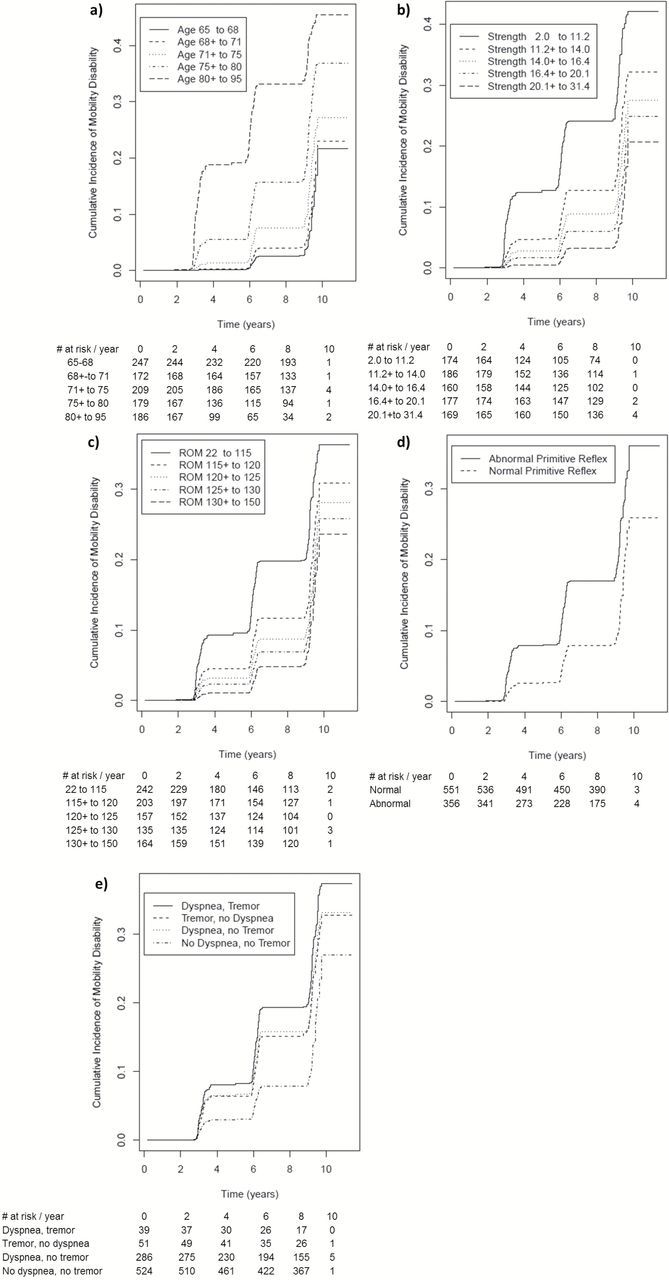
Cumulative incidence of mobility loss by categorized predictors. Tables below show persons at risk by each year and category. (a) Age (years); (b) ankle dorsiflexion strength (kg); (c) range of motion hip flexion (degrees); (d) primitive reflexes; (e) tremor and dyspnea.
Discussion
The aim of study was to identify the most relevant physiological factors associated with mobility loss in older persons. Using data from a 9-year longitudinal study that was originally designed to evaluate risk factors for decline in mobility, we found that impairments in multiple physiological systems, including bone and joints, muscle, central nervous system, and energy production and delivery, predict onset of mobility loss.
Although many studies have examined risk factors for mobility loss in community-dwelling older persons (5,6), the relative importance of a broad range of physiological impairments that may potentially affect mobility has not been well-defined. A few previous studies have investigated simultaneously geriatric impairments and chronic diseases (9,17) and found that geriatric impairments contribute more substantially to onset of mobility or activities of daily living disability than do common chronic diseases. In the study by Chaudhry and colleagues (9), muscle strength, physical capacity, cognition, vision, hearing, and depressive symptoms predicted onset of activities of daily living disability. In addition, Bootsma-van der Wiel and colleagues (17) reported that cognition and handgrip strength were most strongly associated with walking disability.
Instead of investigating the common geriatric impairments, which are shown to be in the pathway to mobility disability, our focus was based on a predefined conceptual model outlined for the InCHIANTI study about the physiological subsystems that are relevant to mobility (13). Based on the wealth of data available in the InCHIANTI study, we utilized altogether 44 different measures representing six physiological subsystems. Because of this large number of predictors and the high likelihood of multiple collinearities and interactions, we opted for the RSFs as analytical tool for variable selection to build a prediction model (14). The final proportional hazards model had good discrimination as shown by a c-index of 83.2%, which is higher or comparable with those of other widely used risk scores, such as Framingham risk score to predict coronary heart disease (18) and FRAX to predict fracture risk (19). Additional analysis presented in Supplement 2 also showed that the final model had good calibration. In the present study, older age, weaker ankle dorsiflexion strength, low range of motion in hip flexion, primitive reflexes, and tremor were independent predictors of incident mobility disability.
It is well established that muscle strength is strongly associated with mobility performance and poor muscle strength is an independent risk factor for mobility loss (10,11). Muscle was among the top subsystems that predicted mobility loss. This suggests that muscle weakness represents a specific reversible cause of mobility loss that could be potentially detected and corrected. Interestingly, among eight available muscle strength measurements in the InCHIANTI study, ankle dorsiflexion strength was found to be most important in predicting mobility loss. It is not clear why this is the case, but it may reflect the importance of lower extremity muscle strength for locomotive activities. Future research is needed to examine whether improving ankle dorsiflexion strength in people with poor dorsiflexion strength may have positive effects on walking and lower the risk of mobility disability in older adults.
In addition to muscle strength, independent predictors of incident mobility disability were low range of motion in hip flexors, presence of primitive reflexes, and tremor. Normal gait requires sufficient range of motion in all participating joints, especially in hip (20). With older ages there are several conditions, including hemiplegia, femoral neck fracture, and hip osteoarthritis that can decrease range of motion in hip flexion. Limited mobility in hip flexion impairs especially uphill walking and stair climbing.
The reappearance of developmental reflexes in the older age is often associated with severe diseases of the brain, particularly those affecting the frontal lobes, including but not limited to dementia, traumatic lesions and stroke (21). Tremor is also a symptom associated with disorders of the brain, such as stroke and multiple sclerosis, and with neurodegenerative diseases, Parkinson’s disease being the most common. Above-mentioned neurological conditions are known to impair mobility and tremor has been shown to be associated with lower physical performance (22).
Surprisingly, only a small subset of predicting variables was needed to develop a risk prediction model with good discrimination and calibration. This result contrasts somewhat with an extensive literature showing a large number of risk factor associated with disability and suggesting that the causal pathway to disability in late life is frequently multifactorial. At least two possible theories explain these findings. First, some evidence shows that risk factors for disability tend to cluster in the same individuals. Therefore, some factors may adequately represent themselves as well as close correlates. For example, participants with weak ankle dorsiflexion strength often had low muscle strength in other muscles. Second, it is possible that many risk factors for mobility loss affect on few phenotypes: impairment of these subsystems absorbs the cumulative effect of multiple risk factors and ultimately mediates their effect on mobility loss. Future studies are needed to test these two potentially complementary mechanisms leading to mobility loss.
In the present study, the outcome was mobility disability, taking into account the ability to walk and climb stairs, both being activities that are needed to be mobile in the community. To examine the two components of mobility disability, we conducted additional analysis using walking and stair climbing as separate outcomes in proportional hazard models using the same predictors as with mobility disability. The same predictors were statistically significantly associated with walking and stair climbing ability as with mobility disability. The c-index from Cox model was 85.2% for stair climbing and 82.5% for walking as compared with 83.2% when using mobility disability as our outcome suggesting that predictors of our final model are also highly predictive for both walking and stair climbing.
The main strengths of this study include the wide range of objectively measured physiological indicators and advanced statistical methods that allowed cross-validated quantification of predictors’ relative importance and independent contributions to mobility loss. In addition, the prospective longitudinal design with repeated measurements of mobility enabled us to monitor the development of mobility loss over nearly a decade.
The present study also has some limitations. Those who were lost to follow-up (mostly due to death) were older, had lower walking speed, and had more chronic conditions at baseline compared with those who remained in the study and therefore the estimated cumulative incidence of mobility disability is likely conservative. In addition, the InCHIANTI study cohort is all Caucasian and therefore the results may not be readily generalizable for diverse elderly populations such as the United States or Asia. Thus, further research is needed to confirm whether our findings apply also to populations with different ethnicity. Finally, due to the study design, incident mobility loss was measured every 3 years, although shorter measurement intervals might provide more accurate information.
In conclusion, a 9-year follow-up study of older community-dwelling adults indicates that impairments in multiple physiological systems, especially muscle, bone and joints, central nervous system, and energy production and delivery, predict onset of mobility loss. These findings have potential clinical relevance in that they can help clinicians determine which patients may benefit from preventive interventions. As a first step to enhancing clinical application, we used the results to develop a prediction model for mobility disability that demonstrates good discrimination and calibration. The next step in assessing the clinical utility of these findings is to evaluate the prediction model using external data. The results also suggest that prevention of mobility loss with aging should focus on prevention and treatment of diseases and conditions associated with neuromuscular impairments.
Supplementary Material
Supplementary material can be found at: http://biomedgerontology.oxfordjournals.org/
Funding
This work was supported by grants from the Academy of Finland (264944 and 273850) and in part by the Intramural research program of the National Institute on Aging, National Institutes of Health, Baltimore, Maryland. The InCHIANTI study baseline (1998–2000) was supported as a “targeted project” (ICS110.1/RF97.71) by the Italian Ministry of Health and in part by the U.S. National Institute on Aging (contracts: 263 MD 9164 and 263 MD 821336); the InCHIANTI Follow-up 1 (2001–2003) was funded by the U.S. National Institute on Aging (contracts: N.1-AG-1-1 and N.1-AG-1-2111); the InCHIANTI Follow-up 2 study (2004–2006) was financed by the U.S. National Institute on Aging (contract: N01-AG-5-0002); and the InCHIANTI Follow-up 3 study (2007–2008) was financed by the U.S. National Institute on Aging (contract: 1 Z01 AG001050-01). The funders had no role in study design, data collection and analysis, decision to publish, or preparation of the manuscript.
Conflict of Interest
The authors declare no conflict of interest.
Supplementary Material
References
- 1. Guralnik JM, Ferrucci L, Pieper CF, et al. Lower extremity function and subsequent disability: consistency across studies, predictive models, and value of gait speed alone compared with the short physical performance battery. J Gerontol A Biol Sci Med Sci. 2000;55:M221–M231. [DOI] [PMC free article] [PubMed] [Google Scholar]
- 2. Guralnik JM, Simonsick EM, Ferrucci L, et al. A short physical performance battery assessing lower extremity function: association with self-reported disability and prediction of mortality and nursing home admission. J Gerontol. 1994;49:M85–M94. [DOI] [PubMed] [Google Scholar]
- 3. Deandrea S, Lucenteforte E, Bravi F, Foschi R, La Vecchia C, Negri E. Risk factors for falls in community-dwelling older people: a systematic review and meta-analysis. Epidemiology. 2010;21:658–668. 10.1097/EDE.0b013e3181e89905 [DOI] [PubMed] [Google Scholar]
- 4. Studenski S, Perera S, Patel K, et al. Gait speed and survival in older adults. JAMA. 2011;305:50–58. 10.1001/jama.2010.1923 [DOI] [PMC free article] [PubMed] [Google Scholar]
- 5. Brown CJ, Flood KL. Mobility limitation in the older patient: a clinical review. JAMA. 2013;310:1168–1177. 10.1001/jama.2013.276566. [DOI] [PubMed] [Google Scholar]
- 6. Stuck AE, Walthert JM, Nikolaus T, Büla CJ, Hohmann C, Beck JC. Risk factors for functional status decline in community-living elderly people: a systematic literature review. Soc Sci Med. 1999;48:445–469. [DOI] [PubMed] [Google Scholar]
- 7. Guralnik JM, LaCroix AZ, Abbott RD, et al. Maintaining mobility in late life. I. Demographic characteristics and chronic conditions. Am J Epidemiol. 1993;137:845–857. [DOI] [PubMed] [Google Scholar]
- 8. LaCroix AZ, Guralnik JM, Berkman LF, Wallace RB, Satterfield S. Maintaining mobility in late life. II. Smoking, alcohol consumption, physical activity, and body mass index. Am J Epidemiol. 1993;137: 858–869. [DOI] [PubMed] [Google Scholar]
- 9. Chaudhry SI, McAvay G, Ning Y, Allore HG, Newman AB, Gill TM. Geriatric impairments and disability: the cardiovascular health study. J Am Geriatr Soc. 2010;58:1686–1692. 10.1111/j.1532-5415.2010.03022.x [DOI] [PMC free article] [PubMed] [Google Scholar]
- 10. Visser M, Goodpaster BH, Kritchevsky SB, et al. Muscle mass, muscle strength, and muscle fat infiltration as predictors of incident mobility limitations in well-functioning older persons. J Gerontol A Biol Sci Med Sci. 2005;60:324–333. [DOI] [PubMed] [Google Scholar]
- 11. Manini TM, Visser M, Won-Park S, et al. Knee extension strength cutpoints for maintaining mobility. J Am Geriatr Soc. 2007;55:451–457. 101111/j.1532-5415200701087x [DOI] [PubMed] [Google Scholar]
- 12. Sloan FA, Ostermann J, Brown DS, Lee PP. Effects of changes in self-reported vision on cognitive, affective, and functional status and living arrangements among the elderly. Am J Ophthalmol. 2005;140:618–627. [DOI] [PubMed] [Google Scholar]
- 13. Ferrucci L, Bandinelli S, Benvenuti E, et al. Subsystems contributing to the decline in ability to walk: bridging the gap between epidemiology and geriatric practice in the InCHIANTI study. J Am Geriatr Soc. 2000;48:1618–1625. [DOI] [PubMed] [Google Scholar]
- 14. Ishwaran H, Kogalur UB, Gorodeski EZ, Minn AJ, Lauer MS. High-dimensional variable selection for survival data. J Amer Stat Assoc. 2010;105:205–217. [Google Scholar]
- 15. Ishwaran H, Kogalur U. Random survival forests for R. R News. 2007;7:25–31. [Google Scholar]
- 16. Fine J, Gray R. A proportional hazards model for the subdistribution of a competing risk. J Am Stat Assoc. 1999;94:496–509. [Google Scholar]
- 17. Bootsma-van der Wiel A, Gussekloo J, De Craen AJ, Van Exel E, Bloem BR, Westendorp RG. Common chronic diseases and general impairments as determinants of walking disability in the oldest-old population. J Am Geriatr Soc. 2002;50:1405–1410. [DOI] [PubMed] [Google Scholar]
- 18. Wilson PW, D’Agostino RB, Levy D, Belanger AM, Silbershatz H, Kannel WB. Prediction of coronary heart disease using risk factor categories. Circulation. 1998;97:1837–1847. [DOI] [PubMed] [Google Scholar]
- 19. Schwartz AV, Vittinghoff E, Bauer DC, et al. Association of BMD and FRAX score with risk of fracture in older adults with type 2 diabetes. JAMA. 2011;305:2184–2192. 10.1001/jama.2011.715 [DOI] [PMC free article] [PubMed] [Google Scholar]
- 20. Perry J, Burnfield JB.Gait Analysis: Normal and Pathological Function. 2nd ed. Thorofare, NJ: SLACK Incorporated; 2010. [Google Scholar]
- 21. Schott JM, Rossor MN. The grasp and other primitive reflexes. J Neurol Neurosurg Psychiatry. 2003;74:558–560. [DOI] [PMC free article] [PubMed] [Google Scholar]
- 22. Inzitari M, Pozzi C, Ferrucci L, et al. Subtle neurological abnormalities as risk factors for cognitive and functional decline, cerebrovascular events, and mortality in older community-dwelling adults. Arch Intern Med. 2008;168:1270–1276. 10.1001/archinte.168.12.1270 [DOI] [PMC free article] [PubMed] [Google Scholar]
Associated Data
This section collects any data citations, data availability statements, or supplementary materials included in this article.