Burgess et al.1 comment that the modeling approach used in our recent article2 may have led to an incorrect estimate of hepatic anaplerosis because we did not explicitly include a term for pyruvate cycling. Although we agree that a pyruvate substrate cycle is a feature of hepatic metabolism, we contend that under most conditions, the flux through this cycle is low, relative to the TCA cycle (VTCA), and therefore does not substantially affect the rates of anaplerosis (VANA) that we reported. Furthermore, our measurements of VTCA depend primarily on the kinetics of enrichment of glutamate at C5, which are independent of VANA and pyruvate cycling via pyruvate kinase (VPK). Several independent lines of evidence support these conclusions.
Hepatic glutamate enrichment during these experiments is a complex function of the enrichments in acetyl-CoA, pyruvate and carbon dioxide, and the metabolic reactions that interact with these substrates, including VTCA, gluconeogenesis from phosphoenolpyruvate and entry of pyruvate–carbon-dioxide through pyruvate carboxylase and malic enzyme. Under fasting conditions, malic enzyme activity is low3,4, therefore pyruvate entry is almost exclusively through pyruvate carboxylase flux (VPC). VPC incorporates components owing to VANA and VPK, which we consider to be metabolically distinct processes. Anaplerotic pyruvate entry is required under gluconeogenic conditions to replenish the pool of TCA cycle intermediates that would otherwise be depleted due to the consumption of oxaloacetate (OAA) to form glucose via phosphoenolpyruvate (PEP), whereas pyruvate cycling involves the futile consumption and regeneration of pyruvate. Under this rationale, VPC = [VANA + VPK]. Because the total metabolite mass remains constant, VANA is also equivalent to the gluconeogenic flux from PEP. An earlier version of our model of hepatic metabolism included a discrete term for VPK to account for pyruvate cycling. Probability distribution analysis of Monte Carlo simulations of this model determined that VPK/VTCA was most likely to be <<0.49, with upper bound estimates (the 66th and 95th percentile of all runs) of 0.99 and 2.19, well below the values reported by Burgess et al.5,6. More importantly, simulations demonstrated that pyruvate cycling had no significant impact on our estimates of VANA and VTCA. Although our analysis indicated that PK flux must be low, owing to uncertainty in establishing an absolute rate of pyruvate cycling we felt that including it in our article would be misleading.
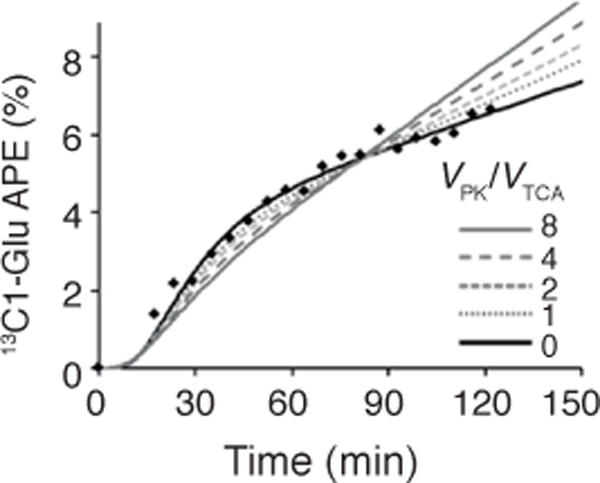
In support of their hypothesis, Burgess et al.1 applied a steady-state model7 to simulate the ratio of glutamate C1 to glutamate C5 under a range of PK flux conditions. Unfortunately, their model is not suitable for examining our data because the system was not at isotopic steady state—enrichment of bicarbonate and glutamate C1 continue to increase throughout the 2-h study—and this leads to erroneous interpretations. In contrast, our analysis is based on the kinetics of plasma acetate and hepatic bicarbonate and glutamate 13C enrichment, where each time point contributes to establishing the metabolic rates that best fit the raw data. Here we demonstrate the effects of pyruvate cycling on the kinetics and magnitude of glutamate C1 enrichment (Fig. 1); low rates of VPK clearly fit the experimental data better than the higher values (VPK/VTCA > 3.5) suggested by Burgess et al.1,5,6.
Figure 1.

The effect of pyruvate cycling, expressed as VPK/VTCA, on the kinetics of hepatic [1-13C]glutamate (13C1-Glu) enrichment during a 2-h infusion of [1-13C]acetate. Raw data (black diamonds) are reproduced from Befroy et al.2. Low rates of VPK clearly fit the experimental data better than the higher values suggested by Burgess et al.1. All studies were approved by the Yale Human Investigation Committee, and informed written consent was obtained from all subjects.
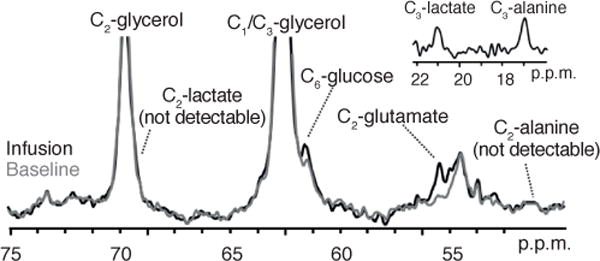
Low rates of pyruvate cycling are supported by other experimental evidence. We observed minimal labeling at C1 of pyruvate in liver tissue extracts from our studies of rats infused with [1-13C] acetate2, suggesting that PK flux is very low. We have also estimated V(PK + ME) / V(PC + PDH) from the ratio of alanine C2 to glucose C5 enrichment in rat liver during an infusion of [3-13C]alanine3,4. Hepatic V(PK + ME) in these experiments was estimated to be <27% of V(PC + PDH), more than an order of magnitude lower than that reported by Sunny et al.5. Furthermore, during an infusion of [3-13C] lactate in humans who had fasted overnight, we observed negligible 13C labeling of C2 in hepatic alanine and C2 of lactate pools using our in vivo 13C magnetic resonance spectroscopy technique (Fig. 2). The shift in 13C label from the C3 to the C2 position requires an isotopic equilibration that occurs owing to the rapid interconversion of OAA-malate-fumarate followed by the regeneration of pyruvate via VPK. Rapid rates of pyruvate cycling would lead to the appearance of alanine C2 and lactate C2 peaks of similar magnitude to their C3 counterparts, which we did not observe (Fig. 2). In contrast, we observed substantial 13C enrichment of hepatic glutamate C2 and glucose C6 owing to anaplerosis and gluconeogenesis, respectively.
Figure 2.

13C spectra acquired from human liver at baseline (gray) and after an infusion of [3-13C]lactate (black). Negligible enrichment at alanine C2 and lactate C2 compared to their C3 counterparts (inset, acquired during the same study under identical conditions and shown at the same scale) indicate that VPK/VTCA is low. All studies were approved by the Yale Human Investigation Committee, and informed written consent was obtained from all subjects.
Finally, pyruvate cycling and gluconeogenesis from PEP require obligate energy consumption. On the basis of the data from Sunny et al.5, where gluconeogenesis is approximately equivalent to TCA flux and pyruvate cycling is ~3.5 times TCA flux, the energy produced by the TCA cycle would be almost entirely consumed by these processes, a situation that is energetically unsustainable.
In conclusion, the rates of pyruvate cycling reported by Burgess et al.1,5,6 are incompatible with our human data2 and inconsistent with animal studies that have directly measured this flux in vitro3,8,9 and in vivo4. This difference may arise because [U-13C]propionate, the tracer used by Burgess et al.5,6, probably promotes pyruvate cycling anaplerosis, and gluconeogenesis by mass action effects and/or by its rapid conversion to propionyl-CoA and subsequent activation of pyruvate carboxylase10. Future studies should be able to assess this possibility directly.
Footnotes
COMPETING FINANCIAL INTERESTS
The authors declare no competing financial interests.
References
- 1.Burgess SC, et al. Nat Med. 2015;21:108–109. doi: 10.1038/nm.3789. [DOI] [PMC free article] [PubMed] [Google Scholar]
- 2.Befroy DE, et al. Nat Med. 2014;20:98–102. doi: 10.1038/nm.3415. [DOI] [PMC free article] [PubMed] [Google Scholar]
- 3.Petersen KF, et al. Metabolism. 1995;44:1380–1383. doi: 10.1016/0026-0495(95)90133-7. [DOI] [PubMed] [Google Scholar]
- 4.Petersen KF, et al. Am J Physiol. 1994;267:E273–E277. doi: 10.1152/ajpendo.1994.267.2.E273. [DOI] [PubMed] [Google Scholar]
- 5.Sunny NE, et al. Cell Metab. 2011;14:804–810. doi: 10.1016/j.cmet.2011.11.004. [DOI] [PMC free article] [PubMed] [Google Scholar]
- 6.Jones JG, et al. Am J Physiol. 1998;275:E843–E852. doi: 10.1152/ajpendo.1998.275.5.E843. [DOI] [PubMed] [Google Scholar]
- 7.Jeffrey FM, et al. Am J Physiol. 1996;271:E788–E799. doi: 10.1152/ajpendo.1996.271.4.E788. [DOI] [PubMed] [Google Scholar]
- 8.Cohen SM, et al. Proc Natl Acad Sci USA. 1981;78:60–64. doi: 10.1073/pnas.78.1.60. [DOI] [PMC free article] [PubMed] [Google Scholar]
- 9.Rognstad R, Katz J. J Biol Chem. 1977;252:1831–1833. [PubMed] [Google Scholar]
- 10.Krebs HA, et al. Adv Enzyme Regul. 1964;2:71–81. doi: 10.1016/s0065-2571(64)80006-6. [DOI] [PubMed] [Google Scholar]


