

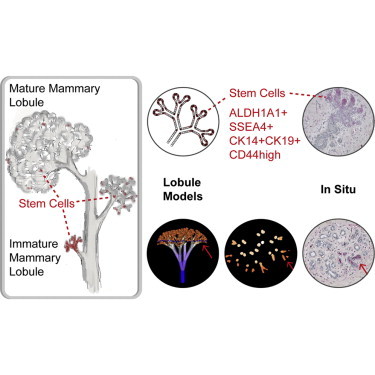
Summary
Characterization of normal breast stem cells is important for understanding their role in breast development and in breast cancer. However, the identity of these cells is a subject of controversy and their localization in the breast epithelium is not known. In this study, we utilized a novel approach to analyze the morphogenesis of mammary lobules, by combining one-dimensional theoretical models and computer-generated 3D fractals. Comparing predictions of these models with immunohistochemical analysis of tissue sections for candidate stem cell markers, we defined distinct areas where stem cells reside in the mammary lobule. An increased representation of stem cells was found in smaller, less developed lobules compared to larger, more mature lobules, with marked differences in the gland of nulliparous versus parous women and that of BRCA1/2 mutation carriers versus non-carriers.
Graphical Abstract
Highlights
-
•
The morphology of mammary lobules can be computer modeled
-
•
Stem cells identified by multiple markers have distinct localization in the breast
-
•
Immature mammary lobules contain a higher percentage of stem cells
-
•
This enrichment is higher in the breast of nulliparous women and BRCA1/2 carriers
In this article, Dontu, Honeth, and colleagues study the morphogenesis of mammary lobules and define areas where stem cells reside by combining one-dimensional theoretical models and computer-generated 3D fractals with immunohistochemical analysis of breast tissue sections. Immature mammary lobules have increased representation of stem cells, with further enrichment in the gland of nulliparous women as well as in BRCA1/2 mutation carriers.
Introduction
The mammary gland differs from other organs in that it continues to undergo morphogenesis postnatally, with paramount changes in tissue structure and cell population dynamics occurring during developmental windows such as puberty, pregnancy, and menopause. These processes are likely supported by a population of mammary stem cells that resides within the tissue. Regeneration of the entire gland from one single cell in multiple passages together with lineage-tracing experiments in vivo constitute compelling evidence for the existence of stem cell populations in the mouse mammary gland (Prater et al., 2014; Rios et al., 2014; Shackleton et al., 2006). However, owing to obvious experimental limitations, there is no direct definitive proof for the existence of a bona fide stem cell population active in the adult human mammary gland. Xenotransplantation of human mammary epithelium in cleared humanized mammary fat pads or under the renal capsule of immunodeficient mice allows in vivo outgrowths equivalent in size to one human mammary lobule. There has been no evidence of the generation of large mammary ducts in any in vivo or in vitro model. Moreover, only surrogate assays for self-renewal of putative human mammary stem cells are available for experimentally testing cell functions (Dontu et al., 2003; Eirew et al., 2008).
Given these limitations, the current knowledge regarding the identity of normal human mammary stem cells is based on markers that associate with the highest enrichment in stem-like functional properties, such as the ability to differentiate along both luminal and myoepithelial lineages, branching morphogenesis in 3D culture, and generation of outgrowths in xenotransplantation experiments. Combinations of cell surface markers that have been used to detect cell populations enriched in these properties include CD49fhighEpCAMlow (Eirew et al., 2008; Lim et al., 2009), CD73+CD90– (Roy et al., 2013), CD10+ (Keller et al., 2012), and CD49f+DLL1+DNER+ (Pece et al., 2010). Functional properties used to identify stem cells are high aldehyde dehydrogenase (ALDH) activity (Ginestier et al., 2007) and the ability to survive and proliferate in anchorage-independent conditions (Dontu et al., 2003; Pece et al., 2010). Some of these markers (i.e., ALDH+ and CD49f+) correlate with poor clinical outcome when highly expressed in breast tumors (Ali et al., 2011; Ginestier et al., 2007), possibly because they also identify a cancer stem cell population. Other stem cell markers validated in in vitro assays include SSEA4+ and CK14+CK19+ (Villadsen et al., 2007). All these phenotypes identify heterogeneous cell populations that contain more differentiated cells in addition to stem cells.
The combination of assays and markers listed above have not led to a consensus regarding the identity and localization of human mammary stem cells (Visvader and Stingl, 2014). To address this issue, we adopted an alternative, theoretical approach based on modeling mammary morphogenesis. We utilized 1D cell-replacement rules as well as computer-generated 3D fractals for modeling the human mammary lobule. This approach allowed us to formulate hypotheses for the localization of stem and progenitor cells within the branching structure of the gland. We compared predictions of these theoretical models with the pattern of marker expression in situ, as determined by immunostaining of sections of normal breast. Several proposed stem cell markers were co-expressed and their localization in situ coincided with the predictions of one of the models put forward in this study, in which stem cells are primarily present in clusters at the growing ends of intralobular branching ductules.
This analysis of adult stem cell localization in the context of 3D architecture of the mammary lobule establishes consensus regarding the identity of adult mammary stem cell markers, and it proposes a model of lobule morphogenesis with implications for the cellular origin of breast cancer.
Results
Theoretical Models of Mammary Lobule Development
We set out to model mammary lobule development to clarify the contribution of stem cells to breast morphogenesis. The models generated may have additional applications in histological studies of branched epithelia.
The tree-like structure of the human mammary gland consists of lobules and extralobular ducts that collect into big galactophore ducts (Figure S1A). Lobules are formed of dichotomically branched ductules, the ends of which form the alveoli filled with milk during lactation. Both ducts and lobules are delineated by two layers of epithelial cells: an inner layer of luminal cells and an outer layer of myoepithelial cells. Mammary lobules are the dynamic units of the normal adult breast, with a much higher cellular turnover than the ducts. It is universally recognized that the vast majority of breast cancers originate within the lobule rather than in the large extralobular ducts (Gusterson et al., 2005; O’Malley et al., 2011). For these reasons, we focused on modeling the developing mammary lobule.
We initially generated 1D cell-based models of lobule development with replacement rules for each dividing cell. We assumed that cellular de-differentiation is not a common phenomenon in the normal adult breast tissue, that cellular differentiation is accompanied by a progressive reduction in proliferative potential, and that terminally differentiated cells do not proliferate. For simplicity, we neglected naturally arising noise in cell division and performed a deterministic parallel replacement of each cell with its two daughters at each generation. Under these assumptions, several theoretical models of lobule development can be formulated based on the type of cell divisions that stem cells undergo and based on the spatial orientation of cell progeny relative to the mother cell and the parental duct. We use the term stem cell for the most undifferentiated cell type in the lobule, although we recognize that this may be a primitive type of progenitor cell. All other cells that can proliferate are termed progenitor cells. The fate choices taken into account for stem cell divisions were as follows: (1) asymmetric self-renewal or differentiation, (2) high or low rate of entering the cell cycle from quiescence, and (3) distal or proximal orientation of the more undifferentiated progeny relative to mother cell and parental duct (Figure S1C; Supplemental Experimental Procedures).
Combinations of these fate choices generated eight different models for lobule growth that differed in rate of growth and differentiation, as well as in localization and representation of stem cells within the developing lobule. In Figure 1, we show two examples of different outcomes in cell disposition within the lobule generated by different combinations of cell fate decision. All of the eight models are shown in Figure S1D. Two additional cell fates were also modeled, i.e., symmetric self-renewal of stem cells accompanied by asymmetric division of progeny (example shown in Figure S1E) and symmetric cell divisions of progenitor cells (example shown in Figure S1F). Other combinations including these cell fates are not presented here because the outcome cannot be distinguished from the models shown in Figure S1D, being different only in growth rate. For the simplicity of diagrams, only the luminal cell layer is shown. The myoepithelial layer is supposed to be generated from stem cells in the same direction as luminal cells. It is formed of fewer, longer cells with uniform morphology and marker expression.
Figure 1.
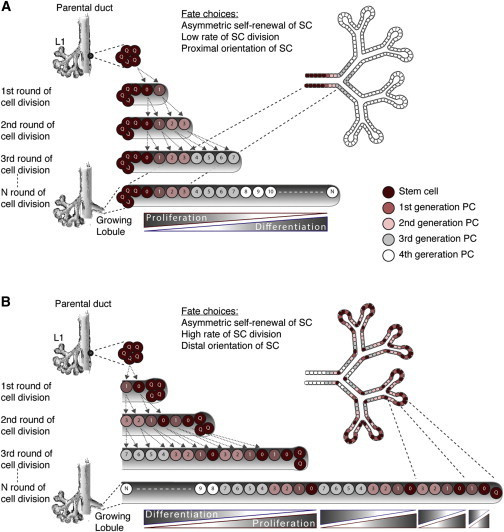
Examples of 1D Theoretical Models of Lobule Development Based on Cell Fate Decisions of Stem Cells
These models predict the localization and representation of stem cells within the developing lobule, rate of growth, as well as differentiation and proliferation patterns. Two examples are shown. More models are shown in Figure S1D. Each line indicates one generation of cell divisions. Colors of cells indicate differentiation status and numbers on cells indicate if they are identical daughters. The 2D trees to the right show cell disposition in the branching lobule.
(A) A model where stem cells undergo asymmetric self-renewal at a low rate of division, with proximal orientation of the most undifferentiated progeny cell (model A1B1C2 in Figure S1D). This model predicts a continuous gradient of proliferation and differentiation along the growing lobule, with the most undifferentiated cells concentrated at the base of the developing structure.
(B) A model where stem cells undergo asymmetric self-renewal at a high rate of division, with distal orientation of the most undifferentiated progeny cell (model A1B2C1 in Figure S1D). This model predicts a repetitive pattern of proliferation and differentiation along the growing lobule, with the most undifferentiated cells present at the leading edge as well as at branching points.
See also Figures S1 and S2.
We compared the predictions of the models shown in Figures 1 and S1 with observations of distribution of markers for proliferation and lineage differentiation, as well as the estrogen receptor (ER) in mammary lobules in sections through normal breast tissue. ER+ cells contain early progenitor cells according to several studies (Honeth et al., 2014; Keller et al., 2012; Shehata et al., 2012). Whereas lineage differentiation markers (e.g., CD10, EpCAM, SMA, and cytokeratins 18 and 19) have a uniform distribution in the lobule, proliferation markers (e.g., MCM2 and Ki67) and ER are present in scattered cells or in clusters of cells across lobules (Figure S2; Santagata et al., 2014). The majority of the models we generated predicted a continuous gradient of proliferation and differentiation along the growing lobule (see examples in Figures 1A and S1D). If lobule development would follow one of these models, differentiation markers would not have a uniform distribution and proliferation markers would be more frequent either in the central, larger ductules of the lobule or in the smallest ductules at the periphery of the lobule. Such patterns were not observed by us in tissue sections immunostained for MCM2 (Figure S2) and have not been reported elsewhere. Only two of the models in Figure S1D predicted repetitive patterns of proliferation and differentiation along the developing lobule, namely models A1B2C1 (also presented in Figure 1B) and A1B2C2.
Co-localization of Proposed Stem Cell Markers in Normal Breast Epithelium In Situ
To investigate how the predictions of the models presented above fit with observations regarding localization of stem cells in the breast epithelium in vivo, we analyzed the expression of putative stem cell markers in situ. It is important to note that mammary epithelial cell populations are heterogeneous with respect to the expression of markers currently used to identify stem or progenitor cells. Presumably, these markers are downregulated in a continuum during differentiation of stem cells into immediate early progenitor cells and then more mature progenitor cells. One would predict that markers associated with high proliferation potential in functional assays would co-localize in the same lobular region, rather than in the same cells. Studies employing flow cytometry analysis cannot detect this juxtaposition.
We performed immunohistochemistry (IHC) on normal breast sections for several proposed stem cell phenotypes described in the Introduction. For the ALDH phenotype, we assessed the expression of ALDH1A1 and ALDH1A3, which are the two isoforms that constitute the ALDEFLUOR+ population in normal breast (Honeth et al., 2014). We also immunostained for CD44 and CD24 because the CD44+CD24− phenotype has been shown to enrich for breast cancer stem cells. The same phenotype has been used as a surrogate marker of normal stem/progenitor cell in the human breast (Choudhury et al., 2013; Shipitsin et al., 2007). Individual staining patterns of these phenotypes are shown in Figure S3. As described in previous reports (Park et al., 2010; Santagata et al., 2014), EpCAM, CD10, CD49f, and CD44 were present throughout the entire epithelial tree: EpCAM was present in the luminal layer, CD10 in the basal layer, CD44 primarily in the basal layer, and CD49f in both luminal and basal layers. CK14 was present in the entire basal layer in large and secondary ducts and infrequently in the luminal layer in the lobules. CK19 was present in almost all cells of the luminal layer. CD24 was present in parts of the epithelium, in the apical membrane of intralobular luminal cells. It was detected only in a subset of breast samples, as previously described (Park et al., 2010). When CD24 was detectable, CD44+CD24− cells represented the majority of the CD44+ cell population. CD49f+EpCAM− cells were detectable reliably only in fluorescent staining, and they represented an infrequent population of cells localized in the basal layer of secondary ducts. ALDH1A3 was present in the luminal layer of extralobular ductules and larger ducts. ALDH1A1, SSEA4, and CK14+CK19+ were present in distinct clusters of cells representing a minority of the intralobular epithelium.
To determine possible overlaps among these phenotypes, we stained a series of consecutive sections from six different reduction mammoplasties (Figures 2A and S4). Furthermore, analysis of pairs of markers was done on samples from additional patients. Overall, a total of 18 samples were used; each combination of markers was analyzed in at least nine different samples. Clinical characteristics of the patients are presented in the Supplemental Experimental Procedures. We detected a strikingly clear overlap among staining patterns for ALDH1A1+, SSEA4+, and CK14+CK19+ in all the samples analyzed (Figures 2A and S4). To quantify this co-localization, we identified ALDH1A1+ areas across sections from the consecutively stained samples and analyzed the rest of the markers in the same areas on consecutive sections (Figure 2B). SSEA4+ and CK14+CK19+ staining was detected in 83% and 69% of the ALDH1A1+ areas, respectively. CD44 was present in 38% of these areas, at a higher level compared to the surrounding epithelium and in a luminal position. In the rest of the mammary epithelium tree, CD44 was expressed ubiquitously in the basal layer. SSEA4 was detected in distinct clusters of cells in cytoplasmic location. These cells also expressed ALDH1A1. Additionally, SSEA4 was detected as an apical luminal staining in a minority of the samples (Figure S3C). This apical staining did not overlap with the expression of ALDH1A1.
Figure 2.
Putative Stem Cell Markers Co-localize in the Normal Breast Epithelium
(A) Staining for putative stem cell phenotypes on consecutive sections from normal breast. Pictures show an area with overlap among CD44+, SSEA4+, CK14+CK19+, and ALDH1A1+ phenotypes. CD49f is not expressed in this area. Representative example from six different mammoplasties is shown.
(B) Quantification of other marker phenotypes in all ALDH1A1+ cell clusters (n = 61) across six different mammoplasty samples, showing high co-localization of ALDH1A1+, SSEA4+, and CK14+CK19+ phenotypes. EpCAM and CD44 were expressed in about two-thirds and one-third of the ALDH1A1+ cell clusters, respectively, while CD49f and ALDH1A3 were never expressed in these cell clusters. Bars represent mean percentage of each marker presence in the ALDH1A1+ islands, across the six samples, ± SEM.
(C and D) Double IF staining for ALDH1A1 together with SSEA4 and CD44, respectively. ALDH1A1 co-localizes with SSEA4 (C) and CD44high (D) in distinct cell clusters. Representative examples from stainings of four (SSEA4) and seven (CD44) different samples, respectively, are shown.
(E) Triple IF staining for ALDH1A1 (stained with AlexaFluor647 and detected in the far red filter, shown in red for clarity), CK14 (green), and CK19 (red, shown separate to the far right) illustrating overlap of these three markers in distinct clusters of cells. Representative example from stainings of six different samples is shown.
(F and G) Schematic and quantitative overlap of the ALDH1A1+, SSEA4+, CK14+CK19+, and CD44+ phenotypes. The letters in (F) indicate number of additional marker phenotypes co-expressed in ALDH1A1+ areas. Bars in (G) represent mean percentage of areas with indicated number of additional marker phenotypes positive in ALDH1A1+ areas, across six samples, ± SEM.
(H) Triple IF staining for ALDH1A1 (stained with AlexaFluor647 and detected in the far red filter, shown in green for clarity), CD49f (red), and EpCAM (green), illustrating the lack of overlap between ALDH1A1+ and CD49fhigh phenotypes. Although ALDH1A1 and CD49f can sometimes be expressed in close proximity, they are not expressed in the same cells (top). EpCAM also was expressed in this area, as illustrated by the far right picture showing EpCAM staining separately. The CD49fhighEpCAMlow cells in the basal layer are negative for ALDH1A1 (bottom, far right). Representative examples from stainings of six different samples are shown.
(I) Double immunofluorescent staining for ALDH1A1 and CD10 showing that, in the areas where ALDH1A1 is expressed, there are no, or very few, CD10+ myoepithelial cells (arrow), while high level CD10+ myoepithelial cells can be seen in neighboring acini (arrowhead). Representative example from stainings of four different samples is shown.
Scale bar, 100 μm in (A) and 50 μm in (E–I). Blue nuclear staining in fluorescence pictures is DAPI.
See also Figures S3 and S4.
The co-expression of these markers was confirmed using double and triple immunofluorescence (IF) stainings on at least four different samples (Figures 2C and 2D). Further analysis of ALDH1A1+, SSEA4+, CD44+, and CK14+CK19+ co-expression showed that, in 73% of the ALDH1A1+ areas, at least two of the other three phenotypes also were expressed (Figures 2F and 2G).
Cells with the phenotypes ALDH1A3+ or CD49fhighEpCAMlow were present exclusively in extralobular ducts. These two phenotypes did not overlap with each other or with the ALDH1A1+, SSEA4+, or CK14+CK19+ markers, which were present within the mammary lobule. Triple IF staining for CD49f/EpCAM/ALDH1A1 showed no overlap between CD49fhighEpCAMlow and ALDH1A1+ cells (Figure 2H). CD49f and ALDH1A1 also appeared to be segregated (Figures 2A, 2B, 2H, and S4). Similar findings regarding expression of CK14, CK19, and CD49f were reported in a recent study (Santagata et al., 2014).
Because this study focused on the mammary lobule and because ALDH1A1 used as a single marker detects the areas of overlapping stem cell markers present in the lobule, we used ALDH1A1 to identify and further characterize these areas. Moreover, we previously found that knockdown of ALDH1A1 impairs mammosphere formation and branching morphogenesis of mammary cells in 3D cultures (Honeth et al., 2014).
The areas where ALDH1A1 was expressed were characterized by a less organized bilayer structure, often with no clear lumen, co-localization of basal (CK14, CK5/6) and luminal (CK19) cytokeratins in the same cells (Figures 2A and S4), and often lower expression of EpCAM and CD10 (Figures S4 and 2I) compared to the surrounding epithelium. Further characterization using markers for proliferation (Ki67, MCM2) and cell-cycle arrest (p27) indicated that these areas were mainly resting or quiescent (Figure 3).
Figure 3.
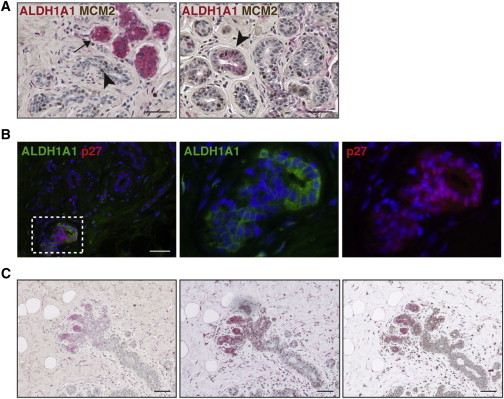
ALDH1A1+ Cells Are Predominantly Quiescent
(A) Double immunostaining for ALDH1A1 (red) and MCM2 (brown) in normal breast epithelium showing that these markers are rarely co-localized in the same cells (left: arrow, ALDH1A1+ cells; arrowhead, MCM2+ cells). Rare ALDH1A1low cells positive for MCM2 can be detected (right: arrowhead). Representative examples from stainings of five different samples are shown.
(B) Double IF stainings for ALDH1A1 and p27 showing co-localization of these markers. Representative example from stainings of six different samples is shown.
(C) Consecutive sections from a mammoplasty sample showing ALDH1A1 (red) expressed at the distal end of a small growing lobule. Double stainings with MCM2 (left) and p27 (middle) confirm patterns seen in (A and B).
Scale bar, 50 μm in (A and B) and 100 μm in (C).
Generation of a 3D Fractal Model of the Mammary Lobule
To better elucidate the localization of stem cell markers in the 3D architecture of the mammary lobule, we utilized computer-generated 3D fractal models and compared virtual sections with equivalent immunostained tissue sections (Figure 4). The fractal model was established as described in the Supplemental Experimental Procedures and was based on parameters measured in tissue sections in situ, including diameter and circumference of ductules, length of ductules (in micrometer and in number of cells), the ratio between lengths of consecutive branches, the ratio between radii of consecutive branches, and angles of branching. The model is dynamic and interactive; parameters can be changed to include different measurements.
Figure 4.
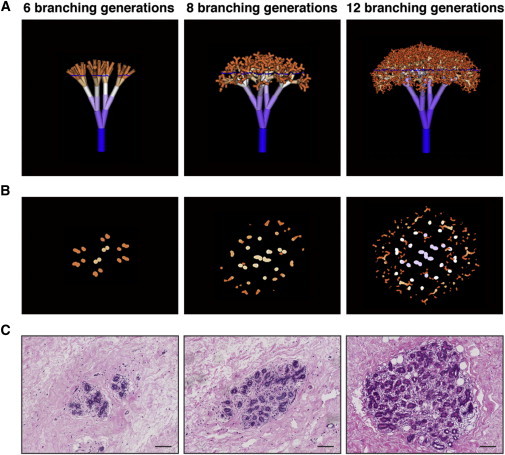
Fractal Models of Mammary Lobules with Virtual Sections in Comparison to Real Tissue Sections
(A) 3D trees generated by fractal modeling, representing mammary lobules with 6, 8, and 12 branching generations.
(B) Virtual sections through the fractal trees shown in (A). The sectioning plane is indicated by the blue line in (A).
(C) Real sections through normal breast lobules, corresponding to the fractal sections shown in (B) (H&E staining). Scale bar, 100 μm.
See also Figure S5.
Russo and colleagues have classified lobules based on size and morphology (Russo et al., 1992) into small, immature type 1 (L1), larger more developed type 2 (L2), and the largest and most mature outside pregnancy, type 3 lobules (L3) (see Figures S1A and S1B). For fitting the model, sections through fractals were compared to consecutive tissue sections through L1, L2, and L3, with respect to maximum diameter of the fractal tree/lobule; total number of ductule sections at maximum diameter; and shape, size, and pattern distribution of ductules in sections through the fractal tree. Models that included angles of branching at which ductules contacted each other or at which the ductule disposition was different from that observed in situ were eliminated (i.e., center of lobule with lower or higher density of ductules than observed in tissue sections or longitudinal sections in addition to cross-sections in a pattern not seen in tissue sections). We found parameters and models that met all these criteria (Figures 4 and S5; Supplemental Experimental Procedures).
A link to download the fractal model is provided in the Supplemental Experimental Procedures together with instructions on how to use it.
3D Localization of Stem Cell Markers in the Mammary Lobule
To better define the localization of ALDH1A1+ cells within the 3D structure of lobules, we compared virtual sections through fractal trees with breast tissue sections (Figure 5A). ALDH1A1+ cells appeared to be present at branching points and ends of ductules, in agreement with the model shown in Figure 1B (model A1B2C1). This is consistent with observations in the mouse mammary epithelium, where stem cells are positioned at the growing ends of ducts, in the so-called terminal end buds, which are also the nodes of subsequent branching (Kenney et al., 2001). Furthermore, evidence from a number of studies (Mani et al., 2008; Scheel et al., 2011) shows that stem cells from the normal mammary epithelium can undergo epithelial to mesenchymal transition, which enables them to migrate and invade in the surrounding matrix. All these observations are also consistent with a distal location of stem cells at the growing ends of ductules, rather than proximally, at the base of the lobule. However, lobular development occurs through simultaneous proliferation in the entire structure; therefore, lobular or ductal stem cells may be seen in a proximal position, at branching points, and at the distal ends of ductules (Ewald et al., 2008; Villadsen et al., 2007).
Figure 5.
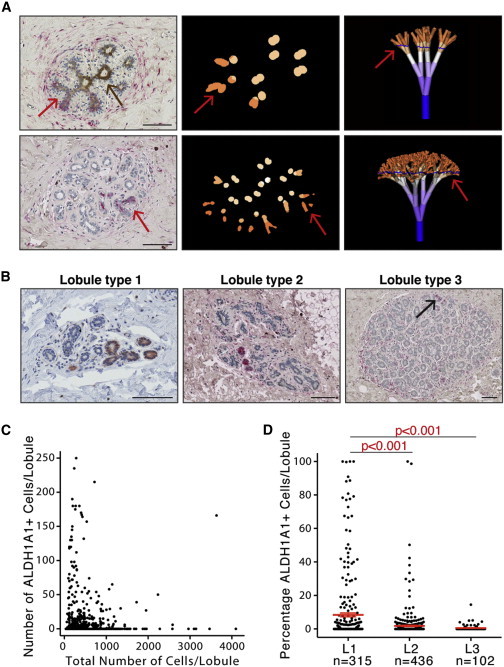
Representation of ALDH1A1+ Cells Is Higher in Immature Mammary Lobules
(A) Localization of ALDH1A1+ cell in the mammary lobule based on comparison of virtual sections with equivalent immunostained tissue sections. Arrows, ALDH1A1+ areas; brown staining, ALDH1A3 (upper left).
(B) In situ detection of ALDH1A1 (red or red-brown) in lobule types 1–3. Pictures show examples of representative lobules of each type. Arrow indicates rare ALDH1A1+ cells in lobule type 3. Scale bar, 100 μm. Representative examples from 18 different mammoplasty samples are shown.
(C) Scatter plot with number of ALDH1A1+ cells in each lobule section plotted against the total cell number in the same lobule. Data combined from 18 different patient samples. Total number of lobules analyzed is 853.
(D) Percentage of ALDH1A1+ cells in lobule types 1–3. Each dot represents one lobule. Error bars represent mean ± 95% confidence interval. P values between groups were calculated using one-way ANOVA with Tukey’s multiple comparisons test.
See also Figure S6.
Representation of Stem Cell Markers Correlates with Lobule Developmental Stage
One of the predictions of the models presented above is that L1 is enriched in stem cells. Findings from Russo’s group show that a high representation of L1 is present in nulliparous women compared to parous women and in women with higher susceptibility to breast cancer (Russo et al., 2001). We analyzed patterns of ALDH1A1 staining in relation to lobule development as described by Russo and colleagues (Russo et al., 1992). Briefly, lobule classification was based on the number of ductules in cross-section and the number of cells per ductule. The lobule classification also was validated by analysis of stromal/epithelial ratio and morphology in consecutive sections. The software described above additionally was utilized for the examination of lobule sections made at an angle different than 90°. We analyzed the total numbers and percentages of ALDH1A1+ cells in each lobule on tissue sections from 18 different women (11–110 lobules counted per section). Accurate assignment of sections to a lobule type was verified by analysis of consecutive sections that covered the entire thickness of the lobule. We found ALDH1A1+ cells predominantly in smaller lobules (Figures 5B and 5C); the percentage of ALDH1A1+ cells was significantly lower in L2 and L3 compared to L1 (p < 0.001; Figure 5D). The data for each individual sample analyzed are presented in Figure S6 and show that, in the majority of samples, the percentage of ALDH1A1+ cells was consistently higher in L1 compared to L2 and L3. This finding suggests that the correlation between L1 representation in the mammary gland and breast cancer risk described by Russo and colleagues may be due to the presence of a higher number of stem/progenitor cells.
To directly investigate possible correlations between the size of stem/progenitor cell population and parity, we compared the representation of ALDH1A1+ cells in the mammary epithelium of nulliparous women with that of parous women. We found no significant difference in the percentage of ALDH1A1+ cells in the epithelium of nulliparous women compared to that of parous women, when analyzing all the samples together (Figure 6A). Because the samples came from a heterogeneous patient population, we carried out the same analysis separately in samples from prophylactic mastectomy in BRCA1/2 mutation carriers and the rest of mammoplasty samples (non-BRCA). Overall there was a higher representation of ALDH1A1+ cells in the mammary epithelium of BRCA mutation carriers compared to non-carriers, but the difference was not statistically significant (Figure 6B). When analysis was performed separately for different lobule types, however, a significantly larger percentage of ALDH1A1+ cells was seen in L1 from BRCA1/2 mutation carriers compared to non-carriers (Figure 6C). Similarly, a considerable enrichment in ALDH1A1+ cells was seen in L1 from nulliparous women compared to parous women when BRCA1/2 mutation carriers and non-carriers were analyzed separately (Figures 6D and 6E). ALDH activity assessed by the ALDEFLUOR assay was not significantly different in samples from nulliparous and parous women, or in BRCA1/2 mutation carriers and non-carriers (data not shown), possibly due to the contribution of other isoforms to this activity (Honeth et al., 2014).
Figure 6.
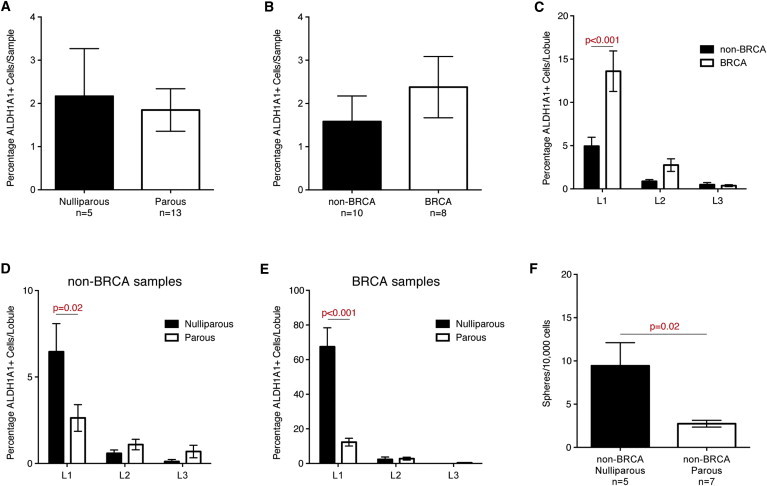
Immature Mammary Lobules of Nulliparous Women or BRCA1/2 Mutation Carriers Are Enriched in ALDH1A1+ Cells
(A) Comparison of percentage of ALDH1A1+ cells in all samples stratified on parity showed no significant difference between samples from nulliparous women and those from parous women. Bars represent mean percentages of ALDH1A1+ cells across the indicated number of samples ± SEM.
(B and C) Comparison of percentage of ALDH1A1+ cells in all samples stratified on BRCA status showed no significant difference between samples from women with and without confirmed mutations in BRCA1 or BRCA2 (B). Analysis of individual lobules from 18 women showed a significant increase in ALDH1A1 representation in lobule type 1 in samples from BRCA1/2 mutation compared to samples from non-BRCA carriers (C). Bars represent mean percentage of ALDH1A1+ cells ± SEM.
(D and E) Comparison of percentage of ALDH1A1+ cells in lobule types 1–3 in samples from women without (D) and with (E) BRCA1/2 mutations, respectively, showed a significantly higher percentage of ALDH1A1+ cells in lobule type 1 from nulliparous women compared to those from parous women in both BRCA carriers and non-carriers.
(F) Comparison of mammosphere-forming ability in dissociated mammary epithelial cells from nulliparous and parous women, showing higher sphere formation in samples from the latter group. Analysis was done on samples from non-BRCA carriers.
P values were calculated using Mann-Whitney U test (A, B, and F) or one-way ANOVA with Sidak’s multiple comparisons test (C–E).
We have demonstrated previously that cells with ALDH activity contain the cells capable of mammosphere formation (Ginestier et al., 2007) and that ALDH1A1 is critical for this sphere formation (Honeth et al., 2014). We therefore compared the efficiency of mammosphere formation in primary culture of mammary epithelial cells from nulliparous versus parous women (non-carriers of BRCA1/2 mutations). A significantly higher ability to form mammospheres was found in the samples from nulliparous women compared to those from parous women (Figure 6F).
We conclude that parity changes the cellularity of the mammary epithelium by promoting differentiation and reducing the number of stem/progenitor cells. The immature mammary lobules of nulliparous BRCA1/2 mutation carriers show a 10-fold enrichment in ALDH1A1+ cells compared to those of nulliparous non-carriers (Figures 6D and 6E). This observation suggests a profoundly altered cell differentiation associated with BRCA1/2 mutations.
Discussion
The stem cell model of cancer development posits that stem and progenitor cells present in adult tissues constitute the main target of malignant transformation. Additionally, it proposes that intra- and inter-tumoral heterogeneity can be attributed in part to the molecular features contributed by the cell of cancer origin, superimposed on aberrant differentiation and genomic instability. Experimental evidence supporting this concept in the context of breast cancer has been provided by studies from several groups (Keller et al., 2012; Molyneux et al., 2010). Recent findings by Santagata and colleagues showed that classification of breast tumors based on cell types found in the normal breast reflect differences in patient survival (Santagata et al., 2014). The clinical implications of these models are profound. However, controversies regarding identity of the normal human mammary stem cells and their relationship with the cells of cancer origin constitute a major roadblock in validating these models and translating their concepts into clinical applications.
We argue that definitive experimental proof for the existence and identity of human mammary stem cells cannot be produced with the current experimental tools. In this study we developed a new, complementary approach to address some of these challenges. We utilized theoretical modeling together with plausible combinations of cell fate decisions to examine the distribution of stem cells in different settings, and we compared the predictions of the generated models with our experimental observations. We used a combination of markers with well-defined disposition in the ductal and lobular regions of the mammary tree to compare predictions of the theoretical models with the observations in the human normal breast. Additionally, we utilized proliferation markers, under the assumption that proliferation is more frequent in the compartment of undifferentiated progenitor cells, as is the case in the intestinal and epidermal epithelia (Pinto and Clevers, 2005). Only a subset of growth rules was found to be consistent with the known 1D and 3D patterns of marker expression in normal human mammary lobules. The model, consistent with observed patterns of marker expression, combined the cell fate choices of asymmetric self-renewal, high rate of stem cell division, and distal orientation of the more undifferentiated cell progeny. The outcome was a repetitive gradient of differentiation in the growing lobule, with proliferating cells all along the developing structure and pools of stem cells at branching points and the tip of the developing structure. This repetitive pattern is consistent with a fractal-like, self-reiterative structure of the lobule, indicated by in situ measurements (Russo et al., 1992).
We generated an interactive fractal model of mammary lobules based on parameters measured in histological sections. The fractal tree can be virtually sectioned at arbitrary depth and angle and then compared to breast tissue sections. This model can quantitate the number of branching generations, the total number of cells in a lobule, and identify different generations of ductules present in a section. We utilized this model to identify the location of stem cell markers that were present in small clusters of cells scattered throughout the mammary epithelium, in apparently random fashion. Several of the stem cell markers used were present in such small clusters, representing a minority of the total cells. An important finding of this study is that the majority of stem cell markers investigated, namely ALDH1A1+, SSEA4+, CK14+CK19+, and CD44high, co-localize. This provides consensus among various published studies (Choudhury et al., 2013; Ginestier et al., 2007; Shipitsin et al., 2007; Villadsen et al., 2007). Importantly, the cells in which these markers co-localize have both luminal and basal characteristics and are situated at very distinct positions in the 3D structure of the lobule at the growing ends of ductules, which represent future points of branching. This is particularly clear when comparing the virtual and histological sections. Our study underscores the necessity of moving beyond the limited definitions of basal and luminal localization. As Gusterson and colleagues convincingly discuss, it is important to understand the distinction between basal and luminal phenotypes versus basal and luminal localization of mammary epithelial cells, and the distinction between basal cells and myoepithelial cells (Gusterson and Stein, 2012).
Interestingly, ALDH1A1+ cells were predominantly quiescent, the majority of them expressing the cell-cycle arrest marker p27 and only very rarely expressing the proliferation marker MCM2. Consistent with these findings, enhanced expression of p27 recently has been demonstrated in CD44+ progenitor population in the normal breast, and the p27+ cell population was found to be expanded in nulliparous breast and correlated with breast cancer risk (Choudhury et al., 2013).
Based on these results, the model of morphogenesis we propose is one in which a pool of quiescent stem cells is present at the leading edge of growing ductules in the lobule. These cells generate progeny that remain proximal to the parental duct, allowing stem and progenitor cells to maintain their location at the growing edge. Dichotomic branching appears to occur within the cell population in terminal or subterminal positions at the tip of ductules after which the ductule formation is re-iterated. Synchronous growth in multiple generations of branches would intrinsically generate smaller and smaller ductules.
Another finding was that the candidate stem cell phenotypes that never co-localized with the set enumerated above, ALDH1A3+ and CD49fhighEpCAMlow, are present exclusively in the extralobular ducts. It is possible that the human breast epithelium, unlike the mouse mammary epithelium, is sustained by more than one distinct population of stem or progenitor cells. Ductal progenitors may be active primarily before and around puberty while lobular progenitors may sustain the growth of lobules in adult life, including pregnancy. The stem cell population described by Villadsen and colleagues (Villadsen et al., 2007), present at the emergence of secondary ducts and lobules from big ducts, may be the cell pool that generates the lobular stem cells, which will subsequently move away from the parental duct. Our findings indicate that these lobular stem cells are ALDH1A1+. The change in expression of cytokeratins and ALDH isoforms between ducts and lobules is consistent with that seen during developmental patterning in other tissues. We focused on stem cells present in the lobules, given the implications for cancer origin. Association of ALDH activity or CD44 with functional or molecular cancer stem cell properties is also one of the most consistently reported in the literature. Several studies established a link between expansion of the ALDH1A1 cell population and cancer risk or cancer initiation (Ali et al., 2011; Ginestier et al., 2007; Khoury et al., 2012).
Numerous studies demonstrate that pregnancy before 35 years of age has a protective effect against breast cancer development (Clavel-Chapelon and Gerber, 2002). Russo and colleagues showed that the nulliparous breast contains predominantly L1 and L2, whereas the parous breast contains mostly L3. One of the explanations proposed for this correlation between parity and breast cancer risk was the persistence and/or expansion of the stem cell population in nulliparous women, as opposed to a decrease of this cell population with each pregnancy in parous women (Russo et al., 1999). Our findings that ALDH1A1+ cells are considerably enriched in immature L1 compared to L2 and L3 support such a correlation between long persistence of undifferentiated cells and risk of malignant transformation. Moreover, a significant difference was seen in the cellularity of immature lobules in nulliparous versus parous women and in patients that carry BRCA1 or BRCA2 mutations compared to non-carriers. These findings are consistent with previous reports from others and us, pointing to abnormalities in cellular differentiation associated with BRCA1/2 mutations, in addition to defects in DNA repair (Lim et al., 2009; Liu et al., 2008). Similar conclusions were reached by Kuperwasser and colleagues in a study using methods of analysis different from the ones we utilized (Arendt et al., 2014).
In conclusion, this study proposes a model of mammary lobule morphogenesis based on location and fate choices of stem and progenitor cells, which is consistent with the 1D and 3D patterns of markers seen in the normal breast tissue. Our results regarding localization of stem cell markers in a 3D context reconcile controversies on mammary stem cell markers, and they underscore the importance of moving beyond 2D considerations of stem cell localization (basal versus luminal) to tree-like 3D lobular structure. Our fractal model of mammary lobule morphogenesis allows such a 3D analysis. It can be instrumental in a large variety of in situ studies, it can facilitate characterization of the mammary stem cell niche, and it can simulate development of premalignant lesions in silico.
Experimental Procedures
Modeling of Mammary Lobule Formation
Modeling of mammary lobule formation based on theoretical and experimental parameters was done using a cell-based and a fractal-based approach described in detail in the Supplemental Experimental Procedures. The fractal model can be downloaded from the following link: https://github.com/FedericoV/FractalMammaryLobule and instructions on how to use it can be found in the Supplemental Experimental Procedures.
Processing of Breast Tissue Samples
Normal breast tissue was obtained with informed consent from patients undergoing mammoplasty for aesthetic or prophylactic reasons, under protocols approved by Guy’s Research Ethics Committee in agreement with the Human Tissue Act. The tissue was processed as previously described (Ginestier et al., 2007). Pieces of tissue were fixed in formalin for 24–48 hr before being processed and embedded in paraffin.
Immunostainings
Paraffin-embedded sections (3–4 μm) of normal human breast epithelium were deparaffinized in xylene and rehydrated in graded alcohol. Antigen retrieval was achieved by heating slides in pH 6 or pH 9 buffer (Vector Laboratories) according to recommendations or by enzymatic digestion with trypsin.
Single and double IHC was performed with EnVision HRP Rabbit/Mouse (DAB+) and EnVision G2 Doublestain System Rabbit/Mouse (both from Dako), respectively, according to recommendations, except for ALDH1A3 that was detected using peroxidase-conjugated donkey anti-goat secondary antibody (Jackson Laboratory) followed by VECTASTAIN Elite ABC Kit (Vector Laboratories) and 3,3-diaminobenzidene (DAB). Primary antibodies used are summarized in the Supplemental Experimental Procedures.
For double and triple IF stainings, sections were blocked with 10% donkey serum for 1 hr. Staining with primary antibodies was done in 10% donkey serum overnight at 4°C. Secondary antibodies (conjugated with AlexaFluor-488, -555, or -647, Molecular Probes) were incubated in 10% donkey serum for 1 hr at room temperature. Nuclei were counterstained with DAPI. All incubations and washes were done in PBS with 0.1% Triton X-100.
Lobule Classification and Analysis of ALDH1A1 Representation
Lobules were classified as previously described (Russo et al., 1992) into types 1–3 (L1–L3) on cross-sections of normal breast stained with ALDH1A1 and hematoxylin. The number of ductules per lobule was counted on scanned sections, and the lobules were classified as L1 if they contained ≤20 ductules, L2 if 21–60 ductules, and L3 if >60 ductules. The percentages of ALDH1A1+ cells in each lobule cross-section was determined by counting the number of nuclei with surrounding positive staining and dividing by the total number of nuclei.
Mammosphere Culture
Mammosphere culture was performed as previously described (Dontu et al., 2003), at a density of 20,000 viable cells/ml in primary culture. Counting of mammospheres was done manually, after 7–10 days, in six-well plates under light microscope in at least three wells for each condition.
Statistical Analysis
Data were analyzed using GraphPad Prism v6.0. Mann-Whitney U test or one-way ANOVA was performed to determine statistical significance, unless otherwise stated. P values < 0.05 were considered significant.
Author Contributions
G.H. and G.D. designed the study, performed experiments, analyzed data, and drafted the manuscript. T.S., F.V., and A.C.-N. generated the fractal model and wrote parts of the manuscript. S.E.P. supported histological and immunostaining evaluation. R.M., T.K., I.S., and S.L. contributed to data analysis and sample processing. B.B., R.G., P.G., V.R., and A.D.P. supported tissue procurement and data collection. J.B., S.E.P, and A.D.P. contributed to data analysis and presentation. All authors read and approved the final manuscript.
Acknowledgments
Thanks are due to professors Joyce Taylor-Papadimitriou and Anthony Coolen for critical review of the manuscript and to the KHP Cancer Biobank for assisting in tissue procurement. This work was supported by the Avon Foundation, Breakthrough Breast Cancer, and the Marion Burns Foundation. G.H. was supported by fellowships from the Swedish Research Council and the Swedish Society for Medical Research and partly by the Tegger Foundation.
Footnotes
This is an open access article under the CC BY-NC-ND license (http://creativecommons.org/licenses/by-nc-nd/4.0/).
Contributor Information
Gabriella Honeth, Email: gabriella.honeth@med.lu.se.
Gabriela Dontu, Email: gabriela.dontu@kcl.ac.uk.
Supplemental Information
References
- Ali H.R., Dawson S.J., Blows F.M., Provenzano E., Pharoah P.D., Caldas C. Cancer stem cell markers in breast cancer: pathological, clinical and prognostic significance. Breast Cancer Res. 2011;13:R118. doi: 10.1186/bcr3061. [DOI] [PMC free article] [PubMed] [Google Scholar]
- Arendt L.M., Keller P.J., Skibinski A., Goncalves K., Naber S.P., Buchsbaum R.J., Gilmore H., Come S.E., Kuperwasser C. Anatomical localization of progenitor cells in human breast tissue reveals enrichment of uncommitted cells within immature lobules. Breast Cancer Res. 2014;16:453. doi: 10.1186/s13058-014-0453-3. [DOI] [PMC free article] [PubMed] [Google Scholar]
- Choudhury S., Almendro V., Merino V.F., Wu Z., Maruyama R., Su Y., Martins F.C., Fackler M.J., Bessarabova M., Kowalczyk A. Molecular profiling of human mammary gland links breast cancer risk to a p27(+) cell population with progenitor characteristics. Cell Stem Cell. 2013;13:117–130. doi: 10.1016/j.stem.2013.05.004. [DOI] [PMC free article] [PubMed] [Google Scholar]
- Clavel-Chapelon F., Gerber M. Reproductive factors and breast cancer risk. Do they differ according to age at diagnosis? Breast Cancer Res. Treat. 2002;72:107–115. doi: 10.1023/a:1014891216621. [DOI] [PMC free article] [PubMed] [Google Scholar]
- Dontu G., Abdallah W.M., Foley J.M., Jackson K.W., Clarke M.F., Kawamura M.J., Wicha M.S. In vitro propagation and transcriptional profiling of human mammary stem/progenitor cells. Genes Dev. 2003;17:1253–1270. doi: 10.1101/gad.1061803. [DOI] [PMC free article] [PubMed] [Google Scholar]
- Eirew P., Stingl J., Raouf A., Turashvili G., Aparicio S., Emerman J.T., Eaves C.J. A method for quantifying normal human mammary epithelial stem cells with in vivo regenerative ability. Nat. Med. 2008;14:1384–1389. doi: 10.1038/nm.1791. [DOI] [PubMed] [Google Scholar]
- Ewald A.J., Brenot A., Duong M., Chan B.S., Werb Z. Collective epithelial migration and cell rearrangements drive mammary branching morphogenesis. Dev. Cell. 2008;14:570–581. doi: 10.1016/j.devcel.2008.03.003. [DOI] [PMC free article] [PubMed] [Google Scholar]
- Ginestier C., Hur M.H., Charafe-Jauffret E., Monville F., Dutcher J., Brown M., Jacquemier J., Viens P., Kleer C.G., Liu S. ALDH1 is a marker of normal and malignant human mammary stem cells and a predictor of poor clinical outcome. Cell Stem Cell. 2007;1:555–567. doi: 10.1016/j.stem.2007.08.014. [DOI] [PMC free article] [PubMed] [Google Scholar]
- Gusterson B.A., Stein T. Human breast development. Semin. Cell Dev. Biol. 2012;23:567–573. doi: 10.1016/j.semcdb.2012.03.013. [DOI] [PubMed] [Google Scholar]
- Gusterson B.A., Ross D.T., Heath V.J., Stein T. Basal cytokeratins and their relationship to the cellular origin and functional classification of breast cancer. Breast Cancer Res. 2005;7:143–148. doi: 10.1186/bcr1041. [DOI] [PMC free article] [PubMed] [Google Scholar]
- Honeth G., Lombardi S., Ginestier C., Hur M., Marlow R., Buchupalli B., Shinomiya I., Gazinska P., Bombelli S., Ramalingam V. Aldehyde dehydrogenase and estrogen receptor define a hierarchy of cellular differentiation in the normal human mammary epithelium. Breast Cancer Res. 2014;16:R52. doi: 10.1186/bcr3663. [DOI] [PMC free article] [PubMed] [Google Scholar]
- Keller P.J., Arendt L.M., Skibinski A., Logvinenko T., Klebba I., Dong S., Smith A.E., Prat A., Perou C.M., Gilmore H. Defining the cellular precursors to human breast cancer. Proc. Natl. Acad. Sci. USA. 2012;109:2772–2777. doi: 10.1073/pnas.1017626108. [DOI] [PMC free article] [PubMed] [Google Scholar]
- Kenney N.J., Smith G.H., Lawrence E., Barrett J.C., Salomon D.S. Identification of Stem Cell Units in the Terminal End Bud and Duct of the Mouse Mammary Gland. J. Biomed. Biotechnol. 2001;1:133–143. doi: 10.1155/S1110724301000304. [DOI] [PMC free article] [PubMed] [Google Scholar]
- Khoury T., Ademuyiwa F.O., Chandrasekhar R., Jabbour M., Deleo A., Ferrone S., Wang Y., Wang X. Aldehyde dehydrogenase 1A1 expression in breast cancer is associated with stage, triple negativity, and outcome to neoadjuvant chemotherapy. Mod. Pathol. 2012;25:388–397. doi: 10.1038/modpathol.2011.172. [DOI] [PMC free article] [PubMed] [Google Scholar]
- Lim E., Vaillant F., Wu D., Forrest N.C., Pal B., Hart A.H., Asselin-Labat M.L., Gyorki D.E., Ward T., Partanen A., kConFab Aberrant luminal progenitors as the candidate target population for basal tumor development in BRCA1 mutation carriers. Nat. Med. 2009;15:907–913. doi: 10.1038/nm.2000. [DOI] [PubMed] [Google Scholar]
- Liu S., Ginestier C., Charafe-Jauffret E., Foco H., Kleer C.G., Merajver S.D., Dontu G., Wicha M.S. BRCA1 regulates human mammary stem/progenitor cell fate. Proc. Natl. Acad. Sci. USA. 2008;105:1680–1685. doi: 10.1073/pnas.0711613105. [DOI] [PMC free article] [PubMed] [Google Scholar]
- Mani S.A., Guo W., Liao M.J., Eaton E.N., Ayyanan A., Zhou A.Y., Brooks M., Reinhard F., Zhang C.C., Shipitsin M. The epithelial-mesenchymal transition generates cells with properties of stem cells. Cell. 2008;133:704–715. doi: 10.1016/j.cell.2008.03.027. [DOI] [PMC free article] [PubMed] [Google Scholar]
- Molyneux G., Geyer F.C., Magnay F.A., McCarthy A., Kendrick H., Natrajan R., Mackay A., Grigoriadis A., Tutt A., Ashworth A. BRCA1 basal-like breast cancers originate from luminal epithelial progenitors and not from basal stem cells. Cell Stem Cell. 2010;7:403–417. doi: 10.1016/j.stem.2010.07.010. [DOI] [PubMed] [Google Scholar]
- O’Malley M.B., Pinder S.E., Mulligan A.M. Elsevier; Philadelphia: 2011. Breast Pathology. [Google Scholar]
- Park S.Y., Lee H.E., Li H., Shipitsin M., Gelman R., Polyak K. Heterogeneity for stem cell-related markers according to tumor subtype and histologic stage in breast cancer. Clin. Cancer Res. 2010;16:876–887. doi: 10.1158/1078-0432.CCR-09-1532. [DOI] [PMC free article] [PubMed] [Google Scholar]
- Pece S., Tosoni D., Confalonieri S., Mazzarol G., Vecchi M., Ronzoni S., Bernard L., Viale G., Pelicci P.G., Di Fiore P.P. Biological and molecular heterogeneity of breast cancers correlates with their cancer stem cell content. Cell. 2010;140:62–73. doi: 10.1016/j.cell.2009.12.007. [DOI] [PubMed] [Google Scholar]
- Pinto D., Clevers H. Wnt control of stem cells and differentiation in the intestinal epithelium. Exp. Cell Res. 2005;306:357–363. doi: 10.1016/j.yexcr.2005.02.022. [DOI] [PubMed] [Google Scholar]
- Prater M.D., Petit V., Alasdair Russell I., Giraddi R.R., Shehata M., Menon S., Schulte R., Kalajzic I., Rath N., Olson M.F. Mammary stem cells have myoepithelial cell properties. Nat. Cell Biol. 2014;16:942–950. doi: 10.1038/ncb3025. [DOI] [PMC free article] [PubMed] [Google Scholar]
- Rios A.C., Fu N.Y., Lindeman G.J., Visvader J.E. In situ identification of bipotent stem cells in the mammary gland. Nature. 2014;506:322–327. doi: 10.1038/nature12948. [DOI] [PubMed] [Google Scholar]
- Roy S., Gascard P., Dumont N., Zhao J., Pan D., Petrie S., Margeta M., Tlsty T.D. Rare somatic cells from human breast tissue exhibit extensive lineage plasticity. Proc. Natl. Acad. Sci. USA. 2013;110:4598–4603. doi: 10.1073/pnas.1218682110. [DOI] [PMC free article] [PubMed] [Google Scholar]
- Russo J., Rivera R., Russo I.H. Influence of age and parity on the development of the human breast. Breast Cancer Res. Treat. 1992;23:211–218. doi: 10.1007/BF01833517. [DOI] [PubMed] [Google Scholar]
- Russo J., Ao X., Grill C., Russo I.H. Pattern of distribution of cells positive for estrogen receptor alpha and progesterone receptor in relation to proliferating cells in the mammary gland. Breast Cancer Res. Treat. 1999;53:217–227. doi: 10.1023/a:1006186719322. [DOI] [PubMed] [Google Scholar]
- Russo J., Hu Y.F., Silva I.D., Russo I.H. Cancer risk related to mammary gland structure and development. Microsc. Res. Tech. 2001;52:204–223. doi: 10.1002/1097-0029(20010115)52:2<204::AID-JEMT1006>3.0.CO;2-F. [DOI] [PubMed] [Google Scholar]
- Santagata S., Thakkar A., Ergonul A., Wang B., Woo T., Hu R., Harrell J.C., McNamara G., Schwede M., Culhane A.C. Taxonomy of breast cancer based on normal cell phenotype predicts outcome. J. Clin. Invest. 2014;124:859–870. doi: 10.1172/JCI70941. [DOI] [PMC free article] [PubMed] [Google Scholar]
- Scheel C., Eaton E.N., Li S.H., Chaffer C.L., Reinhardt F., Kah K.J., Bell G., Guo W., Rubin J., Richardson A.L., Weinberg R.A. Paracrine and autocrine signals induce and maintain mesenchymal and stem cell states in the breast. Cell. 2011;145:926–940. doi: 10.1016/j.cell.2011.04.029. [DOI] [PMC free article] [PubMed] [Google Scholar]
- Shackleton M., Vaillant F., Simpson K.J., Stingl J., Smyth G.K., Asselin-Labat M.L., Wu L., Lindeman G.J., Visvader J.E. Generation of a functional mammary gland from a single stem cell. Nature. 2006;439:84–88. doi: 10.1038/nature04372. [DOI] [PubMed] [Google Scholar]
- Shehata M., Teschendorff A., Sharp G., Novcic N., Russell I.A., Avril S., Prater M., Eirew P., Caldas C., Watson C.J., Stingl J. Phenotypic and functional characterisation of the luminal cell hierarchy of the mammary gland. Breast Cancer Res. 2012;14:R134. doi: 10.1186/bcr3334. [DOI] [PMC free article] [PubMed] [Google Scholar]
- Shipitsin M., Campbell L.L., Argani P., Weremowicz S., Bloushtain-Qimron N., Yao J., Nikolskaya T., Serebryiskaya T., Beroukhim R., Hu M. Molecular definition of breast tumor heterogeneity. Cancer Cell. 2007;11:259–273. doi: 10.1016/j.ccr.2007.01.013. [DOI] [PubMed] [Google Scholar]
- Villadsen R., Fridriksdottir A.J., Rønnov-Jessen L., Gudjonsson T., Rank F., LaBarge M.A., Bissell M.J., Petersen O.W. Evidence for a stem cell hierarchy in the adult human breast. J. Cell Biol. 2007;177:87–101. doi: 10.1083/jcb.200611114. [DOI] [PMC free article] [PubMed] [Google Scholar]
- Visvader J.E., Stingl J. Mammary stem cells and the differentiation hierarchy: current status and perspectives. Genes Dev. 2014;28:1143–1158. doi: 10.1101/gad.242511.114. [DOI] [PMC free article] [PubMed] [Google Scholar]
Associated Data
This section collects any data citations, data availability statements, or supplementary materials included in this article.