Abstract
Chaperone-mediated autophagy (CMA) is activate in response to cellular stressors to prevent cellular proteotoxicity through selective degradation of altered proteins in lysosomes. Reduced CMA activity contributes to the decrease in proteome quality in disease and aging. Here, we report that CMA is also upregulated in response to genotoxic insults and that declined CMA functionality leads to reduced cell survival and genomic instability. This role of CMA in genome quality control is exerted through regulated degradation of activated checkpoint kinase 1 (Chk1) by this pathway after the genotoxic insult. Nuclear accumulation of Chk1 in CMA-deficient cells compromises cell cycle progression and prolongs the time that DNA damage persists in these cells. Furthermore, blockage of CMA leads to hyperphosphorylation and destabilization of the MRN (Mre11-Rad50-Nbs1) complex, which participates in early steps of particular DNA repair pathways. We propose that CMA contributes to maintain genome stability by assuring nuclear proteostasis.
Keywords: Autophagy, cell cycle check point, DNA repair, genotoxicity, lysosomes
Autophagy is a highly conserved intracellular pathway that mediates the degradation of proteins and organelles in lysosomes1,2. Selective autophagy contributes to regulate protein function by modulating their intracellular levels and participates in quality control by eliminating damaged proteins and organelles. Quality control is also essential for the preservation of genome integrity and is in part attained through the action of the DNA repair pathways specific for the different types of DNA damage3. The main constituents of DNA maintenance and repair are proteins, and as such, changes in their regulated degradation and/or in their quality control through processes such as autophagy could impact maintenance and repair of genome integrity.
Three main types of autophagy co-exist in almost all mammalian cells: macroautophagy, microautophagy and chaperone-mediated autophagy (CMA)1,2,4. Recent studies have demonstrated a protective effect of macroautophagy during DNA damage5–7 and that macroautophagy is necessary, but not sufficient, for the degradation of specific DNA repair proteins8,9. In this study, we focus on CMA due to its selectivity for single soluble proteins4,10. Only proteins carrying a specific CMA-targeting motif (KFERQ-like motif11) are recognized by a constitutive member of the hsp70 chaperone family, the heat shock cognate protein of 70KDa, Hsc7012, that transfers the substrate from the cytosol to the lysosomal CMA receptor LAMP-2A (lysosome-associated membrane protein type 2A)13. Subsequent unfolding of the substrate protein14 and multimerization of the receptor15 facilitate the translocation of the substrate across the lysosomal membrane and its rapid degradation by luminal resident proteases. CMA is maximally activated in response to stressors such as nutritional stress, oxidative stress and hypoxia and its activity declines with age16.
In this work, we demonstrate that CMA is upregulated in response to DNA damage and that failure to activate CMA in these conditions results in DNA damage accumulation. We have found that CMA participates in the tightly regulated, timely degradation of the cell cycle checkpoint regulator checkpoint kinase 1 (Chk1), thereby allowing disengagement of DNA repair proteins and normal cell cycle progression after DNA repair17. Prolonged persistence of Chk1 in the nucleus when CMA is inhibited leads to accumulation of DNA damage and changes in levels of nuclear proteins such as the Mre11-Rad50-Nbs1 (MRN) complex that participates in the initial processing of double-strand DNA breaks prior to DNA repair by homologous recombination.
Results
CMA deficiency renders cells more sensitive to genotoxicity
To investigate if CMA confers cellular resistance against DNA damage, we used etoposide, an agent that induces DNA double strand breaks (DSBs)18, in mouse fibroblasts control (Ctr) or knocked down for LAMP-2A (L2A(−) cells) or for Atg7 (Atg7(−) cells) to reduce CMA or macroautophagy activity, respectively19. L2A(−) cells were significantly more vulnerable to etoposide than control or Atg7(−) cells (Fig. 1a and Supplementary Fig. 1a). Embryonic fibroblasts from mouse null for L2A displayed similar higher sensitivity to etoposide, discarding possible off-target effects of the knock-down (Supplementary Fig. 1b). Exposure to other genotoxic agents including alkylating agents (methylmethanesulfonate (MMS) and cisplatin), pro-oxidant agents (paraquat), inhibitors of DNA synthesis (hydroxyurea) and a class I topoisomerase inhibitor, revealed that L2A(−) cells were consistently more sensitive to all these agents than control cells (Fig. 1b). Cells with compromised macroautophagy also showed higher sensitivity to the two alkylating agents but not to the other genotoxic insults (Fig. 1b).
Figure 1. Blockage of CMA increases cellular susceptibility to genotoxicity.
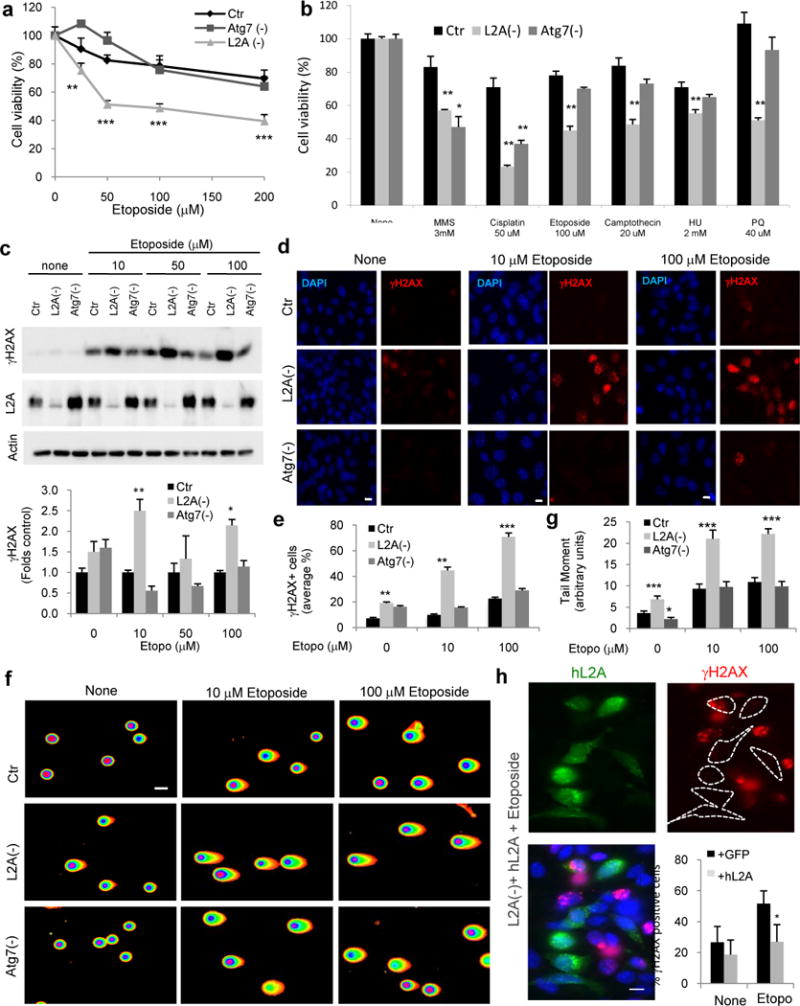
a,b. Viability of mouse fibroblasts (NIH3T3) Ctr, L2A(−) or knock-down for Atg7 (Atg7 (−)) after 24h of etoposide treatment (a) or the indicated genotoxic insults (b), n=6 wells in 3 independent experiments. c. Representative immunoblot in the same cells as in a (top) and quantification of phosphorylated γH2AX relative to untreated cells (bottom), n=5 independent experiments. d. Immunofluorescence for γH2AX and nuclear staining by DAPI in the same cells. Scale bar: 5μm. e. Percentage of cells shown in d, with nuclear γH2AX foci (n = 3 independent experiments where the number of total cells counted per experimental condition were more than 100 (>5 fields, average 20 cells/field)). f. Neutral comet assay in the same cells, after 24h etoposide treatment. Scale bar: 10μm.g. Quantification of tail moment in the same cells (n = 3 experiments where more than 35 cells (>7 fields, ~.5cells/field) were counted per experiment. h. Immunofluorescence for γH2AX in L2A(−) cells transfected with GFP-hL2A and treated as in f. Nuclei are highlighted with DAPI. Individual and merged channels are shown. Dashed lines: Cell profiles. Scale bar: 10μm. Quantification of percent of cells with nuclear foci after GFP or GFP-hL2A transfection is shown, n=3 independent experiments. All values are mean+s.e.m. (unpaired two-tailed t-test) *P<0.05, **P<0.005 or ***P<0.0005. Full gels are shown in Supplementary Fig. 8.
The enhanced sensitivity to etoposide in L2A(−) cells associated with increased levels of DNA damage, measured as higher levels of phosphorylated H2AX (γH2AX), a DSBs marker, than in Ctr and Atg7(−) cells (Fig. 1c). In fact, a higher percentage of L2A(−) cells were positive for γH2AX foci (>10 foci/cell) even in the absence of etoposide treatment (Fig. 1d,e). We further confirmed the higher load of DNA damage in L2A(−) cells using the neutral comet assay (Fig. 1f,g and Supplementary Fig. 1c). Similarly, we observed higher DNA damage load in L2A(−) cells after exposure to γ-irradiation, that is also a DSB inducer (Supplementary Fig. 1d). We confirmed that the increase in DNA damage in L2A(−) cells was a direct consequence of the loss of L2A, because overexpression of human L2A in the knock-down cells was sufficient to reduce both levels of γH2AX by immunoblot (Supplementary Fig. 1e) and number of γH2AX foci (Fig 1h and Supplementary Fig. 1f; most of the foci are detected in non-transfected cells). Knockdown of other abundant lysosomal membrane proteins, such as LAMP-2B and LAMP1 (Supplementary Fig. 2a,b) did not increase cellular sensitivity to etoposide or the percentage of cells positive for γH2AX foci (Supplementary Fig. 2c,d; contrary to the efficient knockdown of LAMP2B, we only attained partial (45%) knockdown for LAMP-1 which also resulted in decrease (65%) in LAMP2B, but even with this double partial knock-down, we could not reproduce the enhanced sensitivity and DNA damage accumulation observed in the L2A(−) cells). Furthermore, expression of LAMP-2B in L2A(−) cells did not reduce the higher levels of γH2AX detectable in these cells by immunoblot (Supplementary Fig. 2e) or the number of γH2AX foci (Supplementary Fig. 2d). Taken together, these results demonstrate that reduced L2A levels, and consequently reduced CMA activity renders cells susceptible to genotoxic agents and increases DNA damage load.
CMA is upregulated in response to DNA damage
Since the connection between CMA and DNA damage had not been studied before, we next determined if genotoxic stress induced CMA. Etoposide induced a dose-dependent increase in lysosomal degradation (Fig. 2a) but not by macroautophagy, because flux of LC3 and p62 did not change significantly under these experimental conditions (Supplementary Fig. 3). In contrast, a CMA-specific fluorescent substrate (photoactivable KFERQ-dendra reporter (modified from20) that highlights lysosomes as fluorescent puncta when CMA is activated, revealed that CMA activity increased in a dose-dependent manner during the etoposide treatment (Fig. 2b) and remained upregulated even 12h after the removal of etoposide (Fig. 2b). A similar dose- and time-dependent increase in CMA activity was observed upon exposure to other genotoxic agents (Fig. 2d,e and Supplementary Fig. 4a,b). We confirmed that upregulation of CMA in response to DNA damage also occurs in vivo since intact lysosomes isolated from the livers of mice treated with a single intraperitoneal injection of etoposide showed a marked increase in their ability to take up and degrade radiolabeled cytosolic CMA substrates, the most direct assay for quantification of CMA (Fig. 2f). Maximal activation of CMA was reached at 12h post injection and was still evident 24h after the treatment.
Figure 2. CMA is upregulated in response to double strand DNA damage.
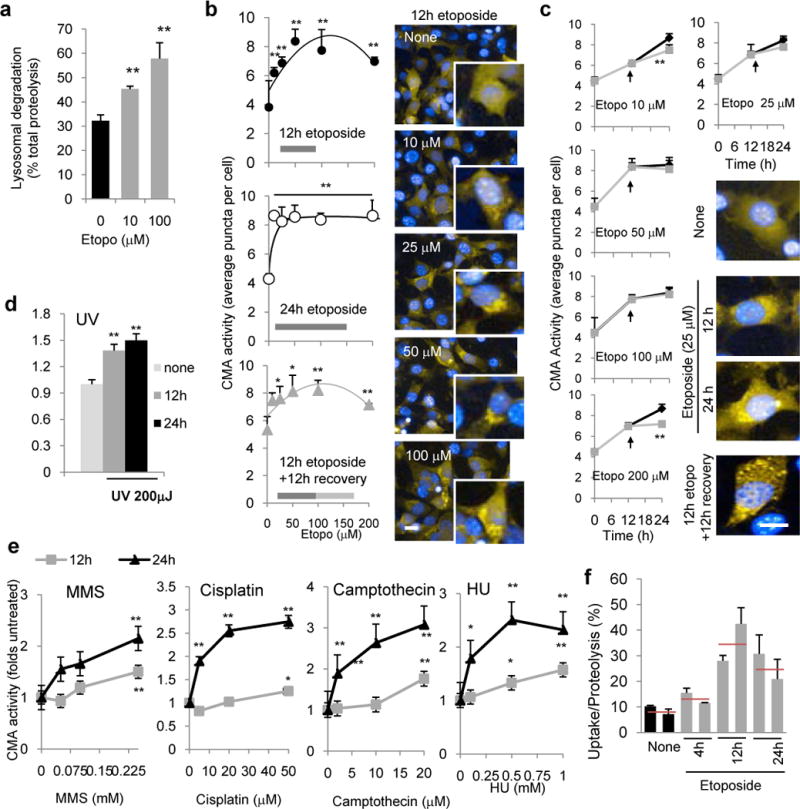
a. Lysosomal protein degradation in mouse fibroblasts treated with etoposide for 24h, n=6 wells in 3 independent experiments. b,c. CMA activity in cells expressing a photoactivatable CMA reporter and treated with increasing concentrations of etoposide for the indicated times (b) or for different times at the indicated concentrations of etoposide (c). Arrow indicates etoposide removal after 12h of treatment (grey lane) Right: Representative images of the indicated conditions. Inserts in b show higher magnification images. n=3 independent experiments, >200 cells/experiment were counted. d,e. CMA activity measured as in b at the indicated times after UV exposure (d) or at 12 or 24h after the indicated treatments (e). n=3 independent experiments, >200 cells/experiment. f. CMA activity against a pool of radiolabeled cytosolic proteins of lysosomes isolated from livers of mice untreated (none) or at different times after a single etoposide injection. n=3 independent experiments and the means of two animals per group are shown with average value (red line). All values are mean+s.e.m except panel F that are mean and range. (unpaired two-tailed t-test). *P<0.005 or ***P<0.0005. Scale bar: 10μm.
Upregulation of CMA activity in response to etoposide coincided with an increase in LAMP-2A levels, both at the protein (Fig. 3a) and mRNA levels (Fig. 3b, the pro-oxidant paraquat, a well-characterized activator of CMA21 is shown as positive control). Under our experimental conditions, this increase was not observed for LAMP1 or LAMP2B, upon exposure to etoposide or γ-radiation (Supplementary Fig. 4c). Furthermore, genetic and chemical enhancements of CMA activity were protective against etoposide. Overexpression of LAMP-2A, shown to enhance CMA activity in cultured cells13, reduced the percentage of cells with γH2AX foci after exposure to etoposide (Fig. 3c,d), whereas overexpression of LAMP-2B at similar levels did not resulted in noticeable reduction in γH2AX foci (Supplementary Fig. 2d). Likewise, treatment of cultured cells with AR7, a novel retinoic acid derivative that selectively activates CMA22, significantly improved cellular viability upon etoposide treatment (Fig. 3f) and reduced DNA damage (Fig. 3g). Overall, our findings demonstrate that CMA is upregulated as part of the cellular response to DNA damage and that increased CMA activity is effective in reducing DNA damage.
Figure 3. Activation of CMA protects against double strand DNA damage.
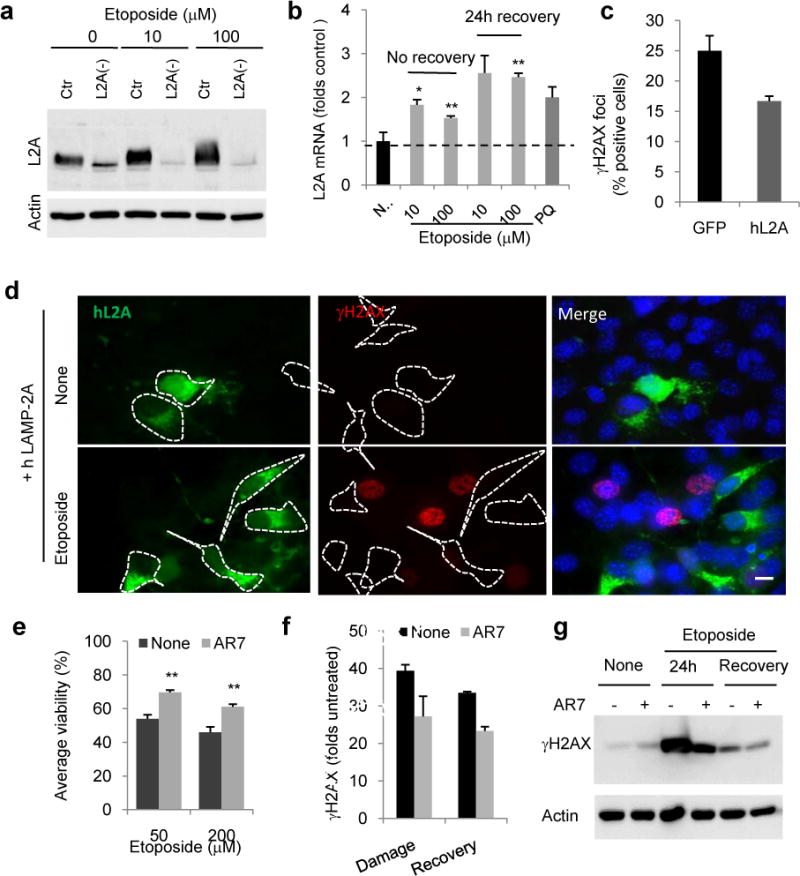
a. Representative immunoblot for LAMP-2A in mouse fibroblasts control (Ctr) or knock-down for LAMP-2A (L2A(−)) after 24h of treatment with etoposide. b. L2A mRNA levels cells treated with etoposide for 24h and 24h after treatment. Paraquat (PQ) is shown as positive control, n=3 wells from 3 independent experiment. c,b. Immunofluorescence for γH2AX in Ctr cells transfected with GFP or GFP-hL2A and exposed to etoposide for 24h. n = 3 independent experiments where the number of total cells counted per experimental condition were more than 100 (>5 fields, average 20 cells/field) (c) and representative images in single and merged channels images (d). Dashed lines: Cell profiles. e–g. Viability (e) and γH2AX levels (f,g) of cells pretreated or not with the CMA activator AR7 after 24h of etoposide treatment (damage) or 24h after removing the drug (recovery), n=3 independent experiments. All values are mean+s.e.m. (unpaired two-tailed t-test). *P<0.05 or **P<0.005. Scale bar: 10μm. Full gels are shown in Supplementary Fig. 8.
Chk1 accumulates in cells with defective CMA
To determine whether higher levels of DNA DSBs in cells defective in CMA were due to increased DNA damage or delayed repair, we performed a time-course analysis post 24h etoposide treatment. While γH2AX levels gradually decreased in Ctrl cells as a result of DNA repair, the decrease in L2A(−) cells was markedly slowed down (Fig. 4a). A similar longer persistence of γH2AX was observed after γ-irradiation Supplementary Fig. 1d). These results suggest that the higher content of DNA DSBs in cells defective in CMA was due for the most part, to inefficient DNA repair.
Figure 4. CMA blockage leads to inefficient DNA repair and alterations in cell cycle check point.
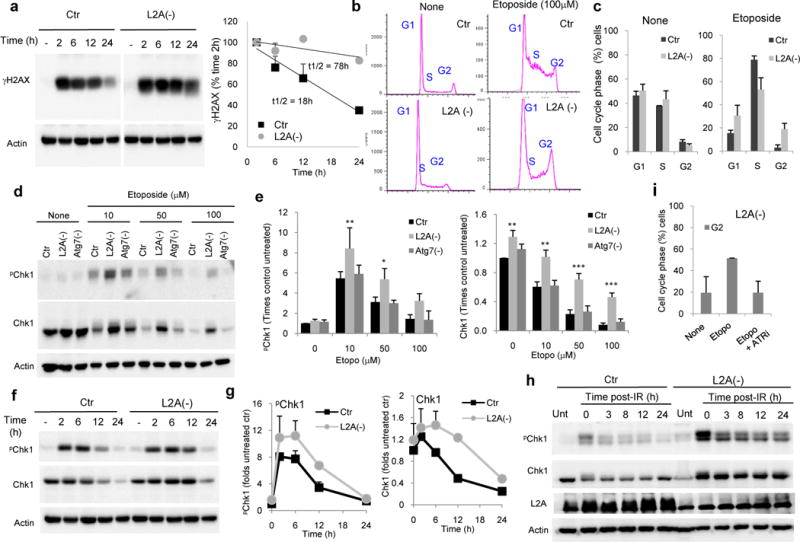
a. Representative immunoblot for γH2AX in mouse fibroblasts control (Ctr) or knock-down for LAMP-2A (L2A(−)) untreated (−) or at the indicated times after treatment with etoposide. Right: Decay of γH2AX in both groups of cells. Half-lives are indicated, n=3 wells in 2 independent experiments. Values are average and range. b. Representative FACS analysis profile of the same cells after propidium iodine labeling. c. Cell cycle distribution of the cells subjected to FACS. Values are average and range of two different experiments. d,e. Levels of Chk1 proteins in the same cells and in cells knock-down for Atg7 (Atg7(−)). Representative immunoblot (d) and quantification of levels of pChk1 (S345) and total Chk1 (e), n=4 independent experiments. f,g. Immunoblot of the same cells untreated (−) or at the indicated times of etoposide treatment (f) and quantification of levels of pChk1 (S345) and total Chk1 (g), n=2 independent experiments. Values are average and range. h, Representative immunoblots for Chk1 at different times after exposure to 50Gy γ-irradiation in the indicated cell types. The experiments were repeated 2 times. i. Cell cycle distribution of Ctr and L2A(−) cells untreated (None) or treated with etoposide for 24h in presence or absence of ATR inhibitors. The experiments were repeated 2 times. All values are mean+s.e.m. (unpaired two-tailed t-test). *P<0.05, **P <0.005 or ***P <0.0005. Full gels are shown in Supplementary Fig. 8.
We next analyzed cell cycle progression to determine if deficient DNA repair in CMA-incompetent cells was due to failure in the cell cycle arrest that normally allows time for DNA repair. On the contrary, we found that, after the first mitotic division where most of the etoposide damage occurs, a higher percentage of L2A(−) cells were arrested in G2 when compared to Ctr cells (Fig. 4b, c). In agreement with this arrest, levels of phosphorylated and total Chk1, one of the best characterized gatekeepers of the G2/M phase23, were significantly higher in L2A(−) cells 12h after exposure to different concentrations of etoposide when compared to Ctr or Atg7(−) cells (Fig. 4d,e). Furthermore, the gradual decrease with time in levels of pChk1 and Chk1 observed in Ctr cells after the etoposide treatment was markedly delayed in L2A(−) cells (Fig. 4f,g). Total and pChk1 levels also persisted elevated in these cells upon genotoxicity induced by different degrees of γ-irradiation but not in Atg7(−) cells (defective in macroautophagy) (Fig. 4h, Supplementary 4d). The arrest of L2A(−) cells in G2 after the DNA damage could be overcome by inhibiting phosphorylation of Chk1 by the ATR kinase (Fig. 4i), supporting that the higher levels of activated Chk1 were the main responsible for the altered cell cycle progression in in L2A(−) cells.
Immunoblot in nuclear fractions (Fig. 5a) and immunofluorescence for Chk1 (Fig. 5b) and pChk1 (Fig. 5c) confirmed that a higher portion of cellular Chk1 was retained in the nucleus of L2A(−) cells treated with etoposide and that this nuclear Chk1 was phosphorylated. Similar experiments in Chk1 knock-down cells confirmed the specificity of the Chk1 staining (Fig. 5d).
Figure 5. CMA blockage alters Chk1 dynamics.
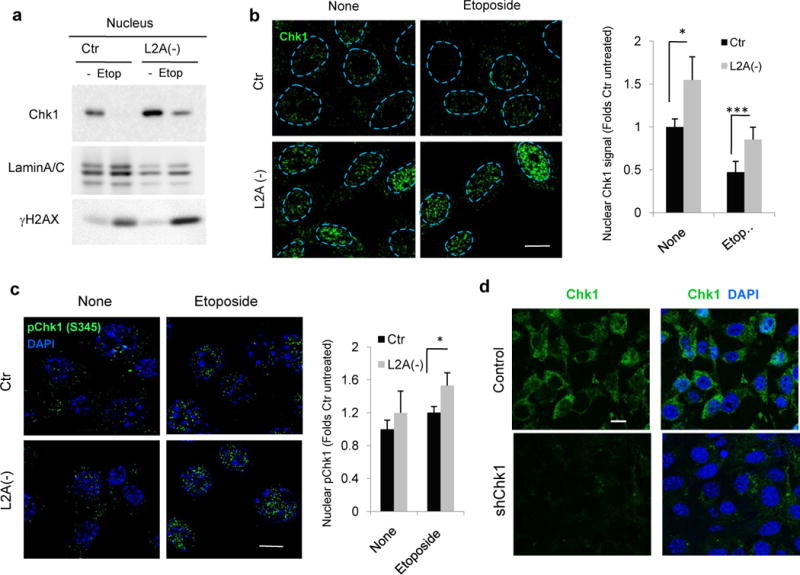
a,b. Immunoblot of nuclear fractions (a) and immunofluorescence of Chk1 (b) in the same cells 12h after treatment with 100μM etoposide. Dashed lines: nuclear profiles. Scale bar: 10μm. Right: Quantification of the percentage of cells with nuclear Chk1 signal, n>40 cells counted from three different experiments. c. Immunofluorescence for pChk1 in the same cells after 12h treatment with 100μM etoposide. Right: Quantification of the percentage of nuclear pChk1 in >25 cells/condition and experiment (n=4 independent experiments). Nuclei were highlighted with DAPI. d. Immunofluorescence for Chk1 in cells control and knock-down for Chk1 (shChk1). Single channel and merge with DAPI are shown. All values are mean+s.e.m. (unpaired two-tailed t-test). *P<0.05, **P <0.005 or ***P <0.0005. Scale bar: 10μm Full gels are shown in Supplementary Fig. 8.
Chk1 undergoes lysosomal degradation by CMA
Accumulation of both pChk1 and Chk1 in L2A(−) cells led us to investigate the possible contribution of CMA to Chk1 degradation. Inhibition of lysosomal proteolysis by treatment with ammonium chloride and leupeptin led to a marked increase in levels of phosphorylated Chk1 comparable to the one observed upon proteasome inhibition, already described to contribute to Chk1 degradation17 (Fig. 6a; positive controls of the efficiency of the inhibitors are shown in Supplementary Fig. 5a,b (for p62 and LC3-II (lysosomal substrates) and K48-Ubiquitinated proteins (proteasome substrates)). In contrast, inhibition of macroautophagy with 3-methyladenine did not have an effect on intracellular levels of Chk1, suggesting that a fraction of cellular Chk1 is normally degraded in lysosomes even in the absence of genotoxic stress, but not via macroautophagy (Fig. 6a; Supplementary Fig. 5c,d shows a positive control of the efficiency of 3-methyladenine to inhibit the autophagic flux in cells expressing the mCherry-GFP-LC3 reporter). Immunofluorescence in fibroblasts revealed Chk1 association with lysosomal/endosomal compartments (positive for LAMP1) (Fig. 6b). We confirmed a similar association in vivo upon isolation from mouse liver of two populations of lysosomes that participate in CMA (CMA+, enriched in lysosomal hsc70) or in macroautophagy (CMA−, deficient in hsc70)24. Chk1 demonstrated preferential association of Chk1 with CMA-active-lysosomes from mouse and rat liver (Fig. 6c and Supplementary Fig. 6a). Blockage of lysosomal proteolysis by intraperitoneal injection of mice with leupeptin increased Chk1 levels in CMA-active lysosomes confirming its degradation in this compartment in vivo (Fig. 6c; glyceraldehyde-3-phosphate dehydrogenase (GAPDH), a well-characterized CMA substrate25 is shown as positive control). Lastly, in further support of Chk1 degradation by CMA, we also found that a fraction of cellular Chk1 interacts with hsc70, the chaperone responsible for lysosomal targeting of CMA substrates12, and that the net amount of hsc70-bound Chk1 increased in L2A(−) cells, a feature common to bona fide CMA substrate proteins (Fig. 6d).
Figure 6. Chk1 undergoes lysosomal degradation.
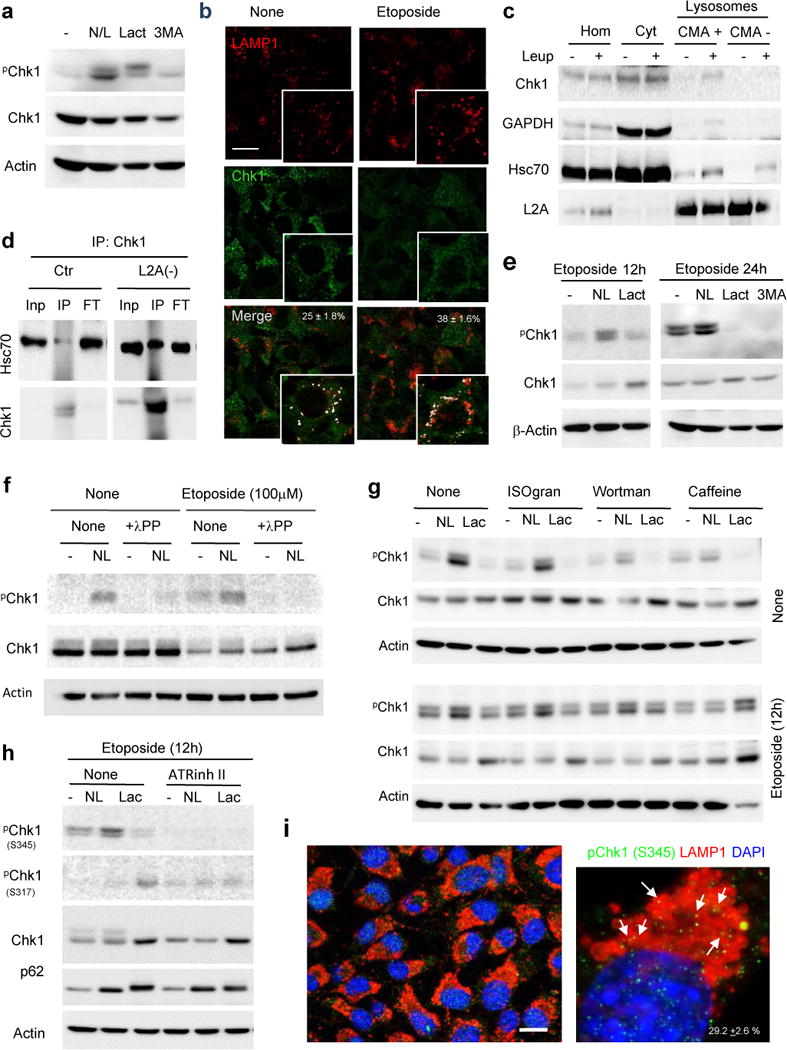
a. Immunoblot in mouse fibroblasts untreated (−) or treated with NH4Cl and leupeptin (N/L), lactacystin (Lact) or 3-methyladenine (3MA). b. Immunofluorescence for LAMP1 and Chk1 in mouse fibroblasts treated or not with etoposide. Inset in merged show co-localization as white pixels. Percentage of co-localization is indicated, n>80 cells counted per condition in two independent experiments. c. Representative immunoblot of homogenates (Hom), cytosol (Cyt) and lysosomes with high (CMA+) and low (CMA−) CMA activity from livers of mice untreated (−) or injected with leupeptin (Leup). d. Co-immunoprecipitation (IP) of hsc70 with Chk1 in fibroblasts control (Ctr) or knock-down for LAMP-2A (L2A(−)). Inp: 1/10 input; FT: flow through. e–h, Immunoblot of fibroblasts treated or not with etoposide in the presence of the indicated protease and kinase inhibitors. The residues recognized by the two anti-pChk1 antibodies are indicated (h). Isogranulatimide (ISOgram), Wortmaninin (Wortman) and ATR inhibitor II (ATRinh II). In f, samples were dephosphorylated with λ protein phosphatase (λ PP) before electrophoresis. i. Immunofluorescence for pChk1 and LAMP1 in Ctr cells. Full field (left) and high magnification (right). Arrows: co-localization. Percentage of co-localization is indicated, n>80 cells in two independent experiments. The experiments in a,e,f,g and h were repeated 5 times and in c and d 3 times. Scale bar: 10μm. Full gels are shown in Supplementary Fig. 8.
During etoposide treatment, co-localization of Chk1 with lysosomes increased (Fig. 6b) and lysosomal degradation of pChk1 become predominant over proteasome degradation (Fig. 6e). This behavior seemed specific for Chk1 as changes in Chk2 levels were not noticeable under the same conditions (Supplementary Fig. 6b). Phosphatase treatment of the collected samples before electrophoresis confirmed that the Chk1 accumulating upon lysosomal inhibition was indeed phosphorylated Chk1, and that once the phosphate groups were removed, it was possible to see an increase in total Chk1 levels upon lysosomal inhibition (Fig. 6f). Since Chk1 can be phosphorylated by different kinases and also undergoes autophosphorylation, we compared the effect of isogranulatimide, wortmannin and caffeine that inhibit Chk1, ATM and ATM/ATR, respectively26. Inhibition of ATM and ATR, but not of Chk1, markedly reduced the fraction of pChk1 normally degraded in lysosomes (Fig. 6g). However after etoposide treatment, only caffeine was capable of inhibiting pChk1 lysosomal degradation, suggesting that phosphorylation of Chk1 by ATR may be a determinant for its lysosomal degradation under these conditions (Fig. 6g). Using phospho-Chk1 antibodies, we found that lysosome inhibition caused mostly accumulation of S345 pChk1 without affecting S317 pChk1, which seems to be the preferred substrate of the previously described proteasome-dependent degradation of Chk117 (Fig. 6h). Immunostaining with this phospho-antibody also demonstrated the presence of pChk1 in lysosomes (Fig. 6i) and confirmed that inhibition of the ATR kinase completely eliminated the signal of the Chk1 protein susceptible to lysosomal degradation (Fig. 6h).
We found that although a fraction of cytosolic Chk1 undergoes degradation in lysosomes in basal conditions, most of the Chk1 degraded in this compartment after etoposide treatment originates from the nucleus, since treatment with the nuclear export blocker leptomycin B significantly reduced lysosomal Chk1 levels and eliminated the etoposide-induced increase in Chk1 lysosomal delivery (Fig. 7a and Supplementary Fig. 7). In agreement with a nuclear origin of lysosomal Chk1, blockage of CMA led to increased nuclear content of Chk1 (Fig. 5a and b) and leptomycin B failed to further increase nuclear levels of Chk1 in these cells (Fig. 7b), indicating that their higher nuclear Chk1 content was due mostly to its reduced export rather than to increased import.
Figure 7. Chk1 is a bona fide CMA substrate.
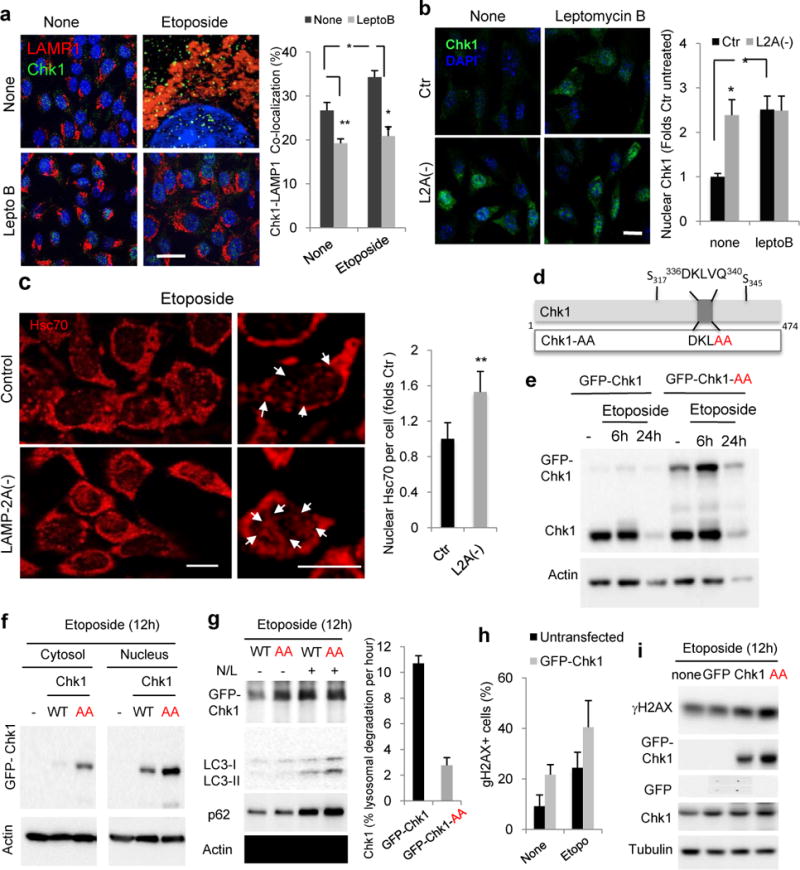
a. Immunofluorescence for Chk1 and LAMP1 in Ctr cells untreated (none) or treated with etoposide for 6h in presence or not of 20nM leptomycin B. Full fields shown in Fig. S8. Right: Percentage of colocalization in >50 cells/condition Scale bar: 5μm. (n=3 independent experiments). b. Immunofluorescence for pChk1 in control (Ctr) and LAMP-2A knock-down cells L2A(−) treated as in a. Scale bar: 10μm. Right: Percentage of nuclear pChk1 in >25 cells/condition (n=4 independent experiments). c. Immunofluorescence for hsc70 in the same cells treated with 100μM etoposide for 12h. Left: representative images. Insets: higher magnification images. Arrows: nuclear hsc70. Scale bar: 10μm. Right: Average hsc70 nuclear signal per cell in >50 cells/condition (n=3 independent experiments). d. Scheme of Chk1 CMA-targeting motif (top) and mutagenesis performed to disrupt it (bottom). e–g. Immunoblot of cell extracts (e, g) or cytosol and nuclear fractions (f) from cells expressing wild-type (GFP-Chk1) or mutant (GFP-Chk1-AA) Chk1 after the indicated treatments. N/L: ammonium chloride and leupeptin. Right in g: Percentage of Chk1 degradation per hour. n=2 independent experiments. Values are average and range. h,i. Percentage of cells with nuclear γH2AX foci (h) or levels of γH2AX (i) in mouse fibroblasts untransfected or transfected as indicated and treated with 100 μM Etoposide, n >100 cells in >5 fields from n = 3 independent experiments. All values are mean+s.e.m. (ANOVA plus Bonferroni for a and b and unpaired two-tailed t-test for the rest) *P<0.05, **P <0.005 or ***P <0.0005. Full gels are shown in Supplementary Fig. 8.
We found that etoposide treatment also increased the nuclear content of hsc70 (Fig. 7c), the chaperone that targets CMA substrates to lysosomes and that has been previously documented to undergo nuclear translocation in response to other stressors such as oxidative stress27. Interestingly, levels of this chaperone were significantly higher in the nucleus of L2A(−) cells (Fig. 7c). To determine if interaction of Chk1 with hsc70 was required for its nuclear export and lysosomal targeting, we mutated the residues 339VQ340 in Chk1 to alanine (Chk1-AA) which disrupts the putative hsc70 binding site (336DKLVQ340) identified in the Chk1 sequence11 (Fig. 7d). Transient transfection with equal amounts of DNA for both GFP-Chk1 and GFP-Chk1-AA revealed higher stability (lower kinetics of decay) for the CMA-incompetent Chk1 (Fig. 7e) and cellular fractionation confirmed higher net amounts of GFP-Chk1-AA both in the cytosol and in the nucleus post-etoposide treatment (Fig. 7f), supporting that the inability to interact with hsc70 reduced Chk1 nuclear export and subsequent lysosomal degradation. Accordingly, treatment of the transfected cells with ammonium chloride and leupeptin to inhibit lysosomal proteolysis increased levels of GFP-Chk1, whereas levels of GFP-Chk1-AA remained unchanged, in further support of defective lysosomal degradation of the mutant protein (Fig. 7g).
Furthermore, we found that the nuclear persistence of Chk1 is behind the higher toxic effect of genotoxic insults in cells with compromised CMA. Overexpression of Chk1 in control cells was sufficient to increase the etoposide-induced DNA DSBs (Fig. 7h) and overexpression of the CMA-incompetent form of Chk1 that persisted at higher levels in the nucleus lead to even more pronounced accumulation of DNA damage (Fig. 7i).
CMA blockage leads to instability of the MRN complex
To understand the mechanism by which nuclear accumulation of Chk1 upon CMA blockage leads to the higher DNA damage (Fig. 1) and delayed DSB repair (Fig. 4) observed in L2A(−) cells, we analyzed possible changes in the protein components involved in the early steps of the DSB repair pathway, in particular, the MRN (Mre11-Rad50-Nbs1) complex, which binds to DSB prior to DNA repair by recombination and signals to the cell cycle checkpoints. Etoposide exposure led to a dose-dependent reduction in the levels of Mre11, Rad50, and Nbs1 in L2A(−) cells as compared to Ctr cells (Fig. 8a), that inversely correlated with the increase in the levels of Chk1 and DNA DSBs (Fig. 8b). Blockage of macroautophagy did not significantly change the levels of these proteins (Fig. 8a). Time course analysis after etoposide exposure also revealed differences in the apparent molecular weight of MRN proteins in L2A(−) cells. Thus, etoposide induced a shift in the molecular weight of Mre11 and Nbs1 in Ctr cells (level “1” in the images) and both proteins returned to their basal molecular weight gradually with time (Fig. 8c). In contrast, in L2A(−) cells already at 2 hour post-etoposide exposure, both Mre11 and Nbs1 were shifted to a higher level of phosphorylation (level “2”) (Fig. 8c) that was not visible upon blockage of macroautophagy (Fig. 8d). Exposure of L2A(−) to a different genotoxic agent, γ-irradiation, resulted in similar changes in levels and molecular weight of MRN proteins (Mre11 shown in Fig. 8e).
Figure 8. Blockage of CMA leads to instability of the MRN DNA repair complex.
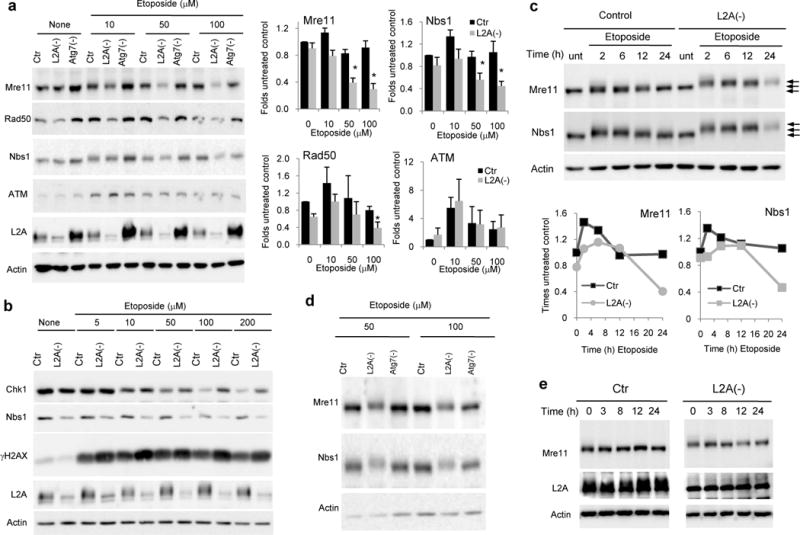
a,b. Representative immunoblots of cells control (Ctr) or knock-down for L2A (L2A−) or Atg7 (Atg7−) untreated (none) or treated with the indicated concentrations of etoposide for 12h. LAMP-2A (L-2A) is shown as control for knock-down. Right: Changes in levels of the indicated proteins calculated by immunoblot densitometry, n=4 independent experiments. c. Representative immunoblot of Ctr and L2A− cells untreated (unt) or treated with 100μM for the indicated times. Arrows: levels of shift in the protein molecular weight. Bottom: Changes in levels of the indicated proteins calculated by immunoblot densitometry, n= 2 independent experiments. d. Immunoblot for MRN complex proteins after extended electrophoretic run in Ctr, L2A(−) or cells knockdown for Atg7(Atg7(−)) treated as in b with etoposide for 12h. e. Immunoblot for Mre11 in the same cells at the indicated times after exposure to γ-irradiation. All values are mean+s.e.m except panel c that are average and range. (unpaired two-tailed t-test). *P <0.005. Full gels are shown in Supplementary Fig. 8.
The increase in molecular weight of Mre11 and Nbs1 in L2A(−) cells is likely due to enhanced phosphorylation, as phosphatase treatment of the samples prior to electrophoresis eliminated the difference (Fig. 9a). This etoposide-induced hyperphosphorylation of Mre11 and Nbs1 in L2A(−) cells was prevented using caffeine or an ATR specific inhibitor but not ATM or Chk1 inhibitors (Fig. 9b, c), suggesting a possible disruption of the Chk1-ATR regulatory circuit upon CMA blockage that results in abnormal ATR-dependent phosphorylation of MRN proteins.
Figure 9. Changes in the MRN complex components in cells with compromised CMA.
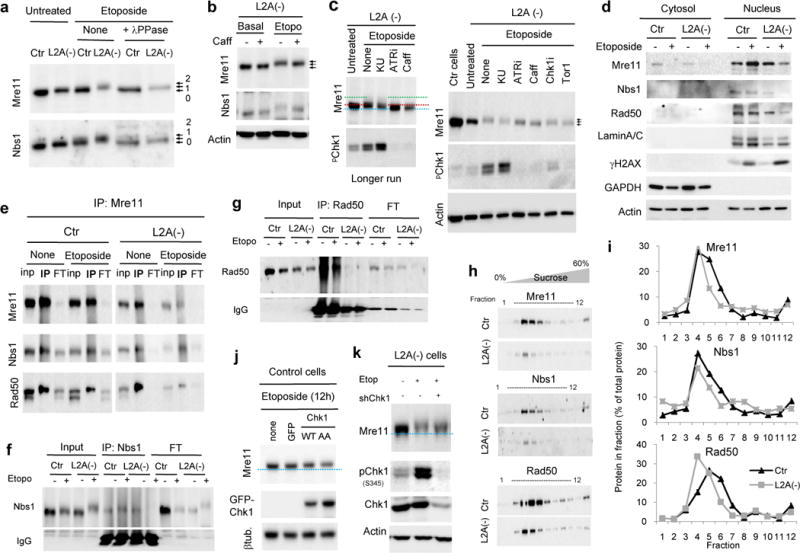
a. Immunoblot for Mre11 and Nbs1 in cells control (Ctr) or knock-down for L2A (L2A−) untreated (unt) or treated with 100μM for 12h and including samples treated with λ protein phosphatase (λ PPase) before electrophoresis. Arrows: levels of shift in the protein molecular weight. b. Immunoblot for L2A(−) cells treated with etoposide and caffeine as indicated. c. Immunoblot for Mre11 and phosphorylated Chk1 (S345: pChk1) in L2A(−) cells treated with 100μM etoposide for 12h without additions (none) or in the presence of the indicated kinase inhibitors (KU: ATM inhibitor KU55933; ATRi: ATR inhibitor II; Caff: caffeine; Chk1i: Chk1 inhibitor; Tor1: mTor inhibitor Torin 1. Untreated L2A(−) and Ctr cells are shown for reference. Left: Image of a similar experiment resolved by a longer electrophoresis run to appreciate the molecular weight shift of Mre1. Discontinued lines indicate center of untreated (blue) or etoposide treated (red) bands the highest molecular weight Mre11 signal (green). d. Immunoblot for the indicated proteins in cytosolic and nuclear fractions in Ctr and L2A(−) cells untreated or etoposide-treated (24h). Lamin A/C and GAPDH are shown as markers for nuclear and cytosolic fraction purity, respectively. e–g. Immunoprecipitation (IP) of Mre11 (e), Nbs1 (f) or Rad50 (g) in cellular extracts from Ctr or L2A(−) cells untreated (None) or treated with etoposide for 24h. Inp, input; FT, flow-through. h,i. Nuclear fractions from etoposide-treated Ctr and L2A(−) cells treated with etoposide were subjected to continuous sucrose density gradients. Representative immunoblots (h) and plots of the distribution of proteins along the gradient (i). j, k. Immunoblots in cells Ctr expressing the indicated Chk1 variants (j) or L2A(−) cells upon Chk1 knock-down (shChk1) (k). The experiments in a–d were repeated 4 times and in e–j 3 times. All values are mean+s.e.m. (unpaired two-tailed t-test). *P <0.005. Full gels are shown in Supplementary Fig. 8.
Changes in the phosphorylation status of the MRN complex did not disrupt their nuclear localization, since MRN proteins in L2A(−) cells were still detected mostly in the nucleus, albeit at lower levels (Fig. 9d). Co-immunoprecipitation assays to examine possible changes in the assembly of MRN proteins upon CMA blockage that could explain their lower stability revealed that, Nbs1 and Rad50 were still detected in pull-downs of Mre11 in etoposide-treated L2A(−) cells (Fig. 9e). However, we could not confirm interaction between Nbs1 and Rad50, as the antibodies that efficiently immunoprecipitate both proteins in Ctr cells failed to do so in L2A(−) cells (Fig. 9f,g). It is likely that conformational changes in Nbs1 and Rad50 (probably related to their phosphorylation state) masked the epitopes recognized by the antibody. As an alternative approach to evaluate the organization of the MRN complex, we subjected nuclear fractions of control and L2A(−) cells to continuous sucrose density centrifugation. Besides the reduced abundance of MRN complexes, we found that even when corrected for the total amount of protein, the three proteins displayed lower migration into the gradient in the L2A(−) extracts (shift toward the left) (Fig. 9h,i). These results are compatible with formation of a smaller protein complex or the presence of partially assembled MRN complex in cells defective for CMA.
Lastly, we explored if these abnormalities in the MRN complex observed in CMA-incompetent cells were related to the nuclear retention of Chk1 in these cells upon etoposide treatment, which we demonstrated was sufficient to elicit higher susceptibility to the genotoxic insult (Fig. 7h) and to increase the DNA damage load (Fig. 7i). Overexpression in Ctr cells of Chk1, and more so, of the CMA-incompetent Chk1-AA mutant lead to reduced Mre11 levels and a shift in its molecular weight comparable to the one observed in CMA-incompetent cells (Fig. 9j). Conversely, upon partial knock-down of Chk1 in L2A(−) cells to reduce levels of this protein close to those in Ctr cells, we observed a partial restoration of Mre11 levels and correction of its molecular weight shift (Fig. 9k), much like the one observed upon ATR inhibition (Fig. 9b,c). These findings support that the enhanced levels of Chk1 in cells with defective CMA are, at least in part, responsible for the abnormalities in the MRN complex observed in these cells.
In summary, we have found that regulated degradation of Chk1 by CMA in response to DNA damage is required to ensure cell cycle progression and that failure to efficiently eliminate Chk1 by this pathway leads to persistent cell arrest, accumulation of DNA damage and alterations in nuclear proteostasis, such as the destabilization of the MRN complex identified in this study (Fig. 10).
Fig. 10. CMA malfunction results in genome instability.
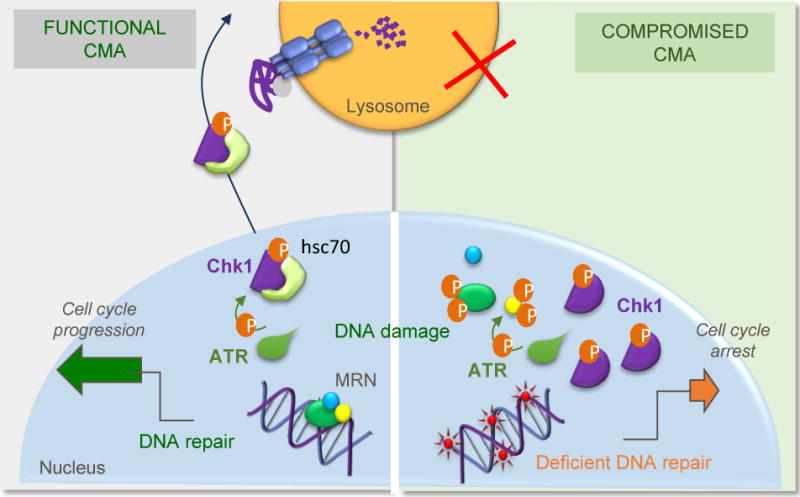
CMA is upregulated in response to different genotoxic insults to assure timely release of cell cycle arrest after DNA repair, through the selective degradation of nuclear pChk1. When CMA activity is compromised, abnormally high levels of pChk1 persist in the nucleus leading to accumulation of DNA damage and to aberrant hyperphosphorylation of several components of the MRN complex and their subsequent destabilization. These and other alterations in nuclear proteostasis consequence of CMA malfunction could be behind the defective DNA maintenance and repair observed under these conditions.
Discussion
In this work, we have uncovered a novel role for CMA as part of the cellular response to genotoxic insults. CMA participates in the timely degradation of phosphorylated nuclear Chk1 after DNA repair and failure to do that leads to persistence of activated pChk1 in the nucleus, and increased genomic instability. This may result in part from defects in stability and/or function of the MRN complex and likely additional proteins involved in DNA repair pathways that are pending identification (Fig. 10). In fact, we have noticed by sequence analysis the presence of CMA targeting motifs in many additional proteins involved in DNA repair pathways.
Upon DNA damage, Chk1 delays cell cycle progression to allow time for DNA repair, but after completion of repair, release of the cell cycle arrest is necessary. Phosphorylation by the ATR kinase is one of the best-characterized mechanisms of Chk1 activation28. However, once ATR phosphorylation has occurred, elimination of the activated Chk1 by degradation is probably the most efficient way to limit Chk1 activity, and in fact the same phosphorylation that activates Chk1 has been shown to mark it for degradation17. Elimination of activated Chk1 by the proteasome has been described during the first 8h of DNA damage induced by topoisomerase I inhibitors, but not when the damage was induced with inhibitors of topoisomerase II such as etoposide17. We have found that following etoposide treatment, pChk1 is largely degraded by CMA and that this degradation is impaired by the inhibition of ATR signaling. We hypothesize that this is due to direct modification of S345 by ATR, consistent with our experimental results (Fig 5h). We observed similar CMA-dependent degradation of Chk1 upon γ-irradation-induced DNA damage and CMA upregulation and enhanced sensitivity of CMA-incompetent cells toward a broad range of genotoxic insults. We propose that the relevance of CMA-dependent degradation of Chk1 resides not as much in the amount of Chk1 degraded by this pathway as in the selectivity (only a specific phosphorylated form of Chk1) and timing (after DNA repair is attained) in which this degradation occurs. However, it is possible that the relative contribution of these two proteolytic systems, proteasome and CMA, to the regulation of Chk1 levels is cell- and stimuli-dependent, or that both systems act in a coordinate sequential manner. Interestingly, CMA degradation of pChk1 also occurs to some extent, in the absence of etoposide treatment, suggesting a possible role of this pathway in genome maintenance in response to endogenous DNA damage. The fact that constitutive activation of Chk1 in absence of DNA damage has been shown recently to compromise cell viability28 emphasizes the importance of this basal CMA degradation of activated Chk1.
Chk1 is the first nuclear protein described to undergo degradation by CMA. Until now, CMA substrates were all located in the cytosol where recognition by hsc70 occurs. A surprising finding, however, was the fact that blockage of CMA did not lead to accumulation of Chk1 in the cytosol but that instead chaperone and substrate remained in the nucleus. This situation resembles the case of degradation of proteins from the endoplasmic reticulum in the cytosol, where translocation and degradation are tightly coordinated and the first only occurs when degradation is feasible. How the nucleus senses the functional status of CMA requires future investigation but it is likely that chaperones play a role in this communication. The presence of hsc70 in the nucleus upon etoposide treatment and the higher nuclear levels of this chaperone in CMA-deficient cells make us propose that nuclear hsc70 may target pChk1 from the nucleus to lysosomes. The fact that disruption of the CMA targeting motif in Chk1 by mutagenesis also led to its nuclear accumulation further supports the involvement of hsc70 in lysosomal targeting of nuclear Chk1. However, future experiments to provide direct evidence that these mutations prevent interaction of Chk1 with hsc70 in the nucleus should strengthen this new proposed role of hsc70 in nuclear export.
The elevated nuclear levels of activated Chk1 observed upon CMA blockage, may contribute to cellular toxicity by different mechanisms. Here we identify that the MRN DNA complex, which participates in the early steps of specific DNA repair pathways, is one of the targets of this toxicity. Conformational changes as result of post-translational modifications that alter the interaction among the MRN components and their organization into functional complexes are likely the main determinant of the dramatic reduction in stability of the MRN proteins. Although hyperphosphorylation is the most noticeable modification in these proteins, this is not mediated directly by Chk1. The persistence of elevated levels of pChk1 in the nucleus may disrupt the dynamics of normal ATR-Chk1 signaling pathways, likely affecting the function of the MRN complex and potentially other proteins involved in cell cycle regulation and DNA repair. Although we show that direct manipulation of levels of Chk1 is sufficient to reproduce the changes in the MRN, it is possible that once this repair mechanism has been compromised in the CMA incompetent cells, nuclear levels of Chk1 further increase reactive to the accumulating DNA damage.
The new connection between CMA activity and genome maintenance adds genomic instability to the cellular consequences of failure of this degradative pathway, such as the one observed during aging and in age-related disorders16.
Methods
Animals, cells and treatments
Adult male Wistar rats about 60 days old (Charles River Laboratories) and three month-old C57BL/6 male mice (Jackson Laboratories) were used for isolation of lysosomes from liver. Where indicated, rodents were starved for 48h and injected intraperitoneally with etoposide (50mg per kg body weight, Sigma)29 dissolved in 0.9% sterile saline or leupeptin (2mg per 100g body weight, Sigma), whereas control animals were injected with saline only. All animal work was performed in accordance with the established institutional protocols from the Institutional Animal Care and Use Committees at the Albert Einstein College of Medicine. Human cancer cell lines (A549, H460), and mouse fibroblasts (NIH3T3) were purchased from American Type Culture Collection (Manassas, VA). All cells were cultured in a 37°C incubator with 5% CO2 in either RPMI supplemented with 10% heat-inactivated fetal bovine serum (human cells) or DMEM medium (GIBCO) supplemented with 10% newborn calf serum (mouse cells) and with penicillin/streptomycin/fungizone (Invitrogen). Before DNA damage treatments, cells were grown to confluence and arrested by contact inhibition. After releasing cells into fresh media, cells were treated with the indicated concentrations (10–100μM) of Etoposide (Sigma). Where indicated, the inhibitors of lysosomal proteolysis ammonium chloride (20mM, Sigma) and leupeptin (100μM, Fisher), the proteasome inhibitor lactacystin (5μM, Enzo Life Sciences) or the macroautophagy inhibitor 3-methyladenine (20mM, Sigma) were added directly to the culture media for a 24h period, unless indicated otherwise. Where indicated, cells were treated with leptomycin B (20nM final concentration, LC labs) with or without etoposide in the media for 6h. The sources and concentrations used for the treatments with kinase inhibitors were as follows: isogranulatimide (10μM, final concentration) from Santa Cruz, caffeine (5mM, final concentration) was from Sigma, the ATM inhibitor KU55933 (10μM, final concentration) was from Tocris, wortmannin (10 μM, final concentration) and, the ATR inhibitor II (1μM, final concentration) from Calbiochem, the Chk1 inhibitor isogranulatimide (20μΜ, final concentration) from Santa Cruz and the mTOR inhibitor Torin (1μΜ, final concentration) from Tocris. Where indicated, cells were pre-treated with the kinase inhibitor 1h prior to etoposide treatment.
Antibodies, plasmids and reagents
Sources of chemicals were as previously described15,19,30. The following antibodies were used at the indicated dilutions for immunofluorescence (IF) or immunoblot (IB): antibodies against γH2AX and H2AX (1:500 (IF) and 1:1000 (IB)) were from Cell Signaling; the antibody against the cytosolic tail of L2A (1:100 (IF) and 1:5,000 (IB)) was from Invitrogen, against LAMP1 (1:100 (IF) and 1:1,000 (IB)) was from Iowa University Hybridoma Bank, against hsc70 (13D3, 1:1,000) from Novus Biotechnology, against GAPDH (1,5000) and actin (1:5,000) from Abcam, against GFP (1:100 (IF) and 1:3,000 (IB)) from Roche, against p62 (1:3,000 (IB)) from Biomol international, against pChk1S345, pChk1S317, Chk1, Chk2, Mre11, Nbs1, Rad50, ATM and ATR (1:1,000 (IB), and 1:100 (IF)) from Cell Signaling. LC3 antibody was from cell Signaling, used at 1:2,000 (IB). Lamin A/C antibody was from abcam, used at 1:3,000 (IB). The plasmid for Chk1 (peGFP-Chk1) was from Addgene and the plasmid for human L2A (pGK-hL2A) was generated in our laboratory31. Cells were transfected with cDNA constructs using Lipofectamine™ 2000 reagent (Invitrogen) according to manufacturer’s instructions. Transfection efficiency was monitorized by co-expression of a different fluorescent protein. Mutagenesis was performed using the Quikchange II Site-directed mutagenesis kit (Agilent Technologies).
Co-immunoprecipiations
Cells were lysed in co-immunoprecipitation buffer (25mM Tris (pH 7.2), 150mM NaCl, 5mM MgCl2, 0.5% NP-40, 1mM DTT, 5% glycerol and protease inhibitors). After incubation on ice for 15 min, the total cell lysate was centrifuged at 16,000g for 15min. The supernatant fractions were incubated overnight with primary antibodies as indicated and secondary antibodies and sepharose-conjugated protein A/C were added for 2 h, before collection by centrifugation and subsequent washing in co-IP buffer.
Cell viability Assay
Cells were plated in 96-well flat bottom plates (BD biosystems), in 100μl volume of media, and after the indicated treatments, cell viability was measured using the CellTiter Blue™ cell viability assay reagent (Promega) as changes in the fluorescence (excitation 540nm, emission 590nm) according to the manufacturer’s instructions. Fluorescence intensity values were normalized to values of untreated wells.
Comet Assay
Cells treated with or without etoposide were harvested by trypsinization and the comet assay was performed according to the manufacturer’s instructions (Trevigen). Briefly, 2×10⁵ cells were layered into low-melting agarose (at 37°C) in a 1:10 volume:volume ratio and immobilized onto a comet assay glass slide. Upon lysis and neutral electrophoresis (25V for 30 min), slides were dried and fixed in 70% ethanol (30 min at room temperature). After staining with SYBR green reagent (1:30,000 dilution for 20 min at room temperature) slides were imaged under a fluorescence microscope.
Immunofluorescence microscopy and image analysis
Cells grown on coverslips were fixed in 4% paraformaldehyde at room temperature, permeabilized and blocked with 1% BSA/0.01% Triton X-100 in phosphate buffer saline (PBS). Antibody incubations were performed for 1h at room temperature or at 4°C overnight in 0.1% BSA in PBS. Secondary antibodies conjugated to Alexa Fluor 488, Cy5, or TexasRed (1:500) (Jackson Immunologicals) were added for 1h and after washing, coverslips were mounted in DAPI-Fluoromount-G solution (Southern biotechnology). Images were acquired using an Axiovert 200 fluorescence microscope (Carl Zeiss Ltd) with a ×63 objective and red (ex. 570/30 nm, em. 615/30 nm), cyan (ex. 365/50 nm and em. 530/45 nm) and green (ex. 475/40 nm and em. 535/45 nm) filter sets (Chroma) and 1.4 numerical aperture, mounted with an ApoTome.2 slider. All images were acquired with a high-resolution CCD camera (apotome). Image quantification was done using the Image J software version 1.48d (NIH), and where indicated, co-localization analysis was done using the JaCoP plugin.
Measurement of CMA activity
Cultured cells
CMA activity in mouse fibroblasts in culture was measured using a new version of a previously developed photoswitchable (PS) CMA fluorescent reporter20 generated by addition of a CMA targeting motif to the PS-dendra protein (KFERQ-PS-dendra). Briefly, cells transduced with lentivirus carrying the reporter were photoactivated 24h after transduction by exposure to a 3.5mA (current constant), and 90V light emitting diode (LED: Norlux, 405nm) for 9 min. Cells were plated in 96 well plates, subjected to the desired treatments and at the end of the experiment fixed in 4% paraformaldehyde. Images were captured with a high content microscope (Opperetta system, Perkin Elmer) and quantification was performed with the instrument software in a minimum of 200 cells or 9 fields. Isolated lysosomes: Freshly isolated mouse liver lysosomes were incubated with a pool of 3H labeled cytosolic proteins for 20min at 37°C as described before32. At the end of the incubation, samples were acid-precipitated and filtered through a 0.22μm to separate radioactivity in the filter-retained fraction (proteins) and in the flow-through fraction (small peptides and amino acids). Proteolysis was calculated as the amount of acid precipitable radioactivity (protein) transformed to acid soluble (amino acids) during the incubation.
Intracellular protein degradation and macroautophagy
Degradation of long-lived proteins in cultured cells was measured upon 48h labeling of cells with [3H]-leucine (2mCi per ml) as described before32. Where indicated, etoposide was added during the last 24h of the labeling. Cells were then extensively washed and placed in chase medium containing excess of unlabeled leucine. Aliquots of the medium taken at different times were subjected to acid precipitation and proteolysis was calculated as described in the previous section. Lysosomal degradation was calculated as the percentage of total protein degradation sensitive to 20mM of ammonium chloride (NH4Cl) and 100μM leupeptin.
Cellular subfractionation
Lysosome isolation
Rat and mouse liver lysosomes were isolated from a light mitochondrial-lysosomal fraction in a discontinuous metrizamide density gradient modified as described before32. Cytosolic fractions were separated by centrifugation at 100,000g for 1h of the supernatant of the light mitochondria fraction. Nuclear isolation: NIH3T3 fibroblasts were seeded in 10 cm tissue culture plates in a density of 1×10⁵ cells per ml. After necessary treatments, cells were collected and resuspended in 200 mL of lysis solution 1 (5mM Na2HPO4 pH7.4, 50mM NaCl, 150mM sucrose, 5mM KCl, 2mM DTT, 1mM MgCl2, 0.5mM CaCl2, 0.1mM PMSF and 0.2% NP-40). The resulting suspension was incubated on ice for 5 min, then centrifuged for 10 min at 1000g at 4°C. The supernatant was collected as cytosolic fraction, and the resulting pellet was resuspended in 100 mL of solution 1 without NP-40, and gently layered on top of solution 2 (30% sucrose, 2.5mM Tris-HCl pH7.4, 10mM NaCl) and centrifuged at 1000g for 10min at 4°C. This step was repeated twice to remove all potential cytoplasmic contaminants from the nuclear fraction. The resulting pellet was resuspended in 40 mL of solution 3 (50mM Tris-HCl pH7.4, 300 mM NaCl, Triton X-100 0.5%), and incubated on ice for 30 min. The samples were then centrifuged at 1000g for 10min at 4°C, and the resulting supernatant was collected as the nuclear fraction.
Continuous sucrose density gradient centrifugation
Isolated nuclear fractions were layered on top of a 20–60% continuous sucrose gradient (4mL total) and subjected to centrifugation at 200,000g for 16h at 4°C. Twelve 330μl fractions were collected and subjected to precipitation in acid (20% TCA) by incubation on ice for 30min followed by centrifugation at 16,000g for 15min at 4°C. The resulting pellet was washed once with acetone, and resuspended directly in Laemmli sample buffer for subsequent electrophoresis.
Cell cycle analysis
Cells (3×10⁶) were harvested by trypsinization, pelleted and resuspended in PBS and fixed using ice cold 70% ethanol at 4°C for 1h. Pelleted cells were then washed with PBS, and incubated in RNaseA (100 mg per ml) in PBS at 37°C for 30min. Propidium iodide (50μg per ml, Sigma) was added for 15 min at room temperature and cells were then analyzed by FACS.
Quantification of mRNA
Total RNA was extracted from fibroblasts using the RNeasy Protect Mini Kit (Qiagen) following the manufacturer’s instructions and stored at −80°C until use. The first strand cDNA was synthesized from 0.5μg of the total RNA with the SuperScript II RNase H Reverse Transcriptase (Invitrogen) and oligo-(dT)12–18 primers. Actin and a region of the exon 8 of LAMP-2A, were amplified with the following primers for the forward and reverse reactions: LAMP-2A, Fwd 5′-AGGTGCTTTCTGTGT CTAGAGC GT-3′ and 5′-AGAATAAGTACTCCTCCCAGAGCTGC-3′ Actin, 5′-AAGGACTCCTATAGTGGGTGAC GA-3′ and 5′–ATCTTCTCCATGTCGTCCCAGTTG-3′, using the Taqman one step RT-PCR universal mastermix, and amplified cDNA products were measured in the StepOnePlus™ RT-PCR thermal cycler (Applied Biosystems). Differences between samples were calculated based on the differences in the number of cycles required to reach a threshold fluorescence intensity level.
General methods
Total cellular lysates were prepared using RIPA buffer (50mM Tris-HCl, 150mM NaCl, 5mM ethylene glycol tetraacetic acid, containing 1% Triton X-100, 0.5% deoxycholate, and 0.1% SDS and supplemented with protease inhibitor cocktail (Roche), 2mM PMSF, and 10mM iodoacetamide, pH 7.5). Protein concentration was determined by the Lowry method33 using bovine serum albumin (1mg/ml) as a standard. Samples were run on SDS–PAGE gels, transferred to nitrocellulose membranes and after blockage with low fat-milk, incubated with primary antibodies at the indicated dilutions. The proteins of interest were visualized after incubation of membranes with HRP-conjugated secondary antibodies by a chemiluminescence reagent in an LAS-3000 Imaging System (Fujifilm, Tokyo, Japan). Densitometric quantification of the immunoblotted membranes was performed using the Image J software (NIH).
Sample size and Statistical analysis
For the studies of isolation of lysosomes and cell fractionation the number of animals for preparation was determined based on the average values of enrichment and recovery of endogenous markers for each compartment. Power analysis was not performed as all these studies were done with wild-type untreated animals. No experiment was excluded from the final quantification. For most of the experiments there was not randomization as animals were all wild-type untreated. In the case of treatment with etoposide animals were randomly attributed to the untreated or treated group. For immunofluorescence quantifications of colocalization and number of puncta/cell were performed blinded. All numerical results are reported as mean+s.e.m. and, unless otherwise stated, n indicates number of independent experiments. We determined the statistical significance of the difference between experimental groups in instances of single comparisons by the two-tailed unpaired Student’s t-test with the Sigma Plot software (Jandel Scientific). In instances of multiple means comparisons, we used one-way analysis of variance (ANOVA) followed by the Bonferroni post-hoc test to determine statistical significance. Statistical analysis was performed in all the assays and significant differences are noted in the graphical representations.
Supplementary Material
Acknowledgments
This work was supported by grants from the National Institutes of Health AG21904, AG031782, AG038072 ACTC, DK098408 (AMC) and AG024391 and GM104459 (YS), and the generous support of R&R Belfer (AMC). CP was supported by the NIH Medical Scientist Training Program, NIH/NIGMS T32GM007288. We thank Dr. Esperanza Arias for help with etoposide injections, Antonio Diaz-Carretero for his assistance with the high content microscopy analysis, Dr. Sunandini Sridhar for help with sucrose density centrifugation, Dr. Fernando Macian for help with FACS analysis, and Dr. Susmita Kaushik for critical reading of the manuscript.
Footnotes
Author Contributions
CP performed the experiments, analyzed data, and prepared a draft of the manuscript; YS and AMC co-directed, edited and reviewed the final version of the manuscript.
Competing financial interest
The authors declare that they have no competing interests.
References
- 1.Mizushima N, Levine B, Cuervo AM, Klionsky DJ. Autophagy fights disease through cellular self-digestion. Nature. 2008;451:1069–1075. doi: 10.1038/nature06639. [DOI] [PMC free article] [PubMed] [Google Scholar]
- 2.Yang Z, Klionsky DJ. Mammalian autophagy: core molecular machinery and signaling regulation. Curr Opin Cell Biol. 2010;22:124–131. doi: 10.1016/j.ceb.2009.11.014. [DOI] [PMC free article] [PubMed] [Google Scholar]
- 3.Hoeijmakers JHJ. DNA Damage, Aging, and Cancer. New Engl J Med. 2009;361:1475–1485. doi: 10.1056/NEJMra0804615. [DOI] [PubMed] [Google Scholar]
- 4.Kaushik S, Cuervo AM. Chaperone-mediated autophagy: a unique way to enter the lysosome world. Trends Cell Biol. 2012;22:407–417. doi: 10.1016/j.tcb.2012.05.006. [DOI] [PMC free article] [PubMed] [Google Scholar]
- 5.Mathew R, et al. Autophagy suppresses tumor progression by limiting chromosomal instability. Genes Dev. 2007;21:1367–1381. doi: 10.1101/gad.1545107. [DOI] [PMC free article] [PubMed] [Google Scholar]
- 6.Bae H, Guan JL. Suppression of autophagy by FIP200 deletion impairs DNA damage repair and increases cell death upon treatments with anticancer agents. Molecular cancer research : MCR. 2011;9:1232–1241. doi: 10.1158/1541-7786.MCR-11-0098. [DOI] [PMC free article] [PubMed] [Google Scholar]
- 7.Dotiwala F, et al. DNA damage checkpoint triggers autophagy to regulate the initiation of anaphase. Proc Natl Acad Sci U S A. 2013;110:E41–49. doi: 10.1073/pnas.1218065109. [DOI] [PMC free article] [PubMed] [Google Scholar]
- 8.Siggens L, Figg N, Bennett M, Foo R. Nutrient deprivation regulates DNA damage repair in cardiomyocytes via loss of the base-excision repair enzyme OGG1. Faseb J. 2012;26:2117–2124. doi: 10.1096/fj.11-197525. [DOI] [PMC free article] [PubMed] [Google Scholar]
- 9.Robert T, et al. HDACs link the DNA damage response, processing of double-strand breaks and autophagy. Nature. 2011;471:74–79. doi: 10.1038/nature09803. [DOI] [PMC free article] [PubMed] [Google Scholar]
- 10.Cuervo AM. Chaperone-mediated autophagy: selectivity pays off. Trends Endocrin Metab. 2010;21:142–150. doi: 10.1016/j.tem.2009.10.003. [DOI] [PMC free article] [PubMed] [Google Scholar]
- 11.Dice JF. Peptide sequences that target cytosolic proteins for lysosomal proteolysis. Trends Biochem Sci. 1990;15:305–309. doi: 10.1016/0968-0004(90)90019-8. [DOI] [PubMed] [Google Scholar]
- 12.Chiang H, Terlecky S, Plant C, Dice JF. A role for a 70-kilodalton heat shock protein in lysosomal degradation of intracellular proteins. Science. 1989;246:382–385. doi: 10.1126/science.2799391. [DOI] [PubMed] [Google Scholar]
- 13.Cuervo AM, Dice JF. A receptor for the selective uptake and degradation of proteins by lysosomes. Science. 1996;273:501–503. doi: 10.1126/science.273.5274.501. [DOI] [PubMed] [Google Scholar]
- 14.Salvador N, Aguado C, Horst M, Knecht E. Import of a cytosolic protein into lysosomes by chaperone-mediated autophagy depends on its folding state. J Biol Chem. 2000;275:27447–27456. doi: 10.1074/jbc.M001394200. [DOI] [PubMed] [Google Scholar]
- 15.Bandyopadhyay U, Sridhar S, Kaushik S, Kiffin R, Cuervo AM. Identification of regulators of chaperone-nediated autophagy. Mol Cell. 2010;39:535–547. doi: 10.1016/j.molcel.2010.08.004. [DOI] [PMC free article] [PubMed] [Google Scholar]
- 16.Cuervo AM, Dice JF. Age-related decline in chaperone-mediated autophagy. J Biol Chem. 2000;275:31505–31513. doi: 10.1074/jbc.M002102200. [DOI] [PubMed] [Google Scholar]
- 17.Zhang YW, et al. Genotoxic Stress Targets Human Chk1 for Degradation by the Ubiquitin-Proteasome Pathway. Mol Cell. 2005;19:607–618. doi: 10.1016/j.molcel.2005.07.019. [DOI] [PubMed] [Google Scholar]
- 18.Burden DA, Osheroff N. Mechanism of action of eukaryotic topoisomerase II and drugs targeted to the enzyme. Biochimica et biophysica acta. 1998;1400:139–154. doi: 10.1016/s0167-4781(98)00132-8. [DOI] [PubMed] [Google Scholar]
- 19.Massey AC, Kaushik S, Sovak G, Kiffin R, Cuervo AM. Consequences of the selective blockage of chaperone-mediated autophagy. Proc Natl Acad Sci U S A. 2006;103:5805–5810. doi: 10.1073/pnas.0507436103. [DOI] [PMC free article] [PubMed] [Google Scholar]
- 20.Koga H, Martinez-Vicente M, Macian F, Verkhusha VV, Cuervo AM. A photoconvertible fluorescent reporter to track chaperone-mediated autophagy. Nat Commun. 2011;2:386. doi: 10.1038/ncomms1393. [DOI] [PMC free article] [PubMed] [Google Scholar]
- 21.Kiffin R, Christian C, Knecht E, Cuervo AM. Activation of chaperone-mediated autophagy during oxidative stress. Mol Biol Cell. 2004;15:4829–4840. doi: 10.1091/mbc.E04-06-0477. [DOI] [PMC free article] [PubMed] [Google Scholar]
- 22.Anguiano J, et al. Chemical modulation of chaperone-mediated autophagy by retinoic acid derivatives. Nature chemical biology. 2013 doi: 10.1038/nchembio.1230. [DOI] [PMC free article] [PubMed] [Google Scholar]
- 23.Liu Q, et al. Chk1 is an essential kinase that is regulated by Atr and required for the G2/M DNA damage checkpoint. Genes Dev. 2000;14:1448–1459. [PMC free article] [PubMed] [Google Scholar]
- 24.Koga H, Kaushik S, Cuervo AM. Altered lipid content inhibits autophagic vesicular fusion. FASEB J. 2010;24:3052–3065. doi: 10.1096/fj.09-144519. [DOI] [PMC free article] [PubMed] [Google Scholar]
- 25.Cuervo AM, Knecht E, Terlecky SR, Dice JF. Activation of a selective pathway of lysosomal proteolysis in rat liver by prolonged starvation. Am J Physiol. 1995;269:C1200–1208. doi: 10.1152/ajpcell.1995.269.5.C1200. [DOI] [PubMed] [Google Scholar]
- 26.Sarkaria JN, et al. Inhibition of ATM and ATR kinase activities by the radiosensitizing agent, caffeine. Cancer research. 1999;59:4375–4382. [PubMed] [Google Scholar]
- 27.Dastoor Z, Dreyer J. Nuclear translocation and aggregate formation of heat shock cognate protein 70 (Hsc70) in oxidative stress and apoptosis. J Cell Sci. 2000;113:2845–2854. doi: 10.1242/jcs.113.16.2845. [DOI] [PubMed] [Google Scholar]
- 28.Wang J, Han X, Zhang Y. Autoregulatory mechanisms of phosphorylation of checkpoint kinase 1. Cancer research. 2012;72:3786–3794. doi: 10.1158/0008-5472.CAN-12-0523. [DOI] [PMC free article] [PubMed] [Google Scholar]
- 29.Godard T, et al. Comparative in vitro and in vivo assessment of genotoxic effects of etoposide and chlorothalonil by the comet assay. Mutation Research/Genetic Toxicology and Environmental Mutagenesis. 1999;444:103–116. doi: 10.1016/s1383-5718(99)00100-x. [DOI] [PubMed] [Google Scholar]
- 30.Kaushik S, Massey AC, Cuervo AM. Lysosome membrane lipid microdomains: novel regulators of chaperone-mediated autophagy. EMBO J. 2006;25:3921–3933. doi: 10.1038/sj.emboj.7601283. [DOI] [PMC free article] [PubMed] [Google Scholar]
- 31.Massey AC, Follenzi A, Kiffin R, Zhang C, Cuervo AM. Early cellular changes after blockage of chaperone-mediated autophagy. Autophagy. 2008;4:442–456. doi: 10.4161/auto.5654. [DOI] [PubMed] [Google Scholar]
- 32.Kaushik S, Cuervo AM. Methods to monitor chaperone-mediated autophagy. Methods Enzymol. 2009;452:297–324. doi: 10.1016/S0076-6879(08)03619-7. [DOI] [PMC free article] [PubMed] [Google Scholar]
- 33.Lowry OH, Rosebrough NJ, Farr AL, Randall RJ. Protein measurement with the Folin phenol reagent. J Biol Chem. 1951;193:265–275. [PubMed] [Google Scholar]
Associated Data
This section collects any data citations, data availability statements, or supplementary materials included in this article.


