

Abstract
Although many studies have examined the relationship of adiposity with neighborhood socioeconomic context in adults, few studies have investigated this relationship during adolescence. Using 10-year annual measurements of body mass index, expressed as z-scores (BMIz), obtained from 775 Black and White participants of the NHLBI Growth and Health Study, a prospective cohort study of girls from pre- to post-adolescence, we used multilevel modeling to investigate whether family socioeconomic status (SES) and neighborhood socioeconomic characteristics (measured by census tract median family income) explain variation in BMIz trajectory parameters. Analyses controlled for pubertal maturation. We found that lower SES was associated with higher overall levels of BMIz for both White and Black girls. Additionally, lower SES Black girls had a more sustained increase in BMIz during early adolescence and reached a higher peak compared to higher SES Black girls and to White girls. Neighborhood income was associated with BMIz trajectory for Black girls only. Unexpectedly, among Black girls, living in higher income neighborhoods was associated with higher overall levels of BMIz, controlling for SES. Our findings suggest that neighborhood socioeconomic characteristics may affect adolescent BMIz trajectory differently in different racial/ethnic groups.
Keywords: adolescent obesity, body mass index, growth trajectory, race, neighborhoods, longitudinal study
Introduction
Overweight and obesity in children and adolescents are major risk factors for chronic disease and are associated with increased adult obesity risk (Whitaker et al., 1997) and premature mortality (Engeland et al., 2003; Engeland et al., 2004). The prevalence of overweight and obesity in children and adolescents exceeds 25 percent in many countries (World Health Organization, 2009). In 2007-2008, 34 percent of U.S. adolescents aged 12-19 were overweight or obese (Odgen et al., 2010).
There are large disparities in obesity prevalence among population groups in the U.S., with prevalence varying by socioeconomic status (SES) (Ogden et al., 2014; Wang & Beydoun, 2007). In the U.S. and other high income countries, children from families with lower SES, as measured by household income or parental education, often have a higher risk of obesity (e.g., Strauss & Knight, 1999; Stamatakis et al., 2005; Lamerz et al., 2005; Romon et al., 2005; Howe et al., 2011; Shrewsbury and Wardle, 2008). However, the relation between family SES and obesity has been found to vary by race and gender. In a study of children and adolescents, using data from the National Health and Nutrition Examination Survey, Wang et al. (2006, 2007) found that SES was inversely related to obesity risk among Whites but not among Blacks or Hispanics; in fact, high SES Black girls were at increased risk compared to their lower SES counterparts. Using data from the National Longitudinal Study of Adolescent Health (Add Health), Gordon-Larsen et al. (2003) reported similar findings, while Robinson et al. (2009) found that the lowest parental education stratum had the highest prevalences of obesity for Black females, White females and White males, but the lowest prevalence for Black males. Scharoun-Lee et al, (2009) examined racial/ethnic differences in the influence of life course SES on obesity risk from adolescence to adulthood, and found no differences. Using data from the National Longitudinal Study of Youth, Hernandez and Pressler (2014) found that childhood poverty was positively related to overweight in young adulthood among White, Black and Hispanic women, but inversely or not related to obesity risk among White, Black and Hispanic men. Studies among U.S. adults show similarly complex variation in the relationship between SES and obesity across gender, age and racial/ethnic groups (see, for example, Zhang & Wang, 2004; Wang & Beydoun, 2007).
Obesity is related not only to individual SES, but also to the socioeconomic characteristics (SEC) of a person's environment (Robert & Reither, 2004; Wang et al., 2007). In higher income countries, neighborhood SEC such as aggregated income, education, or employment levels have been consistently associated with increased obesity risk (e.g., Kinra et al., 2005; Kinra et al., 2000; Black & Macinko, 2007). Neighborhood SEC have been reported to be associated with features of an obesogenic environment, such as a lack of healthy food options and safe facilities for physical activity (Gordon-Larsen et al., 2006; Morland et al., 2007; Wang et al, 2007). Most of these studies have been of adults and few studies have focused on children or adolescents specifically. Further, most studies of children and adolescents have been cross-sectional (e.g., Chen & Paterson, 2006; Janssen et al., 2006; Nelson et al., 2006), with only a few having a longitudinal design (Burdette & Needham, 2012; Nicholson & Browning, 2012).
A life course approach suggests that an insult to the optimal development of adipose tissue during youth may have enduring effects on obesity and obesity-related conditions later in life (Darnton-Hill et al., 2004; Daniels et al., 2005). Adolescence has been identified as a particularly critical period for the development of obesity, as it is characterized by pubertal development and considerable changes in body composition (Dietz et al., 1994; Adair, 2008). From a biological perspective, it is considered a critical period for the differentiation of adipocytes, cells specialized in storing energy as fat (Daniels et al., 2005). From a psychosocial perspective, it is considered a period of increasing independence and transition into adulthood. During this life stage, adolescents become increasingly exposed to the neighborhood environment (Leventhal et al., 2009). As they get older, adolescents may feel more empowered to purchase foods on their own due to increasing independence and money obtained from their allowances and/or jobs. Further, peer influences become more important with age (Taylor, et al., 1998; Beal, et al., 2001). These factors suggest that the effects of neighborhoods on adolescents become more evident with age.
Studies have also reported that the relationship between neighborhoods and health outcomes varies by race. Several cross-sectional studies have reported that the association of neighborhood poverty with obesity risk is stronger among Whites than among Blacks (Wickrama et al., 2006; Lovasi et al., 2009a; Lovasi et al., 2009b). A longitudinal study using three waves of data from the Add Health study found that the association of neighborhood deprivation with body mass index (BMI) was weaker among Black and Latino youth than among White youth (Burdette & Needham, 2012). These attenuated effects, it is argued, may be explained because minorities are less apt to reap the benefits of community resources compared to whites (Burdette & Needham, 2012, Lovasi, et al. 2009b). It is also possible that these attenuated effects result from compressed variation in neighborhood SEC among minority populations. In addition, trajectories of adiposity appear to differ between Black and White women. Specifically, a study reported that Black women had higher baseline BMI and a greater rate of increase in BMI over 16 years compared to White women (Ruel et al., 2010).
Given these observations from the literature, we investigate the following hypotheses with regard to the longitudinal effects of family SES and neighborhood SEC on adiposity, as measured by sex- and age-specific body mass index z-scores (BMIz):
Lower family SES is associated with higher BMIz and steeper trajectories of BMIz increase during adolescence in both Black and White girls.
Independent of family SES, neighborhood SEC are associated with BMIz trajectories; specifically, girls living in low socioeconomic neighborhoods experience greater increases in BMIz during adolescence compared to girls living in high socioeconomic neighborhoods.
Race moderates these associations such that the effects of neighborhoods on BMIz trajectories are attenuated among Black girls compared to White girls.
We test these hypotheses using 10 years of prospective data from the National Heart, Lung, and Blood Institute Growth and Health Study (NGHS; NGHS Research Group, 1992). Taking advantage of the comparatively long period of observation and high frequency of anthropometric measurements (annually), we focus on examining longitudinal patterns of adiposity and their association with family SES and neighborhood SEC. Longitudinal patterns (or trajectories) of adiposity, rather than simply changes in weight status (obese/non-obese), are important to study, given findings such as that of Barker et al. (2005), which suggested that a pattern of low adiposity followed by rapid weight gain during early childhood is associated with insulin resistance and coronary events in later life.
Methods
Study Design and Sample
Data analyzed for this study are from NGHS, a 10-year prospective cohort study of 2379 girls, enrolled at age 9-10 years in 1987-1988, designed to identify factors associated with the onset and development of obesity in Black and White preadolescent girls (NGHS Research Group, 1992). At each annual examination (visit), height and weight were measured and all residential addresses of the participants in the preceding year were recorded. Pubertal development stage was assessed by physical examination using a modification of Tanner staging (Tanner, 1992; NGHS Study Group, 1992). Information on education and income was obtained from parents during the first year of the study. NGHS had three recruitment sites. We used data from participants recruited by the University of California at Berkeley site (N = 887), which had residential addresses geocoded. These participants resided in Contra Costa County, California at study entry. Only participants retained at visit 9 and/or 10 were included, resulting in an analytic sample of 775 participants (87 percent of original sample). Participants experiencing pregnancy during the study were excluded from our analyses.
Measures
The dependent variable was sex- and age-specific BMIz, which indicates BMI relative to other individuals of the same age and sex on a standard deviation scale. BMIz was calculated using CDC 2000 Growth Charts (Kuczmarksi et al., 2002) and software developed by the Centers for Disease Control and Prevention (http://www.cdc.gov/nccdphp/dnpao/growthcharts/resources/sas.htm).
To determine neighborhood SEC, participant addresses were geocoded using ArcGIS version 10.0 (Esri, Redlands, CA) to determine the census tracts in which they had lived. We considered several measures of neighborhood SEC available from the U.S. Census, including median family income (referred to as median income herein), percent of families living in poverty and percent of college graduates, as well as composite measures such as the neighborhood disadvantage index (Ricketts & Sawhill, 1988; Sampson et al., 1997), all of which were highly correlated (Pearson r's 0.64 to 0.98). Neighborhood disadvantage index is the average of percent of female-headed households, percent of households in poverty, percent of individuals on public assistance and percent of males unemployed (Ricketts & Sawhill, 1988; Sampson et al., 1997). Because its distribution was less skewed and its ranges for Blacks and Whites had greater overlap compared to other measures, census tract median income from the 1990 U.S. Census, was selected to characterize neighborhood SEC. When a participant had lived in multiple census tracts during a preceding year, the mean of the median income values over all reported census tracts of residence was used. A single average value was computed for each year, and these yearly values were used as a time-varying covariate, which changed when participants moved. Time points at which participants resided outside Contra Costa County or adjacent Alameda County were not included in analyses. We repeated the analyses using neighborhood disadvantage index.
Family-level SES was assessed by family annual income and the educational attainment level of the parent or guardian with the higher level of education (maximal parental education). These two variables were combined into a single composite family SES index by coding each variable on an ordinal scale with the same range and then taking the mean. This composite score was dichotomized at the midpoint to classify the participants as having high or low family SES. A continuous version of this index was not used in analyses since this variable did not have a proper numeric scale. Because these variables were collected only in year one, they were modeled as time-invariant. As a sensitivity analysis, we repeated the analysis using 3-level maximal parental education (less than high school, high school or some college, college degree or higher) as the family SES measure, and also including both family income and maximal parental education together in the model.
Pubertal development stage may confound associations with adolescent adiposity (Kaplowitz et al., 2001). Pubertal stage was considered as a time-varying covariate, using a four-level pubertal stage variable based on Tanner staging (Tanner, 1992) – prepuberty, early maturity, midpuberty, maturity, and also as a time-fixed covariate for which participants were classified as early maturers or late maturers depending on whether they reached maturity before or after age 15; this age was selected because the median age at which the participants reached pubertal maturity (Tanner stage 5) was 15.4 years.
Statistical Methods
The longitudinal trajectories of BMIz of the participants were modeled by use of multilevel polynomial growth curve models (Fitzmaurice et al., 2011; Hedeker & Gibbons, 2006). Such models include: (i) a level-1 within-subjects model for change over time in the outcome variable, represented as
where yti is the observed value of the outcome variable at time t for individual i, ati is the age at time t for individual i, and bpi is the growth trajectory parameter for individual i associated with the polynomial term of degree p, p = 0, 1, …, P, and (ii) a level-2 between-subjects model to represent variation in growth trajectory parameters between individuals, including dependence of growth parameter values on covariates, represented as
where Xqi is a covariate, βpq represents the effect of Xqi on the pth growth parameter, and rpi is a random effect with mean of 0.
Development of the multilevel growth curve models was conducted separately for White and Black participants. The first step was to determine the best-fitting growth curve model for each race group, absent of any covariate effects. For each race, we began with a full model including fixed and random effects for intercept, linear, quadratic and cubic terms for age (centered at age 15 years). We conducted likelihood ratio tests for the random effects, beginning with the cubic term, to determine which to retain in the models, comparing the test statistic to an equal mixture of chi-squares with 1 and 2 degrees of freedom as recommended by Verbeke & Molenberghs (2000). We then conducted likelihood ratio tests for the fixed age polynomial terms to arrive at the best-fitting basic growth curve model for each race group. Models for the within-subject error covariance structure were compared using the Akaike Information Criterion (AIC; lower AIC indicates better model fit) and a first order autoregressive process (AR-1) was selected.
We next determined the best manner in which to enter pubertal maturation into the models. We examined models incorporating pubertal stage as a time-varying covariate and as a time-fixed early maturer/late maturer dichotomous variable. Results were similar; hence we used the simpler model in which pubertal maturation was entered as a dichotomous variable. The resulting model was termed Model 1 or the base model.
Next, we built upon the base models to incorporate family SES and neighborhood SEC in the level-2 models. Family SES was entered dichotomously as high or low, and neighborhood SEC was entered as a time-varying continuous covariate. Models were constructed in steps. Model 2 consisted of Model 1 plus the family SES binary indicator. Model 3 added neighborhood median income. Model 4 added terms for interactions between family SES and neighborhood median income. We compared the models using AIC and likelihood ratio tests (Fitzmaurice et al., 2011; Hedeker & Gibbons, 2006).
In longitudinal studies, it is possible to distinguish two different effects of time-varying covariates: (1) a population-average or between-subject effect corresponding to the overall effect of the covariate on the outcome variable, as measured by the association of the mean of the covariate with the outcome, and (2) an individual-specific or within-individual effect, corresponding to the effects of deviations from the average of the covariate on the series of responses within an individual (Neuhaus & Kalbfleisch, 1998). Thus, we also tested for a difference in population-average and individual-specific effects for neighborhood SEC. In our application, this corresponds to testing whether the difference in growth parameters between individuals who differ in mean neighborhood SEC (averaged over the 10-year observation period) by one unit is the same as the difference in growth parameters associated with a one-unit change in neighborhood SEC within an individual.
Analyses were conducted using SAS version 9.3 (SAS Institute Inc., Cary, NC).
Results
The analytic data set consisted of 367 White and 408 Black participants (Table 1). At baseline, Black and White girls were of similar age (10 years), but differed with respect to many other characteristics. Black girls had higher adiposity compared to White girls at both baseline and at the 10th visit. For example, at the 10th visit, 24 percent of Black girls were obese compared to 12 percent of White girls. A higher proportion of Black girls reached pubertal maturity before age 15 compared to White girls. Also, Black girls had lower family and neighborhood socioeconomic resources than White girls. For instance, 20 percent of Black girls had parents with a college degree compared to 43 percent of White girls. Similarly, the average median income of the census tracts in which they had lived (time-weighted) was $29,667 for Black girls compared to $47,979 for White girls.
Table 1. Characteristics of the NGHS participants (N = 775).
| Characteristic | White N = 367 |
Black N = 408 |
|---|---|---|
|
| ||
| Mean ± SD (min, max) or N (%) | Mean ± SD (min, max) or N (%) | |
| Age at first visit, years | 10.0 ± 0.6 (9, 11) | 10.0 ± 0.6 (9, 11) |
| BMI z-score, visit 1 | 0.3 ± 1.0 (-2.5, 2.7) | 0.5 ± 1.1 (-2.6, 2.6) |
| Underweight (<5th percentile) | 9 (2%) | 9 (2%) |
| Normal (5th to <85th percentile) | 255 (69%) | 258 (63%) |
| Overweight (85th to <95th percentile) | 65 (18%) | 69 (17%) |
| Obese (≥95th percentile) | 38 (10%) | 72 (18%) |
| BMI z-score, visit 10a | 0.4 ± 1.0 (-3.1, 2.6) | 0.7 ± 1.1 (-3.0, 2.5) |
| Underweight (<5th percentile) | 9 (2%) | 8 (2%) |
| Normal (5th to <85th percentile) | 260 (71%) | 224 (55%) |
| Overweight (85th to <95th percentile) | 55 (15%) | 79 (19%) |
| Obese (≥95th percentile) | 43 (12%) | 97 (24%) |
| Age of pubertal maturity | ||
| Age 15 or younger | 240 (65%) | 287 (70%) |
| Older than age 15 | 127 (35%) | 121 (30%) |
| Parental educational attainment | ||
| Less than high school | 73 (20%) | 104 (25%) |
| Some college | 136 (37%) | 223 (55%) |
| College degree or higher | 157 (43%) | 80 (20%) |
| Missing | 1 (0.3%) | 1 (0.3%) |
| Family annual income | ||
| < $10,000 | 23 (6%) | 130 (32%) |
| $10,000 to $19,000 | 41 (11%) | 89 (22%) |
| $20,000 to $39,999 | 117(32%) | 100 (25%) |
| $40,000 and over | 171 (47%) | 61 (15%) |
| Missing | 15 (4%) | 28 (7%) |
| Family SES composite index | ||
| Low | 111 (30%) | 253 (62%) |
| High | 256 (70%) | 155 (38%) |
| Census tract median family income in | ||
| $1000 (mean over period of observation) | 48 ± 11 (18, 73) | 30 ± 12 (12, 60) |
BMI z-score at visit 9 was used if visit 10 was missing.
Figure 1 shows the trajectories of BMIz for a representative sample of participants. There is considerable variation in initial BMIz at the first visit as well as in trajectory shape over the observation period, with some participants following linear trajectories and others following curvilinear trajectories.
Figure 1.
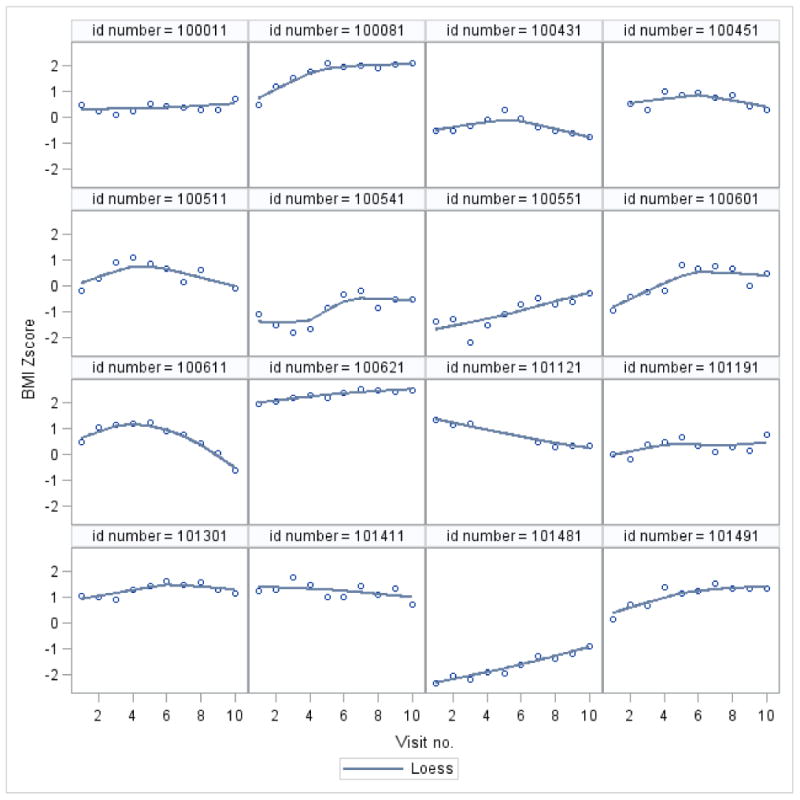
Sample of 16 BMI z-score trajectories of participants in the NGHS study. Scatterplots of BMI z-score versus visit number are overlaid with loess (locally weighted scatterplot smoothing) curves
Model building for the growth curve model (first conducted without covariate effects) revealed that the BMIz trajectories for White participants were best represented by a quadratic polynomial and random effects for the intercept, linear and quadratic terms, while the trajectories for Black participants were best represented by a cubic polynomial, also with random effects for the intercept, linear and quadratic terms (results available from authors). The effect of pubertal maturity was found to be adequately represented by including an effect of early versus late maturity (maturity before or after age 15 years) on the intercept.
In Table 2, we compare the fit of multilevel growth curve models progressively adding effects of family SES, neighborhood median income, and interactions between family SES and neighborhood median income. For White participants, adding family SES as a covariate explained a significant amount of variation in growth parameters (p = 0.01). The lack of improvement in model fit after adding neighborhood median income as a covariate indicated that this variable did not explain substantial variation in growth parameters after accounting for family SES (Model 3). Further adding interactions between family SES and neighborhood median income also did not improve the model fit. For Black participants, adding family SES significantly improved the model fit compared to the base model (p = 0.002) and adding neighborhood median income further improved the model fit (p = 0.002), indicating that both family SES and neighborhood SEC helped to explain individual variation in growth parameters. The addition of interaction terms did not improve the model fit.
Table 2. Comparison of fit of models for BMI z-score trajectories, White and Black participants, NGHS study.
| White participants | |||||
|---|---|---|---|---|---|
|
| |||||
| Model | AIC | -2 log likelihood | Df | Likelihood ratio χ2 | p-value |
| 1. Base model | 2750.6 | 2726.6 | |||
| 2. Base model + family SES | 2745.9a | 2715.9b | 3 | 10.7 | 0.01 |
| 3. Base model + family SES + neighborhood median income | 2750.0 | 2714.0 | 3 | 1.9 | 0.59 |
| 4. Base model + family SES + neighborhood median income + family SES-by-neighborhood median income interactions | 2752.0 | 2710.0 | 3 | 4.0 | 0.26 |
|
| |||||
| Black participants | |||||
|
| |||||
| Model | AIC | -2 log likelihood | df | Likelihoo d ratio χ2 | p-value |
|
| |||||
| 1. Base model | 2649.4 | 2623.4 | |||
| 2. Base model + family SES | 2640.8 | 2606.8 | 4 | 16.6 | 0.002 |
| 3. Base model + family SES + neighborhood median income | 2632.2a | 2590.2b | 4 | 16.5 | 0.002 |
| 4. Base model + family SES + neighborhood median income + family SES-by-neighborhood median income interactions | 2639.5 | 2589.5 | 4 | 0.7 | 0.95 |
AIC, Akaike Information Criterion; SES, socioeconomic status.
Base model included basic polynomial growth model terms and pubertal stage
Best model by AIC
Best model by likelihood ratio tests
Tests for a difference in population-average (between-subject) and individual-specific (within-subject) effects of neighborhood median income did not find evidence of a difference (all p-values > 0.05). Thus, in the models presented, we assume that the population-average and individual-specific effects are the same. This implies that a one-unit change in neighborhood median income ($1000) has the same effect on growth parameters, whether we consider individuals who differ in neighborhood median income by $1000 or an individual who moves between neighborhoods that differ in median income by $1000.
Fitted model parameters are provided in Table 3. Because we centered age at 15 years, the low family SES indicator can be interpreted as indicating that the difference in mean BMIz between girls with low versus high family SES at age 15 was 0.33 among Whites and 0.16 among Blacks. Other estimated parameters of polynomial growth curve models are difficult to interpret directly. To facilitate interpretation, we provide effect displays which show the mean BMIz growth curves for White and Black participants with specific values of covariates (Figure 2). We provide plots of the mean growth curves for participants with low individual SES and low neighborhood SEC (defined as census-tract level median income of $25,000), high individual SES and low neighborhood SEC, low individual SES and high neighborhood SEC (defined as census-tract level median income of $50,000), and high individual SES and high neighborhood SEC. The plots shown are for participants with early pubertal maturity; participants with late pubertal maturity exhibited the same shape but were translated down the vertical axis by an increment (0.006 standard deviation units for Whites and 0.12 for Blacks). To increase comparability of the growth curves for White and Black participants, plots for Model 3, including both family SES and neighborhood median income, are provided for both race groups, even though neighborhood median income was not found to be statistically significant for Whites.
Table 3. Estimates from best fit polynomial growth curve models for longitudinal measurements of BMI z-scores.
| White | Black | |||||
|---|---|---|---|---|---|---|
| Variable | Coef | SE | p-value | Coef | SE | p-value |
| Intercept | 0.424 | 0.088 | <.0001 | 0.460 | 0.121 | 0.0002 |
| Early maturity | 0.0042 | 0.0999 | 0.97 | 0.117 | 0.104 | 0.26 |
| Low family SES | 0.330 | 0.103 | 0.001 | 0.162 | 0.100 | 0.105 |
| Neighborhood median family income ($1000 increase) | -- | -- | -- | 0.0048 | 0.0014 | 0.0008 |
| Age | -0.0014 | 0.0064 | 0.83 | -0.037 | 0.022 | 0.09 |
| Age × low family SES | -0.0055 | 0.0116 | 0.63 | 0.029 | 0.014 | 0.03 |
| Age × neighborhood median family income | 0.000005 | 0.00051 | 0.99 | |||
| Age2 | -0.0073 | 0.0015 | <0.0001 | -0.0045 | 0.0037 | 0.22 |
| Age2 × low family SES | -0.0032 | 0.0027 | 0.24 | -0.0072 | 0.0022 | 0.001 |
| Age2 × neighborhood median family income | -- | -- | -- | 0.000033 | 0.000092 | 0.72 |
| Age3 | -- | -- | -- | 0.0025 | 0.0010 | 0.01 |
| Age3 × low family SES | -- | -- | -- | -0.0010 | 0.0006 | 0.08 |
| Age3 × neighborhood median family income | -- | -- | -- | -0.00001 | 0.000024 | 0.56 |
|
| ||||||
| Random effect variance parameter estimates | Estimate | SE | p-value | Estimate | SE | p-value |
| Intercept | 0.68 | 0.06 | <0.0001 | 0.84 | 0.07 | <0.0001 |
| Age | 0.0050 | 0.0008 | <0.0001 | 0.004 | 0.0007 | <0.0001 |
| Age2 | 0.00011 | 0.00004 | 0.006 | 0.00004 | 0.00003 | 0.11 |
| AR-1 | 0.47 | 0.06 | <0.0001 | 0.56 | 0.07 | <0.0001 |
| Residual | 0.13 | 0.02 | <0.0001 | 0.12 | 0.02 | <0.0001 |
AR-1, first order autoregressive process correlation parameter; SE, standard error; SES, socioeconomic status;
Figure 2. Effect displays showing mean BMI z-score growth curves for White and Black participants by low vs. high family socioeconomic status (SES) and low vs. high neighborhood socioeconomic characteristics (SEC; $25,000 vs. $50,000 census tract median family income).
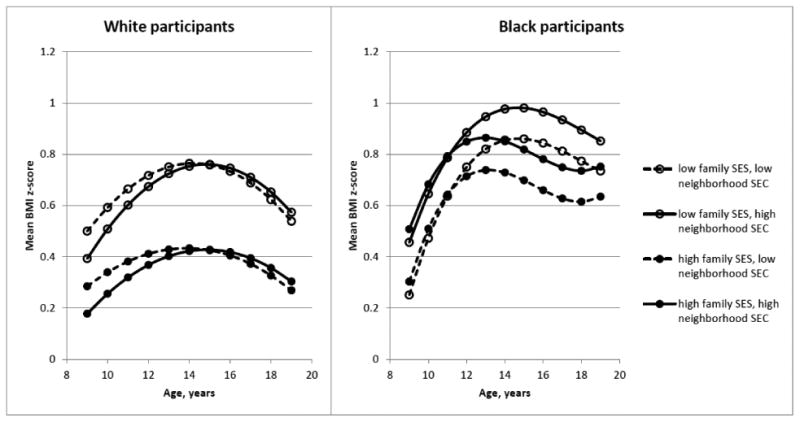
The plots show that for White participants, family SES had a large effect on overall BMIz level, with low family SES participants having higher overall BMIz than high family SES participants over the entire observation period. There appeared to be a more rapid increase in BMIz among low family SES participants during ages 9 to 14. Within groups defined by low or high family SES, there was little difference between those residing in higher versus lower income neighborhoods, other than a suggestion that girls in higher income neighborhoods reached a peak BMIz at a slightly older age.
For Black participants, at age 9, neighborhood median income was more strongly associated with BMIz than was family SES; an increase in census tract median income of $25,000 was associated with a BMIz that was about 0.1 standard deviation units higher. All four groups had a similar steep increase in BMIz during ages 9 through 11, after which low family SES participants continued to increase strongly to a peak around age 15 while the rate of increase among high family SES participants decelerated and reached lower peaks at earlier ages (about age 13). Within groups defined by low or high family SES, participants living in higher income neighborhoods had higher overall BMIz levels.
Repeating the analyses using the neighborhood disadvantage index gave similar results as using neighborhood median income: neighborhood effects were significant for Blacks but not Whites, and lower disadvantage index (i.e., higher neighborhood SEC) was associated with higher BMIz for Blacks. The findings were again replicated when including both family income and parental education as distinct predictors rather than using the family SES composite, and when using 3-level maximal parental education as the family SES measure (results available from authors).
Discussion
Few studies have examined trajectories of adiposity among adolescents in relation to neighborhood characteristics. Yet, understanding these trajectories is critically important, particularly for youth who are rapidly developing both biologically and socially. Our study, using 10 years of prospective data, investigated how BMIz trajectories varied as a function of family and neighborhood socioeconomic context and race. The data yielded several findings that were not fully consistent with a priori hypotheses based on the current sparse literature for adolescents and the assumption that relationships observed for adults would also hold for adolescents.
Consistent with our first hypothesis, we found that low family SES was related to higher overall BMIz in this sample of adolescent girls from Contra Costa County. The mean difference in BMIz at age 15, between low and high family SES girls, was estimated to be 0.33 for White and 0.16 for Black girls. Although there is no established threshold for a clinically significant change or difference in BMI z-score, some investigators have used a change of 0.10 units as a benchmark (Dorsey et al., 2010). Patterns of change in BMIz over time, however, were more complex. Among Blacks, low family SES was associated with a more sustained increase in BMIz during early adolescence to a higher peak; this pattern was not repeated among Whites.
Our second hypothesis, that neighborhood SEC are associated with BMIz trajectories independent of family SES, was only partially supported; neighborhood median income was related to BMIz trajectories for Blacks but not Whites. Our third hypothesis, that the associations between neighborhood SEC and BMIz trajectories would be attenuated among Black girls compared to White girls, was not supported. Instead, we found no significant association among White girls, and we unexpectedly found that among Black girls, residing in neighborhoods with more advantaged socioeconomic characteristics was associated with higher overall levels of BMIz, controlling for family SES. This finding was robust, being replicated using various alternative predictor sets for family SES and for neighborhood SEC. We further found a different longitudinal pattern in BMIz among Blacks according to family SES, such that girls from low and high SES families diverged in BMIz trajectory at about age 12. Specifically, the trajectories of girls from low SES families continued to climb upward while the trajectories of girls from high SES families slowed and reached a lower peak at an earlier age. We are unable to empirically account for the mechanisms that drive these patterns, but we speculate that Black adolescent girls from high SES families may be exposed to different psychosocial or biological stressors during early childhood than Black girls from low SES families. For example, Black girls may experience psychosocial stresses related to their ethnic minority status that are less buffered by supportive social networks (Jarrett, 1995). They may also experience biological stresses. In particular, there is emerging evidence to suggest that exposure to high levels of endocrine disrupting chemicals (EDCs) found in household products such as plastic food containers, personal care products, and household cleaners and deodorizers, is associated with early pubertal maturation (Buttke et al., 2012), which was observed more frequently in the NGHS Black girls (Braithwaite at al., 2009). While only race but not income has been found to be associated with exposure to EDCs, interactions between race and income have not been explored (Buttke et al., 2012).
It is curious that neighborhood SEC were associated with BMI trajectory variation only among the Black girls in our sample. Some studies have found that the effects of neighborhoods vary by race (e.g. Kirby et al., 2012) while other studies have not (e.g. Kimbro & Denny, 2012). Our results differ from other longitudinal studies examining the relation between adolescent adiposity and neighborhood SEC in Black and White girls. Nicholson & Browning (2012) found that higher neighborhood disadvantage increased the odds of becoming obese for adolescent females similarly among Whites, Blacks, and Hispanics. Burdette & Needham (2012) found no association between neighborhood characteristics and initial BMI for girls, at grades 7-11. For White but not Black or Latina girls, they observed a positive association between neighborhood disadvantage and rate of change in BMI. In comparison, we found that White girls living in more disadvantaged neighborhoods had somewhat higher BMIz at age 9-10 years, but these differences were no longer evident by age 19. For Black girls, living in higher income neighborhoods was associated with higher BMIz at age 9-10, and this difference was essentially sustained over the 10-year observation period. These differences among studies may be due to differences in outcomes and age range. Nicholson & Browning (2012) examined adolescents who were ages 11-21 at the first wave and ages 18-25 at the second wave (two waves of data were analyzed), and used obesity as the outcome. The study by Burdette & Needham (2012) examined young persons who were aged 13 at the first wave and aged 32 at the last wave (three waves of data were analyzed), and their outcome was BMI. In contrast, our study focused on girls starting at age 9 or 10 and ending at age 19 or 20 and examined BMIz trajectories. Differences could be explained by our greater level of detail of BMI trajectory (10 annual measurements over a span of 10 years), in which we had more intermediate time points and thus could more fully resolve the longitudinal patterns. Furthermore, we used gender and age specific z-scores, which are appropriate because youth are rapidly growing in both weight and height, whereas in adults, the assumption is that BMI changes mainly as a function of weight (with height generally unchanging for most adults). In addition, our study controlled for biological maturation (pubertal stage) based on physical examination, which was either not included in prior neighborhood studies or was based on self-report (Nicholson & Browning, 2012). This control is critically important because the nutritional requirements of youth change as a function of maturation, and also because there is some evidence to suggest that early life deprivation and stress can hasten biological maturation (Mishra et al., 2009). In addition, race differences in average age of maturation have been reported. In an earlier study using data from all three centers of the NGHS, Braithwaite et al. (2009) reported similar findings with regard to the difference in average age of maturation between Blacks and Whites.
Alternatively, the different findings may be due to the use of different neighborhood disadvantage measures. Burdette & Needham (2012) used parental perceptions of neighborhood disorder, adolescents' perception of neighborhood safety, and a composite index of neighborhood disadvantage based on census tract measures together in the same models, which makes direct comparisons with our results difficult. Nicholson & Browning (2012) used a composite of census tract items. We reached similar conclusions whether using census tract median income or a composite measure. Disentangling the various aspects of the neighborhood environment that act as barriers to or facilitators of obesogenic behaviors is a major methodological challenge (Black and Macinko, 2008; Lake et al, 2010; Wall et al., 2012). There is not yet a consensus on which characteristics of a neighborhood may be most strongly related to health outcomes and how best to measure these characteristics. Additionally, it is well known that SES measures can lack comparability across racial groups (Williams and Collins, 1995). Further research is needed to better identify which specific features of the neighborhood environment are most important for different population segments.
Our study has limitations. First, we used observational data, which has well-known limitations for causal inference. Self-selection of families into certain neighborhoods could account for the findings and lead to erroneous conclusions about neighborhood effects (Oakes, 2004). Second, the generalizability of the findings is limited. The NGHS studied only Black and White girls, so our findings cannot be extended to boys or to other racial/ethnic groups. Also, the sample was not designed to be nationally representative; rather, the sampling frame was selected to minimize the disparity in education and income between Blacks and Whites. Further, it should be noted that our study used data from only one of the three NGHS sites due to the unavailability of geocoded addresses of participants from the other two sites. Our sample was from Contra Costa County only. Some participants were dropped due to missing data and some did not have data for all ten visits, which could have resulted in further biases. Nonetheless, the NGHS retained over 90 percent of participants over the course of a decade, and our study used complete data from 87 percent of the participants. Third, we assumed effects of family SES and neighborhood SEC were the same over all ages whereas their influence may vary with age. Since family SES was assessed only in year one, we were unable to explore its potentially time-varying impact.
These limitations are balanced by several strengths, including a fairly long period of observation with many repeated measures, the use of clinical assessments of height and weight (not self-reported), and controls for pubertal stage determined by physical examination, which is critically important for persons in the age range studied.
To our knowledge, this is the first report of a difference in the relative contributions of family and neighborhood SEC to BMI trajectories during adolescence between Black and White girls. Our findings suggest, as others have noted (Cummins & MacIntyre, 2006), that context is important in understanding the contributions of the environment to obesity risk. Further work is needed to elucidate the mechanisms that connect neighborhood context to obesity development among adolescents from varying socio-cultural groups. Understanding such mechanisms has implications for the design of effective interventions to address adolescent obesity risk.
Acknowledgments
This research was supported by National Institutes of Health/National Institute of Diabetes, Digestive and Kidney Disease grant DK086038-01. Crespi was also supported by National Institutes of Health UL1TR000124. We would like to thank Hannah Husby and Tabashir Nobari for editorial assistance.
Contributor Information
Catherine M. Crespi, Email: ccrespi@ucla.edu.
May C. Wang, Email: maywang@ucla.edu.
Edmund Seto, Email: eseto@uw.edu.
Robert Mare, Email: mare@ucla.edu.
Gilbert Gee, Email: gilgee@ucla.edu.
References
- Adair LS. Child and adolescent obesity: epidemiology and developmental perspectives. Physiol Behav. 2008;94:8–16. doi: 10.1016/j.physbeh.2007.11.016. [DOI] [PubMed] [Google Scholar]
- Barker DJP, Osmond C, Forsen TJ, Kajantie E, Eriksson JG. Trajectories of growth among children who have coronary events as adults. New Eng J Med. 2005;353:1802–1809. doi: 10.1056/NEJMoa044160. [DOI] [PubMed] [Google Scholar]
- Bandura A. Social Learning Theory. Englewood Cliffs, NJ: Prentice Hall; 1977. [Google Scholar]
- Beal AC, Ausiello J, Perrin JM. Social influences on health-risk behaviors among minority middle school students. J Adolesc Health. 2001;28:474–80. doi: 10.1016/s1054-139x(01)00194-x. [DOI] [PubMed] [Google Scholar]
- Björntorp P, Rosmond R. Obesity and cortisol. Nutrition. 2000;16:924–936. doi: 10.1016/s0899-9007(00)00422-6. [DOI] [PubMed] [Google Scholar]
- Bingenheimer JB, Raudenbush SW. Statistical and substantive inferences in public health: issues in the application of multilevel models. Annu Rev Publ Health. 2004;25:53–77. doi: 10.1146/annurev.publhealth.25.050503.153925. [DOI] [PubMed] [Google Scholar]
- Black JL, Macinko J. Neighborhoods and obesity. Nutr Rev. 2008;66:2–20. doi: 10.1111/j.1753-4887.2007.00001.x. [DOI] [PubMed] [Google Scholar]
- Boone-Heinonen J, Gordon-Larsen P, Kiefe CI, Shikany JM, Lewis CE, Popkin BM. Fast food restaurants and food stores: longitudinal associations with diet in young to middle-aged adults: the CARDIA study. Arch Intern Med. 2011;171:1162–1170. doi: 10.1001/archinternmed.2011.283. [DOI] [PMC free article] [PubMed] [Google Scholar]
- Braithwaite D, Moore DH, Lustig RH, Epel ES, Ong KK, Rehkopf DH, et al. Socioeconomic status in relation to early menarche among black and white girls. Cancer Cause Control. 2009;20:713–20. doi: 10.1007/s10552-008-9284-9. [DOI] [PubMed] [Google Scholar]
- Burdette AM, Needham BL. Neighborhood environment and body mass index trajectories from adolescence to adulthood. J Adolescent Health. 2012;50:30–37. doi: 10.1016/j.jadohealth.2011.03.009. [DOI] [PubMed] [Google Scholar]
- Buttke DE, Sircar K, Martin C. Exposures to endocrine-disrupting chemicals and age of menarche in adolescent girls in NHANES (2003-2008) Environ Health Perspect. 2012;120:1613–1618. doi: 10.1289/ehp.1104748. [DOI] [PMC free article] [PubMed] [Google Scholar]
- Chen E, Paterson LQ. Neighborhood, family, and subjective socioeconomic status: How do they relate to adolescent health? Health Psychol. 2006;25:704–714. doi: 10.1037/0278-6133.25.6.704. [DOI] [PubMed] [Google Scholar]
- Cummins S, Macintyre S. Food environments and obesity--neighbourhood or nation? Int J Epidemiol. 2006;35:100–104. doi: 10.1093/ije/dyi276. [DOI] [PubMed] [Google Scholar]
- Daniels SR, Arnett DK, Eckel RH, Gidding SS, Hayman LL, Kumanyika S, et al. Overweight in children and adolescents: pathophysiology, consequences, prevention, and treatment. Circulation. 2005;111:1999–2012. doi: 10.1161/01.CIR.0000161369.71722.10. [DOI] [PubMed] [Google Scholar]
- Darnton-Hill I, Nishida C, James WP. A life course approach to diet, nutrition and the prevention of chronic diseases. Public Health Nutr. 2004;7:101–21. doi: 10.1079/phn2003584. [DOI] [PubMed] [Google Scholar]
- Dietz WH. Critical periods in childhood for the development of obesity. Am J Clin Nutr. 1994;59:955–959. doi: 10.1093/ajcn/59.5.955. [DOI] [PubMed] [Google Scholar]
- Diez Roux AV. Multilevel analysis in public health research. Annu Rev Publ Heal. 2000;21:171–192. doi: 10.1146/annurev.publhealth.21.1.171. [DOI] [PubMed] [Google Scholar]
- Dorsey KB, Mauldon M, Magraw R, Yu S, Krumholz HM. Do self- or parent-reported dietary, physical activity and sedentary behaviors predict worsening obesity in children? J Pediatr. 2010;157:566–571. doi: 10.1016/j.jpeds.2010.04.062. [DOI] [PMC free article] [PubMed] [Google Scholar]
- Ellen IG, Mijanovich T, Dillman KN. Neighborhood effects on health: exploring the links and assessing the evidence. J Urban Affairs. 2001;23:391–408. [Google Scholar]
- Engeland A, Bjørge T, Søgaard AJ, Tverdal A. Body mass index in adolescence in relation to total mortality: 32-year follow-up of 227 000 Norwegian boys and girls. Am J Epidemiol. 2003;157:517–523. doi: 10.1093/aje/kwf219. [DOI] [PubMed] [Google Scholar]
- Engeland A, Bjørge T, Tverdal A, Søgaard AJ. Obesity in adolescence and adulthood and risk of adult mortality. Epidemiology. 2004;15:79–85. doi: 10.1097/01.ede.0000100148.40711.59. [DOI] [PubMed] [Google Scholar]
- Fitzmaurice GM, Laird NM, Ware JH. Applied Longitudinal Analysis. 2nd edition. Hoboken, NJ: John Wiley & Sons; 2011. [Google Scholar]
- Gordon-Larsen P, Adair LS, Popkin BM. The relationship of ethnicity, socioeconomic factors, and overweight in US adolescents. Obes Res. 2003;11:121–9. doi: 10.1038/oby.2003.20. [DOI] [PubMed] [Google Scholar]
- Gordon-Larsen P, Nelson MC, Page P, Popkin BM. Inequality in the built environment underlies key health disparities in physical activity and obesity. Pediatrics. 2006;117:417–424. doi: 10.1542/peds.2005-0058. [DOI] [PubMed] [Google Scholar]
- Hedeker D, Gibbons R. Longitudinal Data Analysis. Hoboken, NJ: John Wiley & Sons; 2006. [Google Scholar]
- Hernandez DD, Pressler E. Accumulation of childhood poverty on young adult overweight or obese status: race/ethnicity and gender disparities. J Epidemiol Community Health. 2014;68:478–84. doi: 10.1136/jech-2013-203062. [DOI] [PubMed] [Google Scholar]
- Howe LD, Tilling K, Galobardes B, Smith GD, Ness AR, Lawlor DA. Socioeconomic disparities in trajectories of adiposity across childhood. Pediatr Obes. 2011;6(2-2):e144–153. doi: 10.3109/17477166.2010.500387. [DOI] [PMC free article] [PubMed] [Google Scholar]
- Janssen I, Boyce WF, Simpson K, Pickett W. Influence of individual- and area-level measures of socioeconomic status on obesity, unhealthy eating, and physical inactivity in Canadian adolescents. Am J Clin Nutr. 2006;83:139–145. doi: 10.1093/ajcn/83.1.139. [DOI] [PubMed] [Google Scholar]
- Jarrett RL. Growing up Poor: The Family Experiences of Socially Mobile Youth in Low-Income African American Neighborhoods. J Adolescent Res. 1995;10:111–135. [Google Scholar]
- Kaplowitz PB, Slora EJ, Wasserman RC, Pedlow SE, Herman-Giddens ME. Earlier onset of puberty in girls: relation to increased body mass index and race. Pediatrics. 2001;108:347–353. doi: 10.1542/peds.108.2.347. [DOI] [PubMed] [Google Scholar]
- Katz DA, Sprang G, Cooke C. The cost of chronic stress in childhood: understanding and applying the concept of allostatic load. Psychodyn Psychiatry. 2012;40:469–480. doi: 10.1521/pdps.2012.40.3.469. [DOI] [PubMed] [Google Scholar]
- Kimbro RT, Denney JT. Neighborhood context and racial/ethnic differences in young children's obesity: structural barriers to interventions. Soc Sci Med. 2012 doi: 10.1016/j.socscimed.2012.09.032. published online October 6, 2012. http://dx.doi.org/10.1016/j.socscimed.2012.09.032. [DOI] [PubMed]
- Kinra S, Baumer JH, Davey S. Early growth and childhood obesity: a historical cohort study. Arch Dis Child. 2005;90:1122–1127. doi: 10.1136/adc.2004.066712. [DOI] [PMC free article] [PubMed] [Google Scholar]
- Kinra S, Nelder RP, Lewendon GJ. Deprivation and childhood obesity: a cross sectional study of 20,973 children in Plymouth, United Kingdom. J Epidemiol Commun H. 2000;54:456–460. doi: 10.1136/jech.54.6.456. [DOI] [PMC free article] [PubMed] [Google Scholar]
- Kirby JB, Liang L, Chen HJ, Wang Y. Race, place and obesity: the complex relationship among community racial/ethnic composition, individual race/ethnicity, and obesity in the United States. Am J Public Health. 2012;102:1572–1578. doi: 10.2105/AJPH.2011.300452. [DOI] [PMC free article] [PubMed] [Google Scholar]
- Kuczmarski RJ, Ogden CL, Guo SS, Grummer-Strawn LM, Flegal KM, Mei Z, et al. 2000 CDC growth charts for the United States: methods and development. National Center for Health Statistics. Vital Health Stat. 2002;11(246) [PubMed] [Google Scholar]
- Lake A, Townshend T, Alvanides S, editors. Obesogenic environments: complexities, perceptions and objective measures. Oxford, UK: Blackwell Publishing; 2010. [Google Scholar]
- Lamerz A, Kuepper-Nybelen J, Wehle C, Bruning N, Trost-Brinkhues G, Brenner H, et al. Social class, parental education, and obesity prevalence in a study of six-year-old children in Germany. Int J Obesity. 2005;29:373–380. doi: 10.1038/sj.ijo.0802914. [DOI] [PubMed] [Google Scholar]
- Leventhal T, Dupere V, Brooks-Gunn J. Neighborhood Influences on Adolescent Development. In: Lerner RM, Steinberg L, editors. Handbook of Adolescent Psychology. Hoboken, New Jersey: John Wiley and Sons; 2009. pp. 411–443. [Google Scholar]
- Lovasi GS, Neckerman KM, Quinn JW, Weiss CC, Rundle A. Effect of individual or neighborhood disadvantage on the association between neighborhood walkability and body mass index. Am J Public Health. 2009;99:279–284. doi: 10.2105/AJPH.2008.138230. [DOI] [PMC free article] [PubMed] [Google Scholar]
- Lovasi GS, Hutson MA, Guerra M, Neckerman KM. Built environments and obesity in disadvantaged populations. Epidemiol Rev. 2009;31:7–20. doi: 10.1093/epirev/mxp005. [DOI] [PubMed] [Google Scholar]
- Mishra GD, Cooper R, Tom SE, Kuh D. Early life circumstances and their impact on menarche and menopause. Womens Health (London Engl) 2009;5:175–90. doi: 10.2217/17455057.5.2.175. [DOI] [PMC free article] [PubMed] [Google Scholar]
- Moore LV, Diez Roux AV. Associations of neighborhood characteristics with the location and type of food stores. Am J Public Health. 2006;96:325–331. doi: 10.2105/AJPH.2004.058040. [DOI] [PMC free article] [PubMed] [Google Scholar]
- Morland K, Wing S, Diez-Roux A, Poole C. Neighborhood characteristics associated with the location of food stores and food service places. Am J Prev Med. 2002;22:23–29. doi: 10.1016/s0749-3797(01)00403-2. [DOI] [PubMed] [Google Scholar]
- Morland K, Filomena S. Disparities in the availability of fruits and vegetables between racially segregated urban neighborhoods. Public Health Nutr. 2007;10:1481–1489. doi: 10.1017/S1368980007000079. [DOI] [PubMed] [Google Scholar]
- National Heart, Lung, and Blood Institute Growth and Health Study (NGHS) Research Group Obesity and cardiovascular disease risk factors in black and White girls: the NHLBI Growth and Health Study. Am J Public Health. 1992;82:1613–1620. doi: 10.2105/ajph.82.12.1613. [DOI] [PMC free article] [PubMed] [Google Scholar]
- Nelson MC, Gordon-Larsen P, Song Y, Popkin BM. Built and social environments associations with adolescent overweight and activity. Am J Prev Med. 2006;31:109–117. doi: 10.1016/j.amepre.2006.03.026. [DOI] [PubMed] [Google Scholar]
- Neuhaus JM, Kalbfleisch JD. Between- and within-cluster covariate effects in the analysis of clustered data. Biometrics. 1998;54:638–645. [PubMed] [Google Scholar]
- Nicholson LM, Browning CR. Racial and ethnic disparities in obesity during the transition to adulthood: the contingent and nonlinear impact of neighborhood disadvantage. J Youth Adolescence. 2012;41:53–66. doi: 10.1007/s10964-011-9685-z. [DOI] [PubMed] [Google Scholar]
- Oakes JM. Causal inference and the relevance of social epidemiology. Soc Sci Med. 2004;58:1969–1971. doi: 10.1016/j.socscimed.2003.05.001. [DOI] [PubMed] [Google Scholar]
- Ogden CL, Carroll MD, Curtin LR, Lamb MM, Flegal KM. Prevalence of high body mass index in US children and adolescents, 2007-2008. J Am Med Assoc. 2010;303:242–249. doi: 10.1001/jama.2009.2012. [DOI] [PubMed] [Google Scholar]
- Ogden CL, Carroll MD, Kit BK, Flegal KM. Prevalence of childhood and adult obesity in the United States, 2011-2012. JAMA. 2014;311:806–814. doi: 10.1001/jama.2014.732. [DOI] [PMC free article] [PubMed] [Google Scholar]
- Papas MA, Alberg AJ, Ewing R, Helzlsouer KJ, Gary TL, Klassen AC. The built environment and obesity. Epidemiol Rev. 2007;29:129–143. doi: 10.1093/epirev/mxm009. [DOI] [PubMed] [Google Scholar]
- Robert SA, Reither EN. A multilevel analysis of race, community disadvantage, and body mass index among adults in the US. Soc Sci Med. 2004;59:2421–34. doi: 10.1016/j.socscimed.2004.03.034. [DOI] [PubMed] [Google Scholar]
- Rickets RR, Sawhill IV. Defining and measuring the underclass. J Policy Anal Manag. 1988;7:316–325. [Google Scholar]
- Robinson WR, Stevens J, Kaufman JS, Gordon-Larsen P. The role of adolescent behaviors in the female-male disparity in obesity incidence in US black and white young adults. Obesity. 2009;18:1429–36. doi: 10.1038/oby.2009.362. [DOI] [PMC free article] [PubMed] [Google Scholar]
- Romon M, Duhamel A, Collinet N, Weill J. Influence of social class on time trends in BMI distribution in 5-year-old French children from 1989 to 1999. Int J Obesity. 2005;29:54–59. doi: 10.1038/sj.ijo.0802788. [DOI] [PubMed] [Google Scholar]
- Ruel RE, Reither EN, Robert SA, Lantz PM. Neighborhood effects on BMI trends: examining trajectories for Black and White women. Health Place. 2010;19:191–198. doi: 10.1016/j.healthplace.2009.09.009. [DOI] [PMC free article] [PubMed] [Google Scholar]
- Sampson RJ, Raudenbush SW, Earls F. Neighborhoods and violent crime: a multilevel study of collective efficacy. Science. 1997;277:918–924. doi: 10.1126/science.277.5328.918. [DOI] [PubMed] [Google Scholar]
- Scharoun-Lee M, Kaufman JS, Popkin BM. Obesity, race/ethnicity and life course socioeconomic status across the transition from adolescence to adulthood. J Epidemiol Community Health. 2009;63:133–9. doi: 10.1136/jech.2008.075721. [DOI] [PMC free article] [PubMed] [Google Scholar]
- Shrewsbury V, Wardle J. Socioeconomic status and adiposity in childhood: a systematic review of cross-sectional studies 1990-2005. Obesity (Silver Spring) 2008;16:275–84. doi: 10.1038/oby.2007.35. Review. [DOI] [PubMed] [Google Scholar]
- Stamatakis E, Primatesta P, Chinn S, Rona R, Falascheti E. Overweight and obesity trends from 1974 to 2003 in English children: what is the role of socioeconomic factors? Arch Dis Child. 2005;90:999–1004. doi: 10.1136/adc.2004.068932. [DOI] [PMC free article] [PubMed] [Google Scholar]
- Strauss RS, Knight J. Influence of the home environment on the development of obesity in children. Pediatrics. 1999;103:e85. doi: 10.1542/peds.103.6.e85. [DOI] [PubMed] [Google Scholar]
- Tanner JM. Growth at Adolescence. 2nd edition. Oxford, United Kingdom: Blackwell Scientific Publications; 1992. [Google Scholar]
- Taylor CB, Sharpe T, Shisslak C, Bryson S, Estes LS, Gray N, et al. Factors associated with weight concerns in adolescent girls. Int J Eat Disord. 1998;24:31–42. doi: 10.1002/(sici)1098-108x(199807)24:1<31::aid-eat3>3.0.co;2-1. [DOI] [PubMed] [Google Scholar]
- Verbeke G, Molenberghs G. Linear Mixed Models for Longitudinal Data. Berlin: Springer-Verlag; 2000. [Google Scholar]
- Wall MM, Larson NI, Forsyth A, Van Riper DC, Graham DJ, Story MT, et al. Patterns of obesogenic neighborhood features and adolescent weight: a comparison of statistical approaches. Am J Prev Med. 2012;42:e65–e75. doi: 10.1016/j.amepre.2012.02.009. [DOI] [PMC free article] [PubMed] [Google Scholar]
- Wang MC, Kim S, Gonzalez AA, MacLeod KE, Winkleby MA. Socioeconomic and food-related physical characteristics of the neighbourhood environment are associated with body mass index. J Epidemiol Commun H. 2007;61:491–498. doi: 10.1136/jech.2006.051680. [DOI] [PMC free article] [PubMed] [Google Scholar]
- Wang Y, Beydoun MA. The obesity epidemic in the United States – gender, age, socioeconomic, racial/ethnic, and geographic characteristics: a systematic review and meta-regression analysis. Epidemiol Rev. 2007;29:6–28. doi: 10.1093/epirev/mxm007. [DOI] [PubMed] [Google Scholar]
- Wang Y, Zhang Q. Are American children and adolescents of low socioeconomic status at increased risk of obesity? Changes in the association between overweight and family income between 1971 and 2002. Am J Clin Nutr. 2006;84:707–16. doi: 10.1093/ajcn/84.4.707. [DOI] [PubMed] [Google Scholar]
- Whitaker RC, Wright JA, Pepe MS, Seidel KD, Dietz WH. Predicting obesity in young adulthood from childhood and parental obesity. New Eng J Med. 1997;337:869–873. doi: 10.1056/NEJM199709253371301. [DOI] [PubMed] [Google Scholar]
- Wickrama KAT, Wickrama KAS, Bryant CM. Community influence on adolescent obesity: race/ethnic differences. J Youth Adolescence. 2006;35:647–657. [Google Scholar]
- Williams DR, Collins C. US Socioeconomic and Racial Differences in Health: Patterns and Explanations. Annual Review of Sociology. 1995;21:349–386. [Google Scholar]
- World Health Organization Prevalence of overweight and obesity in children and adolescents. [Accessed November 22, 2013];Fact Sheet 2.3. 2009 at http://www.euro.who.int/__data/assets/pdf_file/0005/96980/2.3.-Prevalence-of-overweight-and-obesity-EDITED_layouted_V3.pdf.
- Zhang Q, Wang Y. Trends in the association between obesity and socioeconomic status in U.S. adults: 1971 to 2000. Obes Res. 2004;12:1622–32. doi: 10.1038/oby.2004.202. [DOI] [PubMed] [Google Scholar]