

SUMMARY
MR spectroscopy is a noninvasive technique that allows the detection of several naturally occurring compounds (metabolites) from well-defined regions of interest within the human brain. Alzheimer disease, a progressive neurodegenerative disorder, is the most common cause of dementia in the elderly. During the past 20 years, multiple studies have been performed on MR spectroscopy in patients with both mild cognitive impairment and Alzheimer disease. Generally, MR spectroscopy studies have found decreased N-acetylaspartate and increased myo-inositol in both patients with mild cognitive impairment and Alzheimer disease, with greater changes in Alzheimer disease than in mild cognitive impairment. This review summarizes the information content of proton brain MR spectroscopy and its related technical aspects, as well as applications of MR spectroscopy to mild cognitive impairment and Alzheimer disease. While MR spectroscopy may have some value in the differential diagnosis of dementias and assessing prognosis, more likely its role in the near future will be predominantly as a tool for monitoring disease response or progression in treatment trials. More work is needed to evaluate the role of MR spectroscopy as a biomarker in Alzheimer disease and its relationship to other imaging modalities.
MR spectroscopy is a noninvasive technique that permits the estimation of the concentrations of various compounds (metabolites) in the human brain in vivo. To be detectable by in vivo MR spectroscopy, a compound must be a relatively small molecule present in at least the low-millimolar concentration range. MR spectroscopy may be performed by using the signals from a number of different nuclei, including phosphorus (31P), carbon (13C), and fluorine (19F),1 but 1H-MR spectroscopy (proton MR spectroscopy) has become the most prevalent since the early 1990s because of its higher signal sensitivity, better spatial resolution, and the fact that (unlike other nuclei) no special hardware beyond that found on standard MR imaging scanners is required.2 During the past 2 decades, numerous studies have used 1H-MR spectroscopy to study both Alzheimer disease (AD) and mild cognitive impairment (MCI). This article reviews the information content of 1H-MR brain spectra, gives an update on the current methods used to collect MR spectroscopy (and MR spectroscopic imaging [MRSI]) data, and describes the results of MR spectroscopy research studies in patients with MCI and AD.
Brain Metabolites Detectable by In Vivo MR Spectroscopy
Various metabolites are detectable at 1.5 or 3T with 1H-MR spectroscopy in normal brain, including the prominent resonances of total NAA (tNAA), trimethylamines (TMA), total creatine (tCr), and signals from myo-inositol (mI), glutamate (Glu), and glutamine. Lactate is not usually seen in normal brain but is detectable in pathologies that cause its concentration to increase. Using special techniques (ie, spectral editing), one can detect other compounds such as γ-aminobutyric acid (GABA) and glutathione. The following is a description of the metabolites that have been the main interest to date in studies of AD and MCI:
tNAA (2.01-ppm singlet), which is estimated to have a healthy adult brain concentration on the order of 10–12 mmol/L, is usually the largest signal in the spectrum.3 NAA is an amino acid synthesized in neuronal mitochondria from aspartate and acetylcoA and is primarily seen in neurons, axons, and dendrites within the central nervous system.4 Therefore, NAA is commonly referred to as a “neuronal marker,” indicative of neuronal density and viability. However, some in vitro studies have shown that NAA can also be found in immature oligodendrocytes and astrocyte progenitor cells.5 Furthermore, some longitudinal studies suggested that NAA undergoes reversible changes in patients, suggesting it can vary for reasons other than neuronal density.6,7 Overall, the balance of evidence suggests that NAA is present predominantly in neurons and that it is a reasonably good surrogate marker of neuronal health in many neurologic and psychiatric disorders. The peak detected by MR spectroscopy also contains a small contribution from N-acetyl aspartylglutamate, so for this reason, it is sometimes referred to as total N-acetyl aspartate (tNAA). In addition, in certain rare diseases, it is thought that the tNAA peak may also contain contributions from N-acetyl neuraminic acid (sialic acid) and uridine-diphosphate-N-acetyl-sugars.8
TMA (3.20-ppm singlet) are a composite peak predominantly containing contributions from glycerophosphorylcholine (a product of the breakdown of membrane phosphatidylcholine) and phosphocholine (a precursor of phosphatidylcholine). There may also be small contributions from free choline, acetylcholine, carnitine, and acetyl-L-carnitine. Since phosphocholine and glycerophosphorylcholine are involved in both the synthetic and degradation pathways of cell membranes, the amplitude of the TMA peak is sometimes thought to be related to membrane turnover.9 In addition, it has been shown that glial cells have high levels of TMA.10
tCr (3.01-ppm singlet, 3.9-ppm singlet) consists of the sum of creatine and phosphocreatine, which are energy metabolites. tCr is frequently used as an “internal reference” to quantify other neurochemicals. However, in normal brain, lower levels of tCr are found in white matter than in gray matter, and higher levels of tCr are found in the cerebellum compared with supratentorial regions. Some studies have suggested that tCr levels increase slowly with age.11 Therefore, the assumption of constant tCr when used as an internal reference should be viewed with caution. mI (3.3-, 3.5-, and 4.0-ppm multiplets) is a sugar alcohol containing contributions from free mI and mI phosphate.12 mI is readily detectable in short (eg, ≤35 ms) TE spectra; however, it is usually not detectable at long TEs. Because mI has been suggested to be higher in glial cells than in neurons,13,14 mI is often considered as a “glial cell marker.” mI also may act as a marker of a detoxification agent or it may be an osmoregulator or intracellular messenger.12,13,15
Glu and glutamine (2.1–2.4- and 3.7-ppm multiplets) structures are complex; hence, their peaks are difficult to separate, both from each other and from other compounds. Therefore, they are frequently detected as a composite “Glx” peak.16 Glu is the major excitatory neurotransmitter in the brain, and glutamine may play a role in detoxification and regulation of its precursor, Glu, within the astrocyte body.12 It has been suggested that the Glu signal in brain 1H-MR spectroscopy primarily reflects the intracellular compartment.
GABA (1.9-, 2.3-, and 3.0-ppm multiplets) is the primary inhibitory neurotransmitter in the brain.17 However, it is difficult to detect GABA by using conventional 1H-MR spectroscopy because resonances of GABA overlap with other metabolites such as tCr, Glu, tNAA, and macromolecules. In addition, normal brain GABA concentrations are at relatively low levels (1.3–1.9 mmol/ kgwet weight).18 For these reasons, most MR spectroscopy studies to date have used spectral-editing methodologies to reliably detect GABA free from contamination from larger overlapping signals.
Methods for In Vivo MR Spectroscopy in the Human Brain
Spatial localization methods for 1H-MR spectroscopy consist of single-voxel techniques, in which spectral data are acquired from 1 location at a time, or multivoxel techniques. In multivoxel spectroscopy, referred to as MRSI or chemical shift imaging, spectra from multiple regions are acquired simultaneously.
Single-Voxel Techniques
The 2 most commonly used single-voxel MR spectroscopy techniques are known as the point-resolved spectroscopy sequence (PRESS)19 and STEAM.20 Both techniques use 3 mutually orthogonal section-selective pulses and design the pulse sequence to collect only an echo signal from the point (voxel) in space where all 3 sections intersect. In the STEAM sequence, three 90° pulses are used to provide a so-called “stimulated echo,” whereas in the PRESS sequence, one 90° and two 180° refocusing pulses are applied to create a spin-echo. STEAM and PRESS are generally similar but differ in some respects. The biggest difference is that the PRESS should have approximately a factor-of-2 better signal-to-noise ratio than STEAM and is therefore commonly used. However, it is possible to achieve shorter TE values in STEAM than PRESS (which is important for detecting metabolites with short T2 relaxation times), and the 90° section-selective pulses in STEAM give better voxel profiles compared with the 180° section-selective refocusing pulses used in PRESS. In addition, STEAM may be particularly useful for high-field brain MR spectroscopy. Figure 1 shows both short and long TE spectra recorded using the PRESS and STEAM sequences in 2 patients with AD.
FIG 1.

3T MR spectroscopy in 2 patients with AD. A, PRESS (TR, 2000 ms; TE, 35 and 144 ms) in a 71-year-old man. B, STEAM (TR, 2000 ms; TE, 9 and 144 ms) in a 57-year-old man. The white box represents the location of the VOI (3 × 3 × 3 cm3) in the mesial frontal region. The lower SNR of the STEAM spectra is apparent.
Although widely used, STEAM and PRESS do have some limitations, particularly when used at high magnetic field strengths (eg, 3T or higher). Due to wavelength effects in volume radio-frequency coils21 or when using inhomogeneous surface coils for excitation, it may be difficult to obtain uniform radiofrequency transmit (B1) fields. This then results in misadjustment of flip angles and variation of the flip angles within the voxel, resulting in suboptimal excitation. The localization by adiabatic-selective re-focusing (LASER) sequence22 or its modified version “semi-LASER,” has been applied to solve these problems.23,24 The LASER sequence is a modification of the PRESS sequence by using adiabatic (usually hyperbolic secant) refocusing pulses. It consists of a non-section-selective adiabatic half-passage 90° pulse for excitation, and 3 pairs of hyperbolic secant refocusing pulses in 3 directions for localization. Compared with STEAM or PRESS, a more uniform excitation profile and decreased chemical shift displacement errors may be achieved in the LASER sequence.25 However, compared with the PRESS sequence, the radiofrequency power deposition is higher and the minimum TE is longer, due to the large number of radiofrequency pulses. The semi-LASER sequence consists of a nonadiabatic 90° section-selective pulse and 2 pairs of adiabatic hyperbolic secant pulses for refocusing. Semi-LASER has lower radiofrequency power deposition and shorter TEs than LASER, but some insensitivity to B1 inhomogeneity is lost.25
The “SPECIAL” consists of a section-selective inversion pulse followed by a spin-echo sequence, with each pulse applied in a different direction.26 The sequence combines the short TE achievable with STEAM with the full signal intensity provided by PRESS. The sequence collects full-intensity signal from a column defined by the intersection of the selected sections of the 90° and 180° pulses.25 The section-selective inversion pulse is applied to every other TR, so that a minimum of 2 scans is required to achieve full spatial localization.25 The main limitation of spin-echo full-intensity acquired localized spectroscopy is that it is not a “single-shot” localization method and is, therefore, potentially susceptible to head motion or other instabilities, possibly leading to localization errors.
Multiple-Voxel (Spectroscopic Imaging) Techniques
Single-voxel MR spectroscopy is readily available on nearly all MR imaging scanners, is rapid and relatively easy to perform, and has been used in most AD studies to date. However, single-voxel MR spectroscopy studies are very limited in terms of both coverage and spatial resolution. For instance, single-voxel MR spectroscopy studies of the brain are often limited to 1 or 2 regions and therefore cannot assess the spatial distribution of metabolites. In contrast, MRSI can provide an assessment of the spatial distribution of the various metabolites in addition to their relative concentrations within a voxel.
MRSI can be acquired in 2D27,28 or 3D and generally offers superior spatial resolution (<1 cm3) compared with single-voxel spectroscopy. An example of 1 section from a multisection 2D MRSI dataset from a patient with MCI is shown in Fig 2. Generally, 1H-MRSI is acquired from a volume that is prelocalized by using either PRESS or STEAM; however, as in the example in Fig 2, it is also possible to acquire 1H-MRSI with only section (or 3D slab) localization. 2D or 3D MRSI with conventional phase-encoding techniques involves long acquisition times, particularly if high spatial resolution and coverage are desired. Therefore, a number of approaches for fast MRSI have been developed, such as echo-planar spectroscopic imaging, spiral MRSI, and sensitivity encoded (SENSE) MRSI.
FIG 2.
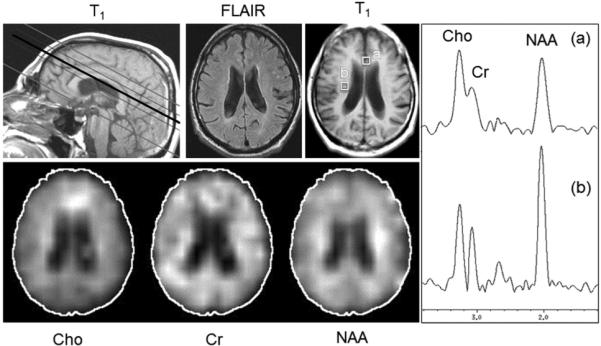
Long TE multisection MRSI (TR, 2300 ms; TE; 280 ms; 15-mm section thickness; 32 × 32 in-plane resolution; 4 sections; 1.5T) in a 72-year-old man with a diagnosis of MCI. Metabolic images from the third of 4 sections show mildly reduced NAA in a diffuse distribution, with relative preservation of NAA bilaterally in the corticospinal tracts. Cho is mildly increased in the mesial frontal regions compared with other brain regions. Selected spectra from the anterior cingulate (a) and corticospinal tract (b) show the relative amplitudes of the Cho, Cr, and NAA signals in these regions.
Echo-planar spectroscopic imaging is one of the fastest acquisition techniques for MRSI. An oscillating read gradient is applied during data readout with each data point in the time-domain corresponding to a bipolar lobe of the read gradient, thus both spectral and spatial information can be collected simultaneously.29 The oscillating read gradient can be viewed as repeatedly collecting 1 line of k-space at different time points. Conventional phase-encoding is then applied in the other 1 or 2 directions to extend the experiment to either 2 or 3 spatial dimensions, respectively. The echo-planar spectroscopic imaging readout reduces the number of phase-encoding steps by an order of magnitude compared with conventional MRSI, thereby achieving a large scan time reduction. Echo-planar spectroscopic imaging encoding can be implemented with slab-, multisection-, or PRESS-based excitation.30 As an alternative to echo-planar spectroscopic imaging, spiral-encoded MRSI also applies a field gradient during data acquisition, but unlike echo-planar spectroscopic imaging, it traverses k-space in an in-to-out spiral pattern.31 Spiral-encoded MRSI has a number of potential advantages compared with the rectilinear k-t sampling pattern of echo-planar spectroscopic imaging, including being less demanding on gradient performance, but to date, it has not been widely adopted for clinical applications.
SENSE-encoded MRSI combines MRSI with reduced phase-encoding, multiple receiver coils, and “parallel” reconstruction techniques (as in parallel MR imaging)32 to reduce scan time. The basic principle of the parallel imaging technique is to use the inhomogeneous B1 fields of multiple, phased-array coils to encode some of the spatial information, thereby allowing fewer conventional phase-encoding steps to be used, hence reducing scan time. In SENSE-encoded MRSI, Fourier transformation of under-sampled k-space data leads to aliased spectroscopic images from each receiver channel, which can then be unfolded and reconstructed by using the sensitivity profile of each coil to produce a single spectroscopic image with uniform sensitivity. An attractive feature of sensitivity encoding is that it can be combined with any existing MRSI pulse sequence, so that there are no pulse sequence–related SNR losses, unlike those that can potentially occur with other fast MRSI methods.33 2D and 3D MRSI involve phase-encoding in multiple directions, so SENSE-encoding can also be performed in 2D or 3D (provided that receive arrays with appropriate geometry are available), leading to large scan time reductions.34
Spectral Editing Techniques
Although spectral editing can be performed in a number of different ways, currently the Mescher-Garwood (MEGA)-PRESS is the most widely used method, usually for the measurement of GABA at 3T. MEGA-PRESS combines PRESS localization with 2 frequency-selective editing pulses (which can also act to suppress water signal),35 which are alternately turned “on” and “off” in an interleaved fashion throughout the acquisition. For the detection of GABA, usually the frequency-selective editing pulse is placed at 1.9 ppm in the “on” (even) acquisition, and the “off” acquisition actually applies the pulse symmetrically on the opposite side of the water peak (4.7 ppm) at 7.5 ppm. Because the GABA resonance at 1.9 ppm is coupled to the 3.0-ppm resonance, the resulting edited spectrum (derived from the difference between the “on” and “off” spectra) shows a peak at 3.0 ppm, while overlapping resonances are suppressed.
Other, less frequently used “editing” techniques for coupled molecules, include the 2D J-PRESS method,36,37 chemical shift selective filter,38 constant time PRESS,39 TE-averaged PRESS,40 and maximum-echo sampling methods.37 Some of these methods may also be combined with MRSI, for instance a 2D MRSI TE-averaged PRESS technique was used to generate Glu maps.41 Recently, with the advent of techniques for speeding up MRSI acquisitions such as compressed sensing, it has become possible to perform multidimensional MRSI scans (2 spectral, 3 spatial), which have promise for mapping compounds that are difficult to observe with conventional MRSI techniques.42
Currently, nearly all the techniques mentioned above, other than STEAM, PRESS, and conventional MRSI, are not commercially available and therefore are only performed by research groups with access to these methodologies.
High-Field MR Spectroscopy
Spectral SNR and chemical shift resolution increase with increasing magnetic field strength (B0), though the SNR increase may sometimes be less than the linear improvement predicted by theory.43 This outcome is most likely explained by the increase in spectral line widths with increasing B0. While field homogeneity is usually measured from voxel water line widths, typical metabolite (eg, for Cr or NAA) line widths in the human brain are 3.5 Hz at 1.5T, 5.5 Hz at 4T, and 9.5 Hz at 7T.44 The metabolite line width also depends on B0 field homogeneity and metabolite T2 relaxation time. It has been found that metabolite T2 relaxation times measured in vivo decrease with increasing B0.45 For instance, the T2 of NAA drops from approximately 300–450 ms at 1.5T43,46,47 to 210–300 ms at 3T,43,48 to 185–230 ms at 4T,45 and 140 ms at 7T.44 Therefore, high-field MR spectroscopy is best performed at short TEs (such as ≤35 ms). Despite increasing line width, improved SNR and chemical resolution of spectra are shown at 7T compared with 3T, and 3T compared with 1.5T.43,44 Moreover, resonances from coupled spin systems such as GABA, Glu, and glutamine are better demonstrated at high field. Therefore, performing MR spectroscopy studies at the highest field available is recommended.
Spectroscopic Applications in MCI and AD
AD is the most common cause of dementia; MCI is the transitional state between normal aging and AD. The articles discussed below were the result of a PubMed search by using the phrases “Alzheimer disease or mild cognitive impairment” and “MR spectroscopy.” The search was restricted to the English language (181 results). The articles discussed are classified into the following categories: diagnosis, differential diagnosis, therapy, and other applications.
Diagnosis
The Table shows methodologic details and results of studies that compared AD, MCI, and healthy controls. Reduction of NAA levels compared with age-matched healthy controls was the most frequent 1H-MRS finding in AD.49,50 Reduced NAA/Cr ratios have been shown in the posterior cingulate gyrus, mesial temporal lobe, occipital lobe, parietal lobe, and frontal lobe.51-62 The “absolute” concentration of NAA was also decreased in the parietal lobe, occipital lobe, mesial temporal lobe, frontoparietal region, and hippocampus.63-69 These results are consistent with in vitro studies performed on postmortem AD brains, which showed that NAA decreases correlated with the severity of neuropathologic findings, such as amyloid plaques, neurofibrillary tangles, and the presence of apolipoprotein E genetic markers.60 Therefore, reduction of NAA levels might reflect either a loss of the neuronal cells or neuronal function, or both.
MRS application in AD diagnosisa
| Reference | Method | Field (T) | Region | Application | Finding (AD versus NC) |
|---|---|---|---|---|---|
| Watanabe et al69 | PRESS | 1.5 | Hippocampus, PCG, occipital lobe | AD, MCI, NC | NAA ↓ mI ↑ TMA ↓ tCr ↓ ★ |
| Kantarci et al60 | PRESS | 1.5 | PCG | AD, postmortem | NAA ↓ mI ↑ TMA → |
| Block et al53 | 2D-MRSI | 1.5 | Hippocampus, temporal lobe, occipital lobe | AD, NC | NAA ↓ TMA → |
| Kantarci et al61 | PRESS | 1.5, 3.0 | PCG | AD, MCI | NAA ↓ mI ↑ TMA ↑ Glx → |
| Chantal et al54 | PRESS | 1.5 | MTL, prefrontal cortex, and parietotemporal | AD, NC | NAA ↓ TMA ↓ mI ↑ ★ |
| Hattori et al58 | PRESS | 3.0 | PCG, parieto-occipital white matter | AD, NC | NAA ↓ Glx ↓ |
| Jessen et al67 | PRESS | 1.5 | MTL | AD, NC | NAA ↓ TMA → tCr → ★ |
| Garcia Santos et al55 | PRESS | 1.5 | PCG | AD, MCI, NC | NAA ↓ TMA → mI → |
| Hancu et al57 | J-PRESS | 3.0 | PCG | AD, NC | NAA ↓ Glu → |
| Dixon et al63 | STEAM | 2.0 | Hippocampus | AD, NC | NAA ↓ ★ |
| Schott et al62 | PRESS | 1.5 | PCG | AD, NC | NAA ↓ mI ↑ TMA → |
| Antuono et al52 | PRESS | 0.5 | PCG | AD, NC | NAA ↓ mI ↑ TMA → Glx ↓ |
| Godbolt et al56 | PRESS | 1.5 | PCG | AD, NC | NAA ↓ mI ↑ |
| Jessen et al66 | PRESS | 1.5 | MTL | AD, MCI, NC | NAA ↓ TMA ↓ tCr ↓ ★ |
| Siger et al70 | 2D-MRSI | 1.5 | Frontal WM, parietal WM | AD, MCI, NC | NAA ↓ mI ↑ |
| Ackl et al51 | PRESS | 1.5 | Parietal WM, parietal GM, hippocampus | AD, MCI, NC | NAA2 mI1 |
| Falini et al64 | WBNAA | 1.5 | Whole brain | AD, MCI, NC | NAA ↓ ★ |
| Frederick et al71 | PRESS | 1.5 | Temporal lobe | AD, MCI, NC | NAA ↓ mI → TMA → |
| Christiansen et al93 | STEAM | 1.5 | Hippocampus | AD, NC | T2 values ↓ |
| Chantal et al77 | PRESS | 1.5 | MTL, prefrontal cortex, and parietotemporal | AD, MCI, NC | NAA ↓ TMA ↓ mI ↑ ★ |
| Huang et al65 | STEAM | 1.5 | Parietal lobe, occipital lobe | AD, NC | NAA ↓ mI ↑ TMA → tCr ↑ ★ |
| Schuff et al68 | 2D-MRSI | 1.5 | Frontoparietal region | AD, NC | NAA ↓ TMA → tCr → ★ |
| Parnetti et al72 | STEAM | 1.5 | Temporal GM, frontal WM | AD, NC | NAA ↓ TMA → mI ↑ tCr → ★ |
| Frederick et al94 | STEAM | 1.5 | Parietal lobe, temporal lobe | AD, NC | NAA ↓ TMA → |
| Jessen et al59 | PRESS | 1.5 | Parietal GM, MTL | AD, NC | NAA ↓ TMA ↓ |
| Rose et al73 | STEAM | 2.0 | Parietal midline | AD, NC | NAA ↓ mI ↑ TMA → tCr → |
| Kantarci et al74 | PRESS | 1.5 | PCG, temporal lobe, occipital lobe | AD, MCI, NC | NAA ↓ mI ↑ TMA ↑ |
| Haley et al95 | STEAM | 1.5 | Frontal WM | AD, NC | NAA ↓ TMA → |
| MacKay et al75 | 2D-MRSI | 2.0 | GM, WM | AD, NC | NAA ↓ TMA ↑ |
| Schuff et al76 | 2D-MRSI | 1.5 | Hippocampus | AD, NC | NAA ↓ mI ↑ TMA ↑ |
Note:—NC indicates healthy control; PRESS-J, TE-averaged PRESS; MTL, mesial temporal lobe; WBNAA, Whole-brain NAA; ↑, significantly increased; ↓, significantly decreased; →, no significant differences; NC, normal controls; PCG, posterior cingulate gyrus.
Metabolite concentrations are ratios to tCr, unless a star indicates that the metabolite level has been calculated by reference to the water signal instead.
Increases of mI have also been reported in several anatomic locations in AD, indicative of increased glial cell content. Increased mI has been reported most often in the posterior cingulate gyrus, temporal-parietal area, parietal white matter and occipital lobes.51,60,61,65,70 However, 2 studies reported no significant differences in mI levels between patients with AD and healthy controls.55,71 Some researchers have used the ratio of NAA/mI to increase the sensitivity of 1H-MR spectroscopy to metabolite changes in AD.61,72,73 The NAA/mI ratio has been shown to be the more accurate MR spectroscopic measurement to differentiate patients with AD from healthy elderly.
There are conflicting reports on the TMA level in patients with AD. Some studies showed elevated TMA levels in AD,61,74-76 while others report decreased TMA levels66,69,77 or no change.53,60,62 It has been suggested that these disparate findings may be the result of possible apolipoprotein E allele effects on membrane metabolism or breakdown, differences in MR spectroscopy methods (in particular TE), or variations in anatomic voxel placement.68
While the tCr peak is generally thought to be stable in AD, some studies have demonstrated decreased tCr levels in patients with AD versus healthy controls in the occipital lobe69 and in creased tCr levels in the parietal and occipital lobes.65
The Glx peak has only been investigated in a few studies; these have mostly reported reduced Glx levels in patients with AD compared with controls in the posterior cingulate gyrus and parieto-occipital white matter,58 though 1 study reported no difference in Glx between patients with AD and healthy controls.61
Finally, 1 study demonstrated decreased levels of glutathione in the right frontal cortex of female patients with AD compared with healthy female controls and decreased glutathione levels in the left frontal cortex of male patients with AD.78 In this study, the glutathione level also showed a trend toward reduction in patients with MCI compared with healthy subjects, though the difference was not statistically significant.78
Generally, metabolic differences between patients with AD, MCI, and controls are fairly small, and appreciable scatter (overlap) exists between groups. Therefore, MR spectroscopy in isolation usually cannot be used in individual subjects for the diagnosis of AD. Metabolite concentrations should be corrected for CSF contamination because brain atrophy is typically very significant in both the elderly healthy control population and particularly in patients with AD.
Differential Diagnosis
A number of studies have compared subcortical ischemic vascular dementia with AD. mI/tCr was found to be higher, and tNAA/tCr, lower, in patients with AD compared with those with subcortical ischemic vascular dementia.79,80 It has been reported that there is a significant correlation between Mini-Mental State Examination score and tNAA/mI and tNAA/tCr in patients with AD but that patients with subcortical ischemic vascular dementia showed no correlations.81 In 1 study of AD and frontotemporal dementia, tNAA/tCr was reduced in the posterior cingulate gyrus in both patients with AD and frontotemporal dementia; however, the patients with AD showed a posterior dominant decrease, whereas there was a frontal predominant decrease in the patients with frontotemporal dementia,82 while another study found no significant metabolic differences between AD and frontotemporal dementia in the posterior cingulate gyrus.79 However, it was found that tNAA/tCR was higher in patients with dementia with Lewy bodies than AD in the posterior cingulate gyrus.79 Finally, 1 study found that MR spectroscopy can differentiate between AD and MCI, with the strongest effect seen with the tNAA/tCr ratio in the left occipital cortex, but it could not differentiate between different types of MCI categorized according to the suspected underlying pathology (eg, neurodegeneration, vascular, or dysphoric or dysthymic disorders).83
Effects of Therapy
A number of studies have investigated the effect of the acetylcholinesterase inhibitor donepezil in AD.84-87 It was found that tNAA and tNAA/tCr tended to be higher in the donepezil-treated patients compared with a placebo,86 although 1 study found that tNAA, TMA, tNAA/tCr, TMA/tCr, and mI/tCr were all decreased in patients with AD after treatment.84 An MRSI study of the muscarinic acetylcholine receptor agonist xanomeline found no metabolic differences before or after treatment in either study drug or placebo groups but did find a positive correlation between parietal lobe gray matter TMA/tCr ratio and cognitive performance.88 Finally, in a small trial (n = 10) of the alkaloid galantamine, levels of Glu and Glu/tCr in the right hippocampus increased after 4 months of treatment, and these changes were associated with increased cognitive performance.89
Other Applications
One study of MCI and patients with early AD found correlations between various cognitive measures (eg, verbal learning performance, memory) and cortical metabolite ratios.90 Another compared MR spectroscopy and diffusion tensor imaging findings and found a positive correlation between mI/tCr and fractional anisotropy values and a negative correlation between tNAA/tCr and mean diffusivity values in patients with AD.91 Finally, in a study of 15 control subjects and 22 patients with AD, it was reported that correlations exist between elevated basal ganglia TMA signal and poorer performance on learning tasks, with more significant findings in male patients with AD, suggesting sex-specific effects.92
CONCLUSIONS
Although an abundance of studies have shown metabolic changes in the brain in subjects with MCI and AD, at present, MR spectroscopy is little used in the clinical evaluation of subjects with dementia. This is probably due to several reasons, including lack of standardized methodology, overlap of spectral patterns between different pathologies (ie, relative lack of specificity), lack of reimbursement, and lack of treatment options in most dementias. Arguably the most important role for MR spectroscopy may be in predicting the development of dementia in patients with MCI, information that is highly valued by patients and their families. The relative value of MR spectroscopy, performed with the best available contemporary methods, needs further evaluation in this regard; its performance should be compared with other imaging measures from MR imaging and positron-emission tomography, in particular amyloid imaging methods, as well as other biomarkers and clinical testing. For the time being, MR spectroscopy may find a greater role as a surrogate marker of brain metabolic health in clinical trials, perhaps both for patient selection and monitoring outcome.
Acknowledgments
This work was supported, in part, by National Institutes of Health grant P41EB015909.
ABBREVIATIONS
- AD
Alzheimer disease
- GABA
γ-aminobutyric acid
- Glu
glutamate
- 1H-MR spectroscopy
proton MR spectroscopy
- LASER
localization by adiabatic selective refocusing
- MCI
mild cognitive impairment
- mI
myo-inositol
- MRSI
MR spectroscopic imaging
- PRESS
point-resolved spectroscopy sequence
- SENSE
sensitivity encoded
- tCr
total creatine
- tNAA
total N-acetyl aspartate
- TMA
trimethylamines
Footnotes
Disclosures: Peter B. Barker—UNRELATED: Consultancy: I am a consultant for Olea Medical for the development of a commercial MR spectroscopy data analysis software package.
REFERENCES
- 1.Mueller SG, Schuff N, Weiner MW. Evaluation of treatment effects in Alzheimer's and other neurodegenerative diseases by MRI and MRS. NMR Biomed. 2006;19:655–68. doi: 10.1002/nbm.1062. [DOI] [PMC free article] [PubMed] [Google Scholar]
- 2.Barker PB, Lin DD. In vivo proton MR spectroscopy of the human brain. Prog Nucl Magn Reson Spectrosc. 2006;49:99–128. [Google Scholar]
- 3.Valenzuela MJ, Sachdev P. Magnetic resonance spectroscopy in AD. Neurology. 2001;56:592–98. doi: 10.1212/wnl.56.5.592. [DOI] [PubMed] [Google Scholar]
- 4.Simmons ML, Frondoza CG, Coyle JT. Immunocytochemical localization of N-acetyl-aspartate with monoclonal antibodies. Neuroscience. 1991;45:37–45. doi: 10.1016/0306-4522(91)90101-s. [DOI] [PubMed] [Google Scholar]
- 5.Urenjak J, Williams SR, Gadian DG, et al. Specific expression of N-acetylaspartate in neurons, oligodendrocyte-type-2 astrocyte progenitors, and immature oligodendrocytes in vitro. J Neurochem. 1992;59:55–61. doi: 10.1111/j.1471-4159.1992.tb08875.x. [DOI] [PubMed] [Google Scholar]
- 6.De Stefano N, Matthews PM, Arnold DL. Reversible decreases in N-acetylaspartate after acute brain injury. Magn Reson Med. 1995;34:721–27. doi: 10.1002/mrm.1910340511. [DOI] [PubMed] [Google Scholar]
- 7.Mader I, Roser W, Kappos L, et al. Serial proton MR spectroscopy of contrast-enhancing multiple sclerosis plaques: absolute metabolic values over 2 years during a clinical pharmacological study. AJNR Am J Neuroradiol. 2000;21:1220–27. [PMC free article] [PubMed] [Google Scholar]
- 8.Pettegrew JW, McClure RJ, Panchalingam K. Spectroscopic imaging of schizophrenia. In: Shenton ME, Turetsky BI, editors. Understanding Neupsychiatric Disorders: Insights from Neuroimaging. Cambridge University Press; New York: 2011. pp. 48–77. [Google Scholar]
- 9.Loos C, Achten E, Santens P. Proton magnetic resonance spectroscopy in Alzheimer's disease: a review. Acta Neurol Belg. 2010;110:291–98. [PubMed] [Google Scholar]
- 10.Gill SS, Small RK, Thomas DG, et al. Brain metabolites as 1H NMR markers of neuronal and glial disorders. NMR Biomed. 1989;2:196–200. doi: 10.1002/nbm.1940020505. [DOI] [PubMed] [Google Scholar]
- 11.Pfefferbaum A, Adalsteinsson E, Spielman D, et al. In vivo spectroscopic quantification of the N-acetyl moiety, creatine, and choline from large volumes of brain gray and white matter: effects of normal aging. Magn Reson Med. 1999;41:276–84. doi: 10.1002/(sici)1522-2594(199902)41:2<276::aid-mrm10>3.0.co;2-8. [DOI] [PubMed] [Google Scholar]
- 12.Ross BD. Biochemical considerations in 1H spectroscopy: gluta-mate and glutamine; myo-inositol and related metabolites. NMR Biomed. 1991;4:59–63. doi: 10.1002/nbm.1940040205. [DOI] [PubMed] [Google Scholar]
- 13.Brand A, Richter-Landsberg C, Leibfritz D. Multinuclear NMR studies on the energy metabolism of glial and neuronal cells. Dev Neurosci. 1993;15:289–98. doi: 10.1159/000111347. [DOI] [PubMed] [Google Scholar]
- 14.Flögel U, Willker W, Leibfritz D. Regulation of intracellular pH in neuronal and glial tumour cells, studied by multinuclear NMR spectroscopy. NMR Biomed. 1994;7:157–66. doi: 10.1002/nbm.1940070402. [DOI] [PubMed] [Google Scholar]
- 15.Lazeyras F, Charles HC, Tupler LA, et al. Metabolic brain mapping in Alzheimer's disease using proton magnetic resonance spectroscopy. Psychiatry Res. 1998;82:95–106. doi: 10.1016/s0925-4927(98)00010-9. [DOI] [PubMed] [Google Scholar]
- 16.Kreis R, Ross BD, Farrow NA, et al. Metabolic disorders of the brain in chronic hepatic encephalopathy detected with H-1 MR spectroscopy. Radiology. 1992;182:19–27. doi: 10.1148/radiology.182.1.1345760. [DOI] [PubMed] [Google Scholar]
- 17.McCormick D. GABA as an inhibitory neurotransmitter in human cerebral cortex. J Neurophysiol. 1989;62:1018–27. doi: 10.1152/jn.1989.62.5.1018. [DOI] [PubMed] [Google Scholar]
- 18.Govindaraju V, Young K, Maudsley AA. Proton NMR chemical shifts and coupling constants for brain metabolites. NMR Biomed. 2000;13:129–53. doi: 10.1002/1099-1492(200005)13:3<129::aid-nbm619>3.0.co;2-v. [DOI] [PubMed] [Google Scholar]
- 19.Bottomley PA. Selective volume method for performing localized NMR spectroscopy. 1984 Oct 30; inventor US patent 4480228 1984.
- 20.Frahm J, Bruhn H, Gyngell ML, et al. Localized high-resolution protonNMRspectroscopyusingstimulatedechoes:initialapplications to human brain in vivo. Magn Reson Med. 1989;9:79–93. doi: 10.1002/mrm.1910090110. [DOI] [PubMed] [Google Scholar]
- 21.Collins CM, Liu W, Schreiber W, et al. Central brightening due to constructive interference with, without, and despite dielectric resonance. J Magn Reson Imaging. 2005;21:192–96. doi: 10.1002/jmri.20245. [DOI] [PubMed] [Google Scholar]
- 22.Garwood M, DelaBarre L. The return of the frequency sweep: designing adiabatic pulses for contemporary NMR. J Magn Reson. 2001;153:155–77. doi: 10.1006/jmre.2001.2340. [DOI] [PubMed] [Google Scholar]
- 23.Scheenen TW, Heerschap A, Klomp DW. Towards 1H-MRSI of the human brain at 7T with slice-selective adiabatic refocusing pulses. MAGMA. 2008;21:95–101. doi: 10.1007/s10334-007-0094-y. [DOI] [PMC free article] [PubMed] [Google Scholar]
- 24.Scheenen TW, Klomp DW, Wijnen JP, et al. Short echo time 1HMRSI of the human brain at 3T with minimal chemical shift displacement errors using adiabatic refocusing pulses. Magn Reson Med. 2008;59:1–6. doi: 10.1002/mrm.21302. [DOI] [PubMed] [Google Scholar]
- 25.Zhu H, Barker PB. MR spectroscopy and spectroscopic imaging of the brain. Methods Mol Biol. 2011;711:203–26. doi: 10.1007/978-1-61737-992-5_9. [DOI] [PMC free article] [PubMed] [Google Scholar]
- 26.Mekle R, Mlynarik V, Gambarota G, et al. MR spectroscopy of the human brain with enhanced signal intensity at ultrashort echo times on a clinical platform at 3T and 7T. Magn Reson Med. 2009;61:1279–85. doi: 10.1002/mrm.21961. [DOI] [PubMed] [Google Scholar]
- 27.Duyn JH, Gillen J, Sobering G, et al. Multisection proton MR spectroscopic imaging of the brain. Radiology. 1993;188:277–82. doi: 10.1148/radiology.188.1.8511313. [DOI] [PubMed] [Google Scholar]
- 28.Spielman D, Meyer C, Macovski A, et al. 1H spectroscopic imaging using a spectral-spatial excitation pulse. Magn Reson Med. 1991;18:269–79. doi: 10.1002/mrm.1910180203. [DOI] [PubMed] [Google Scholar]
- 29.Posse S, Tedeschi G, Risinger R, et al. High speed 1H spectroscopic imaging in human brain by echo planar spatial-spectral encoding. Magn Reson Med. 1995;33:34–40. doi: 10.1002/mrm.1910330106. [DOI] [PubMed] [Google Scholar]
- 30.Ebel A, Soher BJ, Maudsley AA. Assessment of 3D proton MR echo-planar spectroscopic imaging using automated spectral analysis. Magn Reson Med. 2001;46:1072–78. doi: 10.1002/mrm.1301. [DOI] [PubMed] [Google Scholar]
- 31.Adalsteinsson E, Irarrazabal P, Spielman DM, et al. Three-dimensional spectroscopic imaging with time-varying gradients. Magn Reson Med. 1995;33:461–66. doi: 10.1002/mrm.1910330402. [DOI] [PubMed] [Google Scholar]
- 32.Pruessmann KP, Weiger M, Scheidegger MB, et al. SENSE: sensitivity encoding for fast MRI. Magn Reson Med. 1999;42:952–62. [PubMed] [Google Scholar]
- 33.Pohmann R, von Kienlin M, Haase A. Theoretical evaluation and comparison of fast chemical shift imaging methods. J Magn Reson. 1997;129:145–60. doi: 10.1006/jmre.1997.1245. [DOI] [PubMed] [Google Scholar]
- 34.Dydak U, Weiger M, Pruessmann KP, et al. Sensitivity-encoded spectroscopic imaging. Magn Reson Med. 2001;46:713–22. doi: 10.1002/mrm.1250. [DOI] [PubMed] [Google Scholar]
- 35.Mescher M, Merkle H, Kirsch J, et al. Simultaneous in vivo spectral editing and water suppression. NMR Biomed. 1998;11:266–72. doi: 10.1002/(sici)1099-1492(199810)11:6<266::aid-nbm530>3.0.co;2-j. [DOI] [PubMed] [Google Scholar]
- 36.Ryner LN, Sorenson JA, Thomas MA. Localized 2D J-resolved 1H MR spectroscopy: strong coupling effects in vitro and in vivo. Magn Reson Imaging. 1995;13:853–69. doi: 10.1016/0730-725x(95)00031-b. [DOI] [PubMed] [Google Scholar]
- 37.Schulte RF, Lange T, Beck J, et al. Improved two-dimensional J-resolved spectroscopy. NMR Biomed. 2006;19:264–70. doi: 10.1002/nbm.1027. [DOI] [PubMed] [Google Scholar]
- 38.Schulte RF, Trabesinger AH, Boesiger P. Chemical-shift-selective filter for the in vivo detection of J-coupled metabolites at 3T. Magn Reson Med. 2005;53:275–81. doi: 10.1002/mrm.20362. [DOI] [PubMed] [Google Scholar]
- 39.Mayer D, Spielman DM. Detection of glutamate in the human brain at 3 T using optimized constant time point resolved spectroscopy. Magn Reson Med. 2005;54:439–42. doi: 10.1002/mrm.20571. [DOI] [PubMed] [Google Scholar]
- 40.Hurd R, Sailasuta N, Srinivasan R, et al. Measurement of brain glutamate using TE-averaged PRESS at 3T. Magn Reson Med. 2004;51:435–40. doi: 10.1002/mrm.20007. [DOI] [PubMed] [Google Scholar]
- 41.Srinivasan R, Cunningham C, Chen A, et al. TE-averaged two-dimensional proton spectroscopic imaging of glutamate at 3 T. Neuroimage. 2006;30:1171–78. doi: 10.1016/j.neuroimage.2005.10.048. [DOI] [PubMed] [Google Scholar]
- 42.Furuyama JK, Wilson NE, Burns BL, et al. Application of compressed sensing to multidimensional spectroscopic imaging in human prostate. Magn Reson Med. 2012;67:1499–505. doi: 10.1002/mrm.24265. [DOI] [PubMed] [Google Scholar]
- 43.Barker PB, Hearshen DO, Boska MD. Single-voxel proton MRS of the human brain at 1.5T and 3.0T. Magn Reson Med. 2001;45:765–69. doi: 10.1002/mrm.1104. [DOI] [PubMed] [Google Scholar]
- 44.Tkác I, Andersen P, Adriany G, et al. In vivo 1H NMR spectroscopy of the human brain at 7 T. Magn Reson Med. 2001;46:451–56. doi: 10.1002/mrm.1213. [DOI] [PubMed] [Google Scholar]
- 45.Posse S, Cuenod CA, Risinger R, et al. Anomalous transverse relaxation in 1H spectroscopy in human brain at 4 Tesla. Magn Reson Med. 1995;33:246–52. doi: 10.1002/mrm.1910330215. [DOI] [PubMed] [Google Scholar]
- 46.Brief EE, Whittall KP, Li DK, et al. Proton T2 relaxation of cerebral metabolites of normal human brain over large TE range. NMR Biomed. 2005;18:14–18. doi: 10.1002/nbm.916. [DOI] [PubMed] [Google Scholar]
- 47.Kreis R, Ernst T, Ross BD. Development of the human brain: in vivo quantification of metabolite and water content with proton magnetic resonance spectroscopy. Magn Reson Med. 1993;30:424–37. doi: 10.1002/mrm.1910300405. [DOI] [PubMed] [Google Scholar]
- 48.Mlynárik V, Gruber S, Moser E. Proton T (1) and T (2) relaxation times of human brain metabolites at 3 Tesla. NMR Biomed. 2001;14:325–31. doi: 10.1002/nbm.713. [DOI] [PubMed] [Google Scholar]
- 49.Graff-Radford J, Kantarci K. Magnetic resonance spectroscopy in Alzheimer's disease. Neuropsychiatr Dis Treat. 2013;9:687–96. doi: 10.2147/NDT.S35440. [DOI] [PMC free article] [PubMed] [Google Scholar]
- 50.Mandal PK. Magnetic resonance spectroscopy (MRS) and its application in Alzheimer's disease. Concepts in Magnetic Resonance Part A. 2007;30A:40–64. [Google Scholar]
- 51.Ackl N, Ising M, Schreiber YA, et al. Hippocampal metabolic abnormalities in mild cognitive impairment and Alzheimer's disease. Neurosci Lett. 2005;384:23–28. doi: 10.1016/j.neulet.2005.04.035. [DOI] [PubMed] [Google Scholar]
- 52.Antuono PG, Jones JL, Wang Y, et al. Decreased glutamate + glutamine in Alzheimer's disease detected in vivo with (1)H-MRS at 0.5 T. Neurology. 2001;56:737–42. doi: 10.1212/wnl.56.6.737. [DOI] [PubMed] [Google Scholar]
- 53.Block W, Jessen F, Traber F, et al. Regional N-acetylaspartate reduction in the hippocampus detected with fast proton magnetic resonance spectroscopic imaging in patients with Alzheimer disease. Arch Neurol. 2002;59:828–34. doi: 10.1001/archneur.59.5.828. [DOI] [PubMed] [Google Scholar]
- 54.Chantal S, Labelle M, Bouchard RW, et al. Correlation of regional proton magnetic resonance spectroscopic metabolic changes with cognitive deficits in mild Alzheimer disease. Arch Neurol. 2002;59:955–62. doi: 10.1001/archneur.59.6.955. [DOI] [PubMed] [Google Scholar]
- 55.Garcia Santos JM, Gavrila D, Antúnez C, et al. Magnetic resonance spectroscopy performance for detection of dementia, Alzheimer's disease and mild cognitive impairment in a community-based survey. Dement Geriatr Cogn Disord. 2008;26:15–25. doi: 10.1159/000140624. [DOI] [PubMed] [Google Scholar]
- 56.Godbolt AK, Waldman AD, MacManus DG, et al. MRS shows abnormalities before symptoms in familial Alzheimer disease. Neurology. 2006;66:718–22. doi: 10.1212/01.wnl.0000201237.05869.df. [DOI] [PubMed] [Google Scholar]
- 57.Hancu I, Zimmerman EA, Sailasuta N, et al. 1H MR spectroscopy using TE averaged PRESS: a more sensitive technique to detect neurodegeneration associated with Alzheimer's disease. Magn Reson Med. 2005;53:777–82. doi: 10.1002/mrm.20419. [DOI] [PubMed] [Google Scholar]
- 58.Hattori N, Abe K, Sakoda S, et al. Proton MR spectroscopic study at 3 Tesla on glutamate/glutamine in Alzheimer's disease. Neuroreport. 2002;13:183–86. doi: 10.1097/00001756-200201210-00041. [DOI] [PubMed] [Google Scholar]
- 59.Jessen F, Block W, Traber F, et al. Proton MR spectroscopy detects a relative decrease of N-acetylaspartate in the medial temporal lobe of patients with AD. Neurology. 2000;55:684–88. doi: 10.1212/wnl.55.5.684. [DOI] [PubMed] [Google Scholar]
- 60.Kantarci K, Knopman DS, Dickson DW, et al. Alzheimer disease: postmortem neuropathologic correlates of antemortem 1H MR spectroscopy metabolite measurements. Radiology. 2008;248:210–20. doi: 10.1148/radiol.2481071590. [DOI] [PMC free article] [PubMed] [Google Scholar]
- 61.Kantarci K, Reynolds G, Petersen RC, et al. Proton MR spectroscopy in mild cognitive impairment and Alzheimer disease: comparison of 1.5 and 3 T. AJNR Am J Neuroradiol. 2003;24:843–49. [PMC free article] [PubMed] [Google Scholar]
- 62.Schott JM, Frost C, MacManus DG, et al. Short echo time proton magnetic resonance spectroscopy in Alzheimer's disease: a longitudinal multiple time point study. Brain. 2010;133:3315–22. doi: 10.1093/brain/awq208. [DOI] [PMC free article] [PubMed] [Google Scholar]
- 63.Dixon RM, Bradley KM, Budge MM, et al. Longitudinal quantitative proton magnetic resonance spectroscopy of the hippocampus in Alzheimer's disease. Brain. 2002;125:2332–41. doi: 10.1093/brain/awf226. [DOI] [PubMed] [Google Scholar]
- 64.Falini A, Bozzali M, Magnani G, et al. A whole brain MR spectroscopy study from patients with Alzheimer's disease and mild cognitive impairment. Neuroimage. 2005;26:1159–63. doi: 10.1016/j.neuroimage.2005.03.005. [DOI] [PubMed] [Google Scholar]
- 65.Huang W, Alexander GE, Chang L, et al. Brain metabolite concentration and dementia severity in Alzheimer's disease: a (1)H MRS study. Neurology. 2001;57:626–32. doi: 10.1212/wnl.57.4.626. [DOI] [PubMed] [Google Scholar]
- 66.Jessen F, Gur O, Block W, et al. A multicenter (1)H-MRS study of the medial temporal lobe in AD and MCI. Neurology. 2009;72:1735–40. doi: 10.1212/WNL.0b013e3181a60a20. [DOI] [PubMed] [Google Scholar]
- 67.Jessen F, Traeber F, Freymann N, et al. A comparative study of the different N-acetylaspartate measures of the medial temporal lobe in Alzheimer's disease. Dement Geriatr Cogn Disord. 2005;20:178–83. doi: 10.1159/000087095. [DOI] [PubMed] [Google Scholar]
- 68.Schuff N, Amend DL, Meyerhoff DJ, et al. Alzheimer disease: quantitative H-1 MR spectroscopic imaging of frontoparietal brain. Radiology. 1998;207:91–102. doi: 10.1148/radiology.207.1.9530304. [DOI] [PMC free article] [PubMed] [Google Scholar]
- 69.Watanabe T, Shiino A, Akiguchi I. Absolute quantification in proton magnetic resonance spectroscopy is useful to differentiate amnesic mild cognitive impairment from Alzheimer's disease and healthy aging. Dement Geriatr Cogn Disord. 2010;30:71–77. doi: 10.1159/000318750. [DOI] [PubMed] [Google Scholar]
- 70.Siger M, Schuff N, Zhu X, et al. Regional myo-inositol concentration in mild cognitive impairment using 1H magnetic resonance spectroscopic imaging. Alzheimer Dis Assoc Disord. 2009;23:57–62. doi: 10.1097/WAD.0b013e3181875434. [DOI] [PMC free article] [PubMed] [Google Scholar]
- 71.Frederick BD, Lyoo IK, Satlin A, et al. In vivo proton magnetic resonance spectroscopy of the temporal lobe in Alzheimer's disease. Prog Neuropsychopharmacol Biol Psychiatry. 2004;28:1313–22. doi: 10.1016/j.pnpbp.2004.08.013. [DOI] [PubMed] [Google Scholar]
- 72.Parnetti L, Tarducci R, Presciutti O, et al. Proton magnetic resonance spectroscopy can differentiate Alzheimer's disease from normal aging. Mech Ageing Dev. 1997;97:9–14. doi: 10.1016/s0047-6374(97)01877-0. [DOI] [PubMed] [Google Scholar]
- 73.Rose SE, de Zubicaray GI, Wang D, et al. A 1H MRS study of probable Alzheimer's disease and normal aging: implications for longitudinal monitoring of dementia progression. Magn Reson Imaging. 1999;17:291–99. doi: 10.1016/s0730-725x(98)00168-4. [DOI] [PubMed] [Google Scholar]
- 74.Kantarci K, Jack CR, Jr, Xu YC, et al. Regional metabolic patterns in mild cognitive impairment and Alzheimer's disease: a 1H MRS study. Neurology. 2000;55:210–17. doi: 10.1212/wnl.55.2.210. [DOI] [PMC free article] [PubMed] [Google Scholar]
- 75.MacKay S, Meyerhoff DJ, Constans JM, et al. Regional gray and white matter metabolite differences in subjects with AD, with subcortical ischemic vascular dementia, and elderly controls with 1H magnetic resonance spectroscopic imaging. Arch Neurol. 1996;53:167–74. doi: 10.1001/archneur.1996.00550020079018. [DOI] [PMC free article] [PubMed] [Google Scholar]
- 76.Schuff N, Amend D, Ezekiel F, et al. Changes of hippocampal N-acetyl aspartate and volume in Alzheimer's disease: a proton MR spectroscopic imaging and MRI study. Neurology. 1997;49:1513–21. doi: 10.1212/wnl.49.6.1513. [DOI] [PubMed] [Google Scholar]
- 77.Chantal S, Braun CM, Bouchard RW, et al. Similar 1H magnetic resonance spectroscopic metabolic pattern in the medial temporal lobes of patients with mild cognitive impairment and Alzheimer disease. Brain Res. 2004;1003:26–35. doi: 10.1016/j.brainres.2003.11.074. [DOI] [PubMed] [Google Scholar]
- 78.Mandal PK, Tripathi M, Sugunan S. Brain oxidative stress: detection and mapping of anti-oxidant marker ‘glutathione’ in different brain regions of healthy male/female, MCI and Alzheimer patients using non-invasive magnetic resonance spectroscopy. Biochem Biophys Res Commun. 2012;417:43–48. doi: 10.1016/j.bbrc.2011.11.047. [DOI] [PubMed] [Google Scholar]
- 79.Kantarci K, Petersen RC, Boeve BF, et al. 1H MR spectroscopy in common dementias. Neurology. 2004;63:1393–98. doi: 10.1212/01.wnl.0000141849.21256.ac. [DOI] [PMC free article] [PubMed] [Google Scholar]
- 80.Weiss U, Bacher R, Vonbank H, et al. Cognitive impairment: assessment with brain magnetic resonance imaging and proton magnetic resonance spectroscopy. J Clin Psychiatry. 2003;64:235–42. doi: 10.4088/jcp.v64n0303. [DOI] [PubMed] [Google Scholar]
- 81.Waldman AD, Rai GS. The relationship between cognitive impairment and in vivo metabolite ratios in patients with clinical Alzhei mer's disease and vascular dementia: a proton magnetic resonance spectroscopy study. Neuroradiology. 2003;45:507–12. doi: 10.1007/s00234-003-1040-y. [DOI] [PubMed] [Google Scholar]
- 82.Mihara M, Hattori N, Abe K, et al. Magnetic resonance spectroscopic study of Alzheimer's disease and frontotemporal dementia/Pick complex. Neuroreport. 2006;17:413–16. doi: 10.1097/01.wnr.0000203353.52622.05. [DOI] [PubMed] [Google Scholar]
- 83.Fayed N, Davila J, Oliveros A, et al. Utility of different MR modalities in mild cognitive impairment and its use as a predictor of conversion to probable dementia. Acad Radiol. 2008;15:1089–98. doi: 10.1016/j.acra.2008.04.008. [DOI] [PubMed] [Google Scholar]
- 84.Bartha R, Smith M, Rupsingh R, et al. High field (1)H MRS of the hippocampus after donepezil treatment in Alzheimer disease. Prog Neuropsychopharmacol Biol Psychiatry. 2008;32:786–93. doi: 10.1016/j.pnpbp.2007.12.011. [DOI] [PubMed] [Google Scholar]
- 85.Jessen F, Traeber F, Freymann K, et al. Treatment monitoring and response prediction with proton MR spectroscopy in AD. Neurology. 2006;67:528–30. doi: 10.1212/01.wnl.0000228218.68451.31. [DOI] [PubMed] [Google Scholar]
- 86.Krishnan KR, Charles HC, Doraiswamy PM, et al. Randomized, placebo-controlled trial of the effects of donepezil on neuronal markers and hippocampal volumes in Alzheimer's disease. Am J Psychiatry. 2003;160:2003–11. doi: 10.1176/appi.ajp.160.11.2003. [DOI] [PubMed] [Google Scholar]
- 87.Modrego PJ, Fayed N, Errea JM, et al. Memantine versus donepezil in mild to moderate Alzheimer's disease: a randomized trial with magnetic resonance spectroscopy. Eur J Neurol. 2010;17:405–12. doi: 10.1111/j.1468-1331.2009.02816.x. [DOI] [PubMed] [Google Scholar]
- 88.Frederick B, Satlin A, Wald LL, et al. Brain proton magnetic resonance spectroscopy in Alzheimer disease: changes after treatment with xanomeline. Am J Geriatr Psychiatry. 2002;10:81–88. [PubMed] [Google Scholar]
- 89.Penner J, Rupsingh R, Smith M, et al. Increased glutamate in the hippocampus after galantamine treatment for Alzheimer disease. Prog Neuropsychopharmacol Biol Psychiatry. 2010;34:104–10. doi: 10.1016/j.pnpbp.2009.10.007. [DOI] [PubMed] [Google Scholar]
- 90.Rami L, Gómez-Ansón B, Bosch B, et al. Cortical brain metabolism as measured by proton spectroscopy is related to memory performance in patients with amnestic mild cognitive impairment and Alzheimer's disease. Dement Geriatr Cogn Disord. 2007;24:274–79. doi: 10.1159/000107487. [DOI] [PubMed] [Google Scholar]
- 91.Ding B, Chen K-M, Ling HW, et al. Diffusion tensor imaging correlates with proton magnetic resonance spectroscopy in posterior cingulate region of patients with Alzheimer's disease. Dement Geriatr Cogn Disord. 2008;25:218–25. doi: 10.1159/000113948. [DOI] [PubMed] [Google Scholar]
- 92.Colla M, Ende G, Bohrer M, et al. MR spectroscopy in Alzheimer's disease: gender differences in probabilistic learning capacity. Neurobiol Aging. 2003;24:545–52. doi: 10.1016/s0197-4580(02)00189-6. [DOI] [PubMed] [Google Scholar]
- 93.Christiansen P, Schlosser A, Henriksen O. Reduced N-acetylaspartate content in the frontal part of the brain in patients with probable Alzheimer's disease. Magn Reson Imaging. 1995;13:457–62. doi: 10.1016/0730-725x(94)00113-h. [DOI] [PubMed] [Google Scholar]
- 94.Frederick BB, Satlin A, Yurgelun-Todd DA, et al. In vivo proton magnetic resonance spectroscopy of Alzheimer's disease in the parietal and temporal lobes. Biol Psychiatry. 1997;42:147–50. doi: 10.1016/s0006-3223(97)00242-4. [DOI] [PubMed] [Google Scholar]
- 95.Haley AP, Knight-Scott J, Fuchs KL, et al. Shortening of hippocampal spin-spin relaxation time in probable Alzheimer's disease: a 1H magnetic resonance spectroscopy study. Neurosci Lett. 2004;362:167–70. doi: 10.1016/j.neulet.2004.01.031. [DOI] [PubMed] [Google Scholar]