

Abstract
Background
Solving the dilemma of the organ shortage in Malaysia requires educating Malaysians about organ donation and transplantation. This paper aims at exploring the average Malaysian households ’ preferred channels of campaigns and the preferred campaigners in a family setting, targeting at the dialysis family members.
Methods
We analyzed the responses of 350 respondents regarding organ donation campaigns. The respondents are 2 family members of 175 dialysis patients from 3 different institutions. The information on respondents’ willingness to donate and preferred method and channel of organ donation campaign were collected through questionnaire.
Results
Malaysian families have a good tendency to welcome campaigns in both the public and private (their homes) spheres. We also found that campaigns facilitated by the electronic media (Television and Radio) and executed by experienced doctors are expected to optimize the outcomes of organ donation, in general. Chi-square tests show that there are no significant differences in welcoming campaigns among ethnics. However, ethnics preferences over the campaign methods and campaigners are significantly different (P <0.05).
Conclusion
Ethnic differences imply that necessary modifications on the campaign channels and campaigners should also be taken under consideration. By identifying the preferred channel and campaigners, this study hopes to shed some light on the ways to overcome the problem of organ shortage in Malaysia.
Keywords: Organ donation, Campaigns, Dialysis patients, Family, Malaysia
Introduction
Malaysia is one of the countries facing a severe organ shortage. The Malaysian organ donation rate per million populations has been at very low levels compared to the high number of people waiting for transplantation. For example, in 2010 there were 15000 patients waiting for a kidney transplant, while the organ donation rates recorded only 0.48 donations per million populations (1). Many reasons are claimed to be behind people’s reluctance to donate their organs in living or deceased donations. However, the lack of information regarding organ donation and transplantation has been cited widely to be one of the most important aspects impeding the improvement of organ donation rates (2-5).
In the Malaysian scenario, earlier studies suggested that lack of knowledge of organ donation and transplantation is one of the main reasons, beside the lack of public trust, which make Malaysians refuse to be organ donors. Interestingly, although the country is comprised of multiple ethnic groups, the religio-cultural aspects were found to have a small and negligible contribution to peoples’ reluctance to donate their organs (6).
To increase donation rates, most countries launched campaigns through different channels targeting potential donors. However, not all campaigns resulted in achieving the targeted goals. For instance in Australia, the national surveys revealed that there has not been any increase in people’s willingness to donate two years after of launching the campaigns on organ donation, which ran between 1987 to 1990 (7).
The differences among nations’ cultures and religions play a vital role in determining the methodologies of the educational campaigns on organ donation (8). This notion also applies within nations, especially when the demographic profile of a country comprises many ethnicities and religions, as in the case of Malaysia. For instance, some studies showed that minorities have less knowledge of organ donation (9-10).
The interpersonal campaigns were found to result in higher rates of organ donation. Other than interpersonal campaigns, media campaigns were also found to result in higher donation rates (11). In Spain, for instance, which has the highest organ donation rates in the world, television was found to be the most influential channel that affects peoples’ attitude towards organ donation. Other mediums follow television in importance, namely press and radio, magazines and talks; while information delivered by health professionals comes in last (12). Feeley and Moon (2009) analyzed 23 different campaigns, and found that while media campaigns can contribute to a 4% increase in organ donation, interpersonal campaigns account for a 7% increase. However, using both channels together resulted in a 9% increase in donations (11). This study aims at (i) analyzing Malaysian family members’ (of dialysis patients) willingness to welcome organ donation campaigns, and (ii) determining the best methods in which organ campaign messages would be delivered effectively to the potential donors. These are achieved by analyzing the respondents’ preferred channels of campaigns and the preferred campaigners in a family setting.
Materials and Methods
The attitudes towards organ donation of 350 Malaysian family members of dialysis patients campaign were surveyed. Three nurses were tasked to inform 175 dialysis patients to invite two of their family members to participate in the survey. The nurses work in three different dialysis institutions. The questionnaires were distributed in the three most widely spoken languages in Malaysia (Malay, English and Mandarin). The survey was conducted between June and October 2013. We successfully obtained feedback from all respondents because most of them are close family members to the patients. We conducted this study with respect to the moral standards of scientific research and the ethical standards of the Helsinki Declaration. Respondents’ privacy was given high concern; and all of them were told about the nature and the purposes of this study.
First, respondents’ willingness to become a deceased donor was tested using a set of questions. Six statements were given to the participants to gauge the extent to which they welcome organ donation campaigns. The six statements were divided into two parts based on 2 different campaign settings: 3 are welcoming campaigns at home, while the other 3 are welcoming campaigns in the public space. Each statement was provided with two options, “yes” or “no.” The statements are as follows:
-
1.
I will welcome organ donation campaigners to come to my house.
-
2.
I have no problem to have campaigners come to my house many times, to make everyone in the family clear about the process and procedures to be a deceased organ donor.
-
3.
I have no problem to invite campaigners to come to my house until a majority of my family is willing to be a deceased organ donor.
-
4.
I am willing to bring my family members to attend public talks, forums, etc. on organ donation.
-
5.
I have no problem to bring my family members many times to attend public talks, forums, etc. on organ donation.
-
6.
I have no problem to bring my family members to attend public talks, forums, etc. on organ donation until a majority of them are willing to be a deceased organ donor
Second, to analyze the most preferred channels through which the respondents would like to be educated about organ donation, we gave the participants 5 options to choose from The options are as follows:
-
1.
Face-to-face campaign
-
2.
Electronic media such as radio and television
-
3.
Printed media such as newspapers and magazines
-
4.
Social media such as Facebook, Twitter and email
-
5.
Public talks, forums, etc.
Finally, to secure deeper comprehension of respondents’ preferences, we asked them to choose the most influential campaigners in creating organ donation awareness. The options were as follows:
-
1.
Experienced doctors
-
2.
Nurses
-
3.
Social workers
-
4.
Religious leaders
-
5.
Community leaders/politicians
-
6.
The patient himself/herself
-
7.
The donor himself/herself
-
8.
Other
For all information collected we present the percentage of response. Chi-square test is performed to examine whether ethnic groups preferences differ in terms of welcoming campaigns and preferred campaign methods.
Results
Before illustrating the results, it is important to present the respondents’ background, including their ethnic group, religion, gender, age, marital status, educational level, individual and household income, and their role in the family (Table 1).
Table 1.
Respondent’s background
| Demographic characteristics | Frequency | Percentage |
|---|---|---|
| Ethnic group: | ||
| Malay | 192 | 54.8 |
| Chinese | 116 | 33.1 |
| Indian | 42 | 12 |
| Religion: | ||
| Islam | 187 | 53.4 |
| Buddhist | 95 | 27.1 |
| Hinduism | 26 | 7.4 |
| Christianity | 31 | 8.9 |
| Others | 11 | 3.1 |
| Gender: | ||
| Male | 145 | 41.4 |
| Female | 205 | 58.6 |
| Age (yr): | ||
| 11-20 | 9 | 2.60 |
| 21-30 | 84 | 24.0 |
| 31-40 | 88 | 25.8 |
| 41-50 | 57 | 16.3 |
| 51-60 | 53 | 15.1 |
| 61-70 | 38 | 10.9 |
| 71-80 | 6 | 1.7 |
| N/A | 15 | 4.3 |
| Marital Status: | ||
| Not married | 13 | 26.6 |
| Married | 236 | 70.3 |
| Divorced/Widow/Widower | 11 | 3.1 |
| Highest educational level obtained: | ||
| Primary | 52 | 14.9 |
| Secondary | 161 | 46.0 |
| Tertiary | 106 | 30.3 |
| Others | 31 | 11.1 |
| Monthly Individual Income: | ||
| RM2,000 and below | 159 | 45.4 |
| RM2,001 to RM4,000 | 113 | 32.3 |
| RM4,001 to RM6,000 | 36 | 10.3 |
| RM6,001 to RM8,000 | 7 | 2.0 |
| RM8,001 and above | 7 | 2.0 |
| N/A | 28 | 8.0 |
| Monthly Household Income: | ||
| RM2,000 and below | 96 | 27.4 |
| RM2,001 to RM4,000 | 110 | 31.4 |
| RM4,001 to RM6,000 | 59 | 16.9 |
| RM6,001 to RM8,000 | 31 | 8.9 |
| RM8,001 and above | 38 | 10.9 |
| N/A | 16 | 4.6 |
| Role in family: | ||
| Husband/wife/parent | 195 | 55.7 |
| Son/daughter | 131 | 37.4 |
| Grandfather/Grandmother | 8 | 2.3 |
| Other | 12 | 3.4 |
| N/A | 4 | 1.1 |
Note. N/A refers to the case where no answers were recorded.
The mean age of the respondents is 41 years old. 58.9% of the respondents are female. The ethnic composition resembles that of Malaysia’s ethnic groups, with Malays as the largest group (54 %) followed by Chinese (34%) and Indians (12%). A majority of the respondents have primary and secondary education. Individual incomes indicate that the respondents are mainly low income earners, while the reported household income shows that many of them earn more than RM4000 per month (USD1=RM3.28). Married respondents are predominantly represented (70.3%) in the sample. 54.6% of the respondents stated that they are either a parent or a spouse (this indicates that we managed to survey mostly main decision makers of the households).
Many of the patients are first-degree family members to the respondents and most of them are parents and spouses. This explains the closeness of the respondents to the patients as 94.9% of the respondents stated that they have a close relationship with the patients. Furthermore, 68% of the respondents said that patients are an important source of income in their households.
(i) Welcoming Campaigns
As described earlier, each category of the two campaigns (at home and in the public space) was given three questions. That was done to gauge the extent to which respondents are willing to welcome campaigns. The three questions were given the same scales and the averages of responses were taken to demonstrate the final outcomes.
Table 2 shows that on average there is a high tendency among respondents in general to welcome organ donation campaigns. Overall, 37% of the respondents welcome campaigns to their houses. The figure goes higher to 39% when it comes to campaigns in the public space. Compared to the Chinese, the data shows that the Malays have slightly greater tendency to welcome campaigns. On welcoming campaigns at home, 37% of the Malays said “yes” compared to 34% of the Chinese. Similarly, for public campaigns, the ratios were 40% and 36% for the Malays and the Chinese respectively.
Table 2.
Welcoming campaigns among Malaysian ethnic groups
| Campaign | Malay (n=192) | Chinese (n=116) | Indian (n=42) | Total (n=350) | ||||
|---|---|---|---|---|---|---|---|---|
| Yes | No | Yes | No | Yes | No | Yes | No | |
| House | 72 | 120 | 39 | 77 | 20 | 22 | 131 | 219 |
| (37%) | (63%) | (34%) | (66%) | (48%) | (52%) | (37%) | (63%) | |
| Public | 78 | 114 | 41 | 75 | 18 | 24 | 137 | 213 |
| (40%) | (60%) | (36%) | (64%) | (43%) | (57%) | (39%) | (61%) | |
Note. Values are calculated as averages of responses of each three question in each category.
However, the Indian showed the highest ratios on welcoming campaigns among the three ethnic groups. 48% of Indians welcomed campaigns to their houses and 43% of them welcomed campaigns in the public sphere. The highest variation among ethnic groups was only 14%, which is the difference between the Indian (48%) and the Chinese (34%) ratios in welcoming house campaigns. Our Chi-square tests showed that there is no significant differences among ethnics in terms of welcoming campaigns, for both home (P=2751) and public (P=0.391) campaigns.
(ii) Preferred Channels of Campaigns
Generally, the pool of respondent’s preferences tells that the electronic media channel (TV and Radio) is the most preferred to deliver organ donation messages. As shown in Table 3 and Fig. 1, the electronic media channel is preferred by 37% of the total respondents, followed by the face to face channel, which accounts for 18.6% of the total respondents’ preferences. Although the gap between the most preferred channel and the later three channels is about double in size, these three channels of face to face campaigns, public talks and social media captured about the same amount of preferences from the respondents, 18.6%, 18.3%, and 16% respectively. Interestingly, the respondents showed that the least preferred medium of information is the printed media.
Table 3.
Preferred campaign mediums; the specifications of ethnic groups and donation status
| Channel | Malay (n=192) | Chinese (n=116) | Indian (n=46) | All groups (N=350) | ||||||||
|---|---|---|---|---|---|---|---|---|---|---|---|---|
| W | Un-W | Total | W | Un-W | Total | W | Un-W | Total | W | Un-W | Total | |
| Electronic media (radio and television) | 30 | 46 | 76 | 28 | 19 | 47 | 5 | 3 | 8 | 63 | 68 | 131 |
| 15.6% | 24.0% | 39.6% | 24.1% | 16.4% | 40.5% | 11.9% | 7.1% | 19.0% | 18.0% | 19.4% | 37.4% | |
| Face-to-face campaign | 16 | 11 | 27 | 20 | 10 | 30 | 8 | 0 | 8 | 44 | 21 | 65 |
| 8.3% | 5.7% | 14.1% | 17.2% | 8.6% | 25.9% | 19.0% | 0.0% | 19.0% | 12.6% | 6.0% | 18.6% | |
| Public talks, forums, etc. | 12 | 30 | 42 | 11 | 4 | 15 | 5 | 2 | 7 | 28 | 36 | 64 |
| 6.3% | 15.6% | 21.9% | 9.5% | 3.4% | 12.9% | 11.9% | 4.8% | 16.7% | 8.0% | 10.3% | 18.3% | |
| Social media (Facebook, Twitter, etc.) | 11 | 18 | 29 | 7 | 6 | 13 | 10 | 4 | 14 | 28 | 28 | 56 |
| 5.7% | 9.4% | 15.1% | 6.0% | 5.2% | 11.2% | 23.8% | 9.5% | 33.3% | 8.0% | 8.0% | 16.0% | |
| Printed media (newspapers and magazines) | 8 | 10 | 18 | 6 | 5 | 11 | 4 | 1 | 5 | 18 | 16 | 34 |
| 4.2% | 5.2% | 9.4% | 5.2% | 4.3% | 9.5% | 9.5% | 2.4% | 11.9% | 5.1% | 4.6% | 9.7% | |
Note. Percentages are taken as ratios of ethnic group total respondents. W: Willing donor, Un-W: Unwilling donor
Fig. 1.
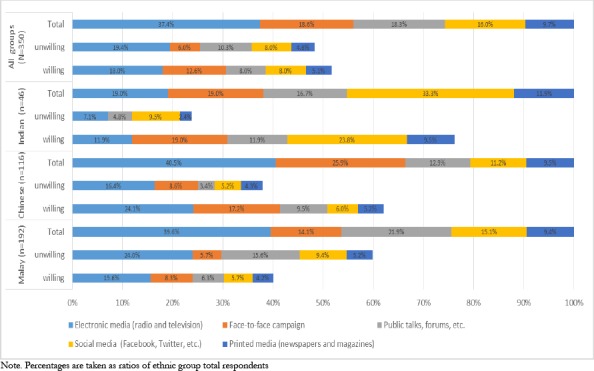
Preferred campaign mediums; the specifications of ethnic groups and donation status
The inter-ethnic reading of the responses shows that there are some differences among ethnic group preferences, especially between the Indians and the other to two ethnic groups, the Malays and the Chinese. The Chi-square tests showed significant differences between ethnic preferences of campaigns (P=0.0035). Farther, the Indians-Malays (P=0.0144) and the Indian-Chinese (P=0.0008) differences is more significant than the difference between the Malays and the Chinese (P=0.0275).
While the electronic media is the most preferred channel for the Malays (39.6%) and the Chinese (40.5%), only 19% of the Indians prefer the electronic media as a medium of information on organ donation. From the Indian perspective, social media (33.3%) is the most preferred channel, while both electronic media (19%) and face to face campaigns (19%) that registered similar percentages of preference come in the second place and this is followed by public talks (16.7%).
Although both the Malays and the Chinese ranked electronic media as the most preferred channel, the second, third and fourth preferences differ among them. The order of the Malay preferences are public talks (21.9%), social media (15.1%), and face to face campaigns (14.1%), while for the Chinese, they are face to face campaigns (25%), public talks (12.9%), and social media (11.2), respectively. Printed media is the only medium of information which was ranked last by all ethnic groups and recorded almost the same portion of responses of about 10%.
The overall theme of respondents’ preferences seems not to significantly vary between willing and unwilling donors. As shown in Fig. 1, the support for electronic media (37.4%) comprises 19.4% of unwilling donors and 18% of willing donors. Similar results could be drawn from the responses of other campaign channels. Similarly, the intra-ethnic comparison between willing and unwilling donors does not show significant differences between willing and unwilling donors (Table 3 and Fig. 1).
(ii) Preferred Campaigners
Table 4 and Fig. 2 show that the majority of respondents of all ethnic groups nominated experienced doctors as the preferred campaigners. This trend also holds for within-group willing and unwilling donors. The other half of the respondents’ votes was shared between religious leaders (12.6%), the donor himself (10%), community leaders (8%) and Other (1.4%).
Table 4.
Preferred campaigners; the specifications of ethnic groups and donation status
| Campaigner | Malay (n=192) | Chinese (n=116) | Indian (n=46) | All groups (N=350) | ||||||||
|---|---|---|---|---|---|---|---|---|---|---|---|---|
| W | Un-W | Total | W | Un-W | Total | W | Un-W | Total | W | Un-W | Total | |
| Experience doctors | 44 | 54 | 98 | 41 | 26 | 67 | 17 | 5 | 22 | 102 | 85 | 187 |
| 22.9% | 28.1% | 51.0% | 35.3% | 22.4% | 57.8% | 40.5% | 11.9% | 52.4% | 29.1% | 24.3% | 53.4% | |
| Religious leaders | 12 | 25 | 37 | 5 | 1 | 6 | 0 | 1 | 1 | 17 | 27 | 44 |
| 6.3% | 13.0% | 19.3% | 4.3% | 0.9% | 5.2% | 0.0% | 2.4% | 2.4% | 4.9% | 7.7% | 12.6% | |
| The donor himself/herself | 7 | 3 | 10 | 13 | 6 | 19 | 4 | 3 | 7 | 24 | 12 | 36 |
| 3.6% | 1.6% | 5.2% | 11.2% | 5.2% | 16.4% | 9.5% | 7.1% | 16.7% | 6.9% | 3.4% | 10.3% | |
| Community leaders/Politicians | 8 | 20 | 28 | 0 | 1 | 1 | 1 | 0 | 1 | 9 | 21 | 30 |
| 4.2% | 10.4% | 14.6% | 0.0% | 0.9% | 0.9% | 2.4% | 0.0% | 2.4% | 2.6% | 6.0% | 8.6% | |
| Social workers | 3 | 6 | 9 | 3 | 3 | 6 | 3 | 0 | 3 | 9 | 9 | 18 |
| 1.6% | 3.1% | 4.7% | 2.6% | 2.6% | 5.2% | 7.1% | 0.0% | 7.1% | 2.6% | 2.6% | 5.1% | |
| Nurses | 3 | 3 | 6 | 5 | 1 | 6 | 4 | 0 | 4 | 12 | 4 | 16 |
| 1.6% | 1.6% | 3.1% | 4.3% | 0.9% | 5.2% | 9.5% | 0.0% | 9.5% | 3.4% | 1.1% | 4.6% | |
| The patient himself/herself | 0 | 1 | 1 | 4 | 5 | 9 | 3 | 1 | 4 | 7 | 7 | 14 |
| 0.0% | 0.5% | 0.5% | 3.4% | 4.3% | 7.8% | 7.1% | 2.4% | 9.5% | 2.0% | 2.0% | 4.0% | |
| Other | 0 | 3 | 3 | 1 | 1 | 2 | 0 | 0 | 0 | 1 | 4 | 5 |
| 0.0% | 1.6% | 1.6% | 0.9% | 0.9% | 1.7% | 0.0% | 0.0% | 0.0% | 0.3% | 1.1% | 1.4% | |
Note. Percentages are taken as ratios of ethnic group total respondents. W: Willing donor, Un-W: Unwilling donor.
Fig. 2.
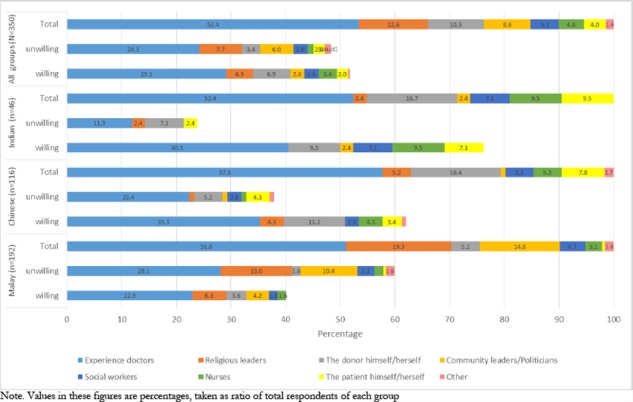
Preferred campaigners; the specifications of ethnic groups and donation status
Although about half of each ethnic group placed experienced doctors as the most preferred campaigners, the other half of each group showed diverse preferences. According to our Chi-square tests, the differences between ethnic groups preferences about campaigners is highly significant for all inter-ethnic tests (P=0.0000). Malays placed religious leaders in the second rank of their preferences, while the second preference rank went to the donor (as campaigner) according to the Indians (16.4%) and the Chinese (16.7%). On the contrary, less than 6% of Chinese and 3% of Indian votes went to the religious leaders. The Malays’ third ranked preferred campaigner, community leaders (14.6%), differs from the one chosen by the Indians, the patient or nurses (9.5%); and the Chinese, the patient (9.5%). Interestingly, only 2.4% of the Indians and almost none of the Chinese respondents preferred community leaders and politicians, who get more than 14% of the Malays’ vote.
Discussion
Doctors stress that people does not like to talk about death and what will happen to their bodies after death (13). However, the results show that 37-39% of respondents welcome organ donation campaigns. Therefore, we can say that family members of dialysis patients have a high propensity to welcome organ donation campaigns in both setting, the private (home) and public spheres. The preferences of respondents seem not to vary much between the campaign spheres (private or public).
On the other hand, the results show that the attitude of the various ethnic groups in Malaysia on welcoming organ donation campaigns is not highly fragmented.
The total outcomes of our survey shows that the respondents’ preferred channel for organ donation campaigns, ranked in descending order, are electronic media, face to face campaigns, public talks, social media, and lastly printed media. The electronic media is registered as the most preferred channel of information, with the support of more than one third of the total responses.
These results concur partially with Conesa et al. (2004) findings that television and radio, or electronic media in our terminology, is the number one medium for channeling campaign messages to the potential donors. However, their study did not differentiate between the campaigner and the campaign channel. In addition health professionals in their study ranked last in importance as a source of information on organ donation, while in our analysis health professionals are the most preferred campaigner; who can be utilized to deliver the campaign message in any one of the campaign channels (12).
Ethnic group ranking for campaign mediums shows distinctive patterns. However in general, the Malay and Chinese’s preferences seem to be quite similar, while the Indians have totally different preferences towards the campaigns channels. The differences illustrated in the previous section suggest that campaigns targeting the Malays and the Chinese can utilize similar combinations of channels; while campaigns targeting the Indian donors should utilize social media at the first stage.
In all, more than half of family members of dialysis patients prefer health professionals (experienced doctors) to be the campaigners. However, each of the suggested campaigners comprising religious leaders, the donor himself and community leaders, garner between 9% and 12 % of the total respondents’ preferences.
As previously mentioned, all groups place experienced doctors as the most preferred campaigners with more than 50% of the responses. Nevertheless, the inter-ethnic comparison shows that the Chinese and the Indians portray similar preferences towards campaigners. However, these preferences differ from the Malays, who appeared to be more favorable towards a religious leader being the campaigner. This could be attributed to the belief that the daily life of the Malays is linked to religion and they are very much influenced by the Islamic traits.
Another important point drawn from the results is that the Chinese and the Indians placed negligible importance for community leaders and politicians to be the campaigners, unlike the Malays who gave that category of campaigner 14.6% of their votes and placed them as the third preferred campaigner. The cause of this phenomenon may likely be due to the trust placed in the politicians by the Malays. This may be linked to the ethnicity of the politicians, who are predominantly Malay, the ethnic group who make up the majority of the population.
According to another study, combining media-based and interpersonal (face to face) campaigns may optimize the outcomes of a campaign. In our research, the interpersonal campaigns (face to face) are found to be the preferred channel of about 18% of the respondents and ranked as the second most important channel for delivering organ donation messages, while about 37% of the respondents welcomed campaigns to their houses. Considering the results of our research and the finding of this study, it can be suggested that these 2 mediums can also be combined in the Malaysian scenario and could likely produce a similar result (11).
The preference of the willing and unwilling donors does not reveal significant variations, in both pooled responses and ethnic-specific ones. This implies that the same campaign channels and campaigners could be utilized in targeting willing and unwilling donors.
Finally, overcoming the shortage in the supply of organs requires educating the public on organ donation and transplantation. This effort shall aim to provide people with proper information on the ablmedical facts of organ donation and to increase public trust of the medical systems in general (6). In this context, achieving the goals of educational campaigns is believed to be the result of having a comprehensive understanding of the targeted community; and of using accurate methods in delivering the message to potential donors. After having accurate comprehension of the targeted donors, educational campaigns should be designed based on their backgrounds, by employing the proper channels in which the campaign messages would be effectively delivered.
Conclusion
The study from Malaysia on organ donation campaigns targeted at families of dialysis patients reveals that although most of the respondents welcomed organ donation campaign, the ethnic dimension of it worth further examination. Ethnic differences imply that necessary modifications on the campaign channels and campaigners should also be taken under consideration. By identifying the preferred channel and campaigners, this study hopes to shed some light on the ways to overcome the problem of organ shortage in Malaysia.
Ethical Considerations
Ethical issues (Including plagiarism, Informed Consent, misconduct, data fabrication and/or falsification, double publication and/or submission, redundancy, etc.) have been completely observed by the authors.
Acknowledgments
The authors wish to thank the University of Malaya and the Ministry of Higher Education for funding this research under the Exploratory Research Grant Scheme 2012 (ERGS-IPTA) (Project Number: ER019-2012A). We would also like to thank Mr. Khaled Tafran for his help during the preparation of the manuscript. The authors declare that there is no conflict of interest.
References
- Global Observatory on Donation and Transplantation (GODT) (2010). Organ donation and transplantation: activities, laws and organization 2010. URL (last checked 2February2013). http://www.transplant-observatory.org.
- Lee SH, Jeong JS, Ha HS, No MJ, Hong JJ, Kwon JS, Lee SG (2005). Decision-related factors and attitudes toward donation in living related liver transplantation: Ten-year experience. Transplant P, 37(2): 1081–1084. [DOI] [PubMed] [Google Scholar]
- Simpkin AL, Robertson LC, Barber VS, Young JD (2009). Modifiable factors influencing relatives’ decision to offer organ donation: Systematic review. Br Med J, 338, b991. [DOI] [PMC free article] [PubMed] [Google Scholar]
- Ghorbani F, Khoddami-Vishteh HR, Ghobadi O, Shafaghi S, Rostami Louyeh A, Najafizadeh K (2011). Causes of family refusal for organ donation. Transplant P, 43(2), 405–406. [DOI] [PubMed] [Google Scholar]
- Sque M, Long T, Payne S (2005). Organ donation: key factors influencing families’ decision-making. Transplant P, 37(2), 543–546. [DOI] [PubMed] [Google Scholar]
- Tumin M, Noh A, Jajri I, Chong CS, Manikam R, Abdullah N (2013). Factors that hinder organ donation: Religio-cultural or lack of information and trust. Exp Clin Transplant, 11(3), 207–210. [DOI] [PubMed] [Google Scholar]
- Cuzin B, Dubernard JM (1995). The media and organ shortage In Touraine JL, Traeger J, Bétuel H, Dubernard JM., Revillard JP, Dupuy C (Eds.), Organ shortage: The solution, (pp. 287–293).Netherlands: Springer. [Google Scholar]
- Guy B (2001). Marketing organ donation around globe. Marketing Health Services, 21(4), 30–35. [PubMed] [Google Scholar]
- Morgan SE, Cannon T (2003). African Americans’ knowledge about organ donation: Closing the gap with more effective persuasive message strategies. J Natl Med Assoc, 95(11), 1066–1071. [PMC free article] [PubMed] [Google Scholar]
- Siminoff LA, Lawrence RH, Arnold RM (2003). Comparison of black and white families’ experiences and perceptions regarding organ donation requests. Crit Care Med, 31(1), 146–151. [DOI] [PubMed] [Google Scholar]
- Feeley TH, Moon SI (2009). A meta-analytic review of communication campaigns to promote organ donation. Communication Reports, 22(2), 63–73. [Google Scholar]
- Conesa C, Ríos Zambudio A, Ramírez P, Canteras M, Rodríguez MM, Parrilla P (2004). Influence of different sources of information on attitude toward organ donation: A factor analysis. Transplant P, 36 (5), 1245–1248. [DOI] [PubMed] [Google Scholar]
- Fevrier P, Gay S. Informed consent versus presumed consent: The role of the family in organ donations (2004). Available at SSRN 572241. http://ssrn.com/abstract=572241.