Abstract
Background
Papillary thyroid carcinoma is the most common thyroid malignancy. Most papillary thyroid carcinomas contain BRAF mutations or RET/PTC rearrangements, thus providing targets for biologic therapy. Our previous studies had suggested papillary thyroid carcinomas with a BRAF mutation and the RET/PTC1 rearrangement have different sensitivities to MEK1/2 inhibitors, suggesting different signaling transduction pathways were involved.
Methods
Src signaling transduction pathway in papillary thyroid carcinoma cells was examined using Src inhibitors (PP2, SU6656, or dasatinib) and si-Src RNA in vitro by Western blot analysis and proliferation analysis. An orthotopic xenograft mouse model was used for the in vivo studies using dasatinib.
Results
In papillary thyroid carcinoma cells, Src inhibitors suppressed p-Src and p-FAK and inhibited cell growth. In addition, significant suppression and extension of the p-ERK1/2 dephosphorylation were detected in RET/PTC1-rearranged cells in combination with a MEK inhibitor (CI-1040). The Src family kinase/ABL inhibitor, dasatinib, significantly decreased tumor volume in mice inoculated with papillary thyroid carcinoma cells carrying the RET/PTC1 rearrangement. In BRAF-mutated papillary thyroid carcinoma cells, Src inhibitors effectively suppressed p-Src expression and dasatinib significantly decreased tumor volume with twice daily treatment.
Conclusions
Src inhibitors effectively inhibited the Src signaling transduction pathway in papillary thyroid carcinoma cells in vitroand dasatinib suppressed tumor growth in vivo. These results suggested that Src signaling transduction pathway plays an important role in regulating growth in papillary thyroid carcinoma cells. Combination of Src and MEK1/2 inhibitors extended the dephosphorylation of ERK1/2 in papillary thyroid carcinomas carrying the RET/PTC1 rearrangement suggesting that combination therapy with complementary inhibitors of other signaling transduction pathways may be needed to effectively suppress growth and induce apoptosis in these cells.
Keywords: papillary thyroid carcinoma, PP2, SU6656, dasatinib, CI-1040
Introduction
Papillary thyroid carcinoma (PTC) is the most common type of thyroid malignancy. 1 Although patients less than 45 years old do well, those patients with advanced age which exhibit soft tissue extension, lymph node or distant metastases, or dedifferentiation, are associated with high risk of recurrences and death from disease.2
As the majority of tumors in PTC contain BRAF mutation or RET/PTC rearrangements, these mutations have been considered obvious targets for biologic therapy. Both mutations lead to activation of the mitogen-activated protein kinase kinase (MAPKK or MEK1/2) cascade, resulting in downstream phosphorylation of ERK1/2 (MAPK) and subsequent activation of transcription factors that regulate cell proliferation and survival.3, 4 We have previously shown that prolonged suppression of ERK phosphorylation in response to MEK1/2 inhibitors was only observed in cells with a BRAF mutation.5-7 Cells harboring the RET/PTC1 rearrangement exhibited only transient suppression of ERK phosphorylation. Because PTC cells carrying the RET/PTC1 rearrangement were insensitive to MEK1/2 inhibitors, other signaling transduction pathway(s) may be involved in mediating the activation of ERK1/2 and promoting cell survival.
The Src transduction pathway has been studied extensively in other tumors. The non-receptor protein tyrosine kinase Src (c-Src) regulates signals from multiple cell surface molecules, including integrins and growth factor receptors,8 and has been implicated in tumor invasion and migration.9 Although there are no evidence of direct interaction among c-Src, BRAF, and RET, indirect evidence has suggested that c-Src may regulate MEK1/2 through RAS gene.10 Several Src inhibitors, including PP2, SU6656, AZ0530, SKI-606, and dasatinib, have been developed and investigated.10, 11 Among them, dasatinib has been approved by the United States Food and Drug Administration for the treatment of leukemia.12
In this study, we investigated the role and mechanism of Src signaling transduction pathway regulation in PTC cells.
Materials and Methods
Cell Lines
The PTC cell lines carrying the RET/PTC1 rearrangement (TPC-1) or BRAF-mutated PTC cell line (K2) have been described previously.7 TPC-1 cells were maintained in RPMI1640 (Mediatech, Inc., Herndon, VA, Hyclone, Logan, UT, or Sigma-Aldrich, St. Louis, MO) containing 10% fetal bovine serum (Hyclone or Sigma-Aldrich), nonessential amino acid mixture (Cambrex BioScience, Walkers, MD), 1 mM sodium pyruvate (Cambrex BioScience), and 2 mM L-glutamine (Cambrex BioScience) in a 37°C incubator supplied with 95% air and 5% CO2. K2 cells were maintained in DMEM/F12 (Mediatech) containing 10% fetal bovine serum and 2 mM L-glutamine. Both cell lines were genotyped within 3 months of this study by MD Anderson Cancer Center cell line characterization cell line core lab to confirm the identity of each cell line.
Reagents
PP2, SU6656, and staurosporine were purchased from EMD Chemicals Inc (Gibbstown, NJ) and Sigma-Aldrich. Dasatinib was provided by Dr. John Araujo in UT MD Anderson Cancer Center or purchased from Selleck Chemicals (Houston, TX). For the in vitro studies, inhibitors were prepared as a 10-mM stock in dimethyl sulfoxide (DMSO). si-c-Src RNA was obtained from Thermo Fisher Scientific Dharmacon (product #M-003175-03-0010; Lafayette, CO) and control siRNA (MISSION Universal Negative siRNA Control, si-control, product #SIC001) from Sigma-Aldrich. MISSION Universal Negative siRNA Control is designed to ensure no homology to all mature and predicted RefSeq mRNA sequences. It is validated with Agilent 40K human gene arrays to ensure no significant nonspecific gene interactions. Universal scrambled negative control siRNA duplex was purchased from Origene Technologies (product #SR30004, Rockville, MD).
Western Blot Analysis
Protein extracts from PTC cell lines were prepared and analyzed as described previously.6 Tissues from mice tumors were homogenized in RIPA buffer containing 50 mM Tris-HCl (pH 7.4), 150 mM sodium chloride, 1% NP40, 0.5% sodium deoxycholate, 0.1% sodium dodecyl sulfate, PhosSTOP (Roche, Indianapolis, IN), and Complete protease inhibitor cocktail (Roche) to obtain protein extracts. The antibodies against p-ERK1/2 (Thr202/Tyr204, product #4377, Cell Signaling Technology, Danvers, MA), total ERK1/2 (product #9102, Cell Signaling Technology), p-Src (Tyr 416, product #2101, Cell Signaling Technology), total Src (specific for c-Src, product #2123, Cell Signaling Technology); p-FAK (Tyr 861, product #44-626G; Life Technologies, Grand Island, NY); and total FAK (product #05-537, Millipore, Billerica, MA) were used at 1:1000 dilution; and a monoclonal antibody against actin (A4700; Sigma-Aldrich) was used at 1:3000 dilution.
siRNA Transfection
The siRNA transfection was performed via electroporation as described previously with modifications.13 Briefly, PTC cells were electroporated with siRNA at V-20 setting using Nucleofector II (Lonza, Walkersville, MD).
Proliferation Assay
The cells proliferation assay has been described previously.7 Briefly, cells were plated in 24-well plates (Costar, Cambridge, MA) in triplicate for 4 days in a 37°C incubator. Drugs were added to the cells on day 0. For cell growth curves, MTT assay was performed every day from days 0 to 4. MTT, 0.2 mL of 3-(4,5-dimethylthiazol-2-yl)-2,5-diphenyltetrazolium bromide (Sigma-Aldrich) dissolved in 0.8% Sodium chloride solution at 5 mg/mL, was added to each well. After incubating cells at 37°C for 3 h, the liquid was aspirated from the wells and discarded. Stained cells were dissolved in 0.5 mL of DMSO and their absorption at a wavelength of 570 nm (OD570) was ascertained using a Synergy HT multi-detection microplate reader (BioTek Instruments, Winooski, VT) or SPECTROstar nano microplate reader (BMG LabTech, Offenburg, Germany). P values were determined by Student t-test and a p value < 0.05 is statistically significant.
Tumor Growth In Athymic Mice Using An Orthotopic Model
The orthotopic thyroid carcinoma model in mice has been described previously14 and approved by our Institutional Animal Care and Use Committee. PTC cells carrying luciferase were inoculated in situ into the right thyroid lobe of Ncr-nu/nu mice. Dasatinib (15 mg/kg) was delivered by oral gavage either once (QD) or twice (BID) a day in two treatment plans. In the QD treatment plan, a group of 8 or 9 mice were randomly selected after luciferase bioimaging and were treated with vehicle (80 mM citric buffer) and 13 mice were used with dasatinib. Treatment was carried out for up to 10 days for TPC-1 mice and up to 26 days for K2 mice. In the BID treatment plan, 10 mice were randomly selected to receive vehicle treatment and 12 or 13 mice to receive dasatinib treatment. Treatment started when tumors were palpable and ended on day 18 for TPC-1 mice and day 31 for K2 mice. Tumor growth was monitored weekly by luciferase bioimaging (Xenogen). Tumors were measured after mice were sacrificed because of body weight loss or tumor burden. Average tumor volumes (mm3) was calculated with the formula (V = length × width × deep), plotted in Scatter plots, and t-test was performed using Prism 5.0.
Results
Src Inhibitors Suppressed The Expression Of P-Src and Downstream Effector P-FAK In PTC Cells
The effects of Src inhibitors PP2, SU6656, and dasatinib were tested in PTC cells for their ability to suppress the expression of p-Src by Western blot analysis. To determine the effective dose of each inhibitor, a serial dilution of each inhibitor was added to each cell line. In TPC-1 cells, the expression of p-Src was suppressed by PP2 or SU6656 at 10 μM or by dasatinib at 0.1 μM after 1 h treatment (Figure 1A). In K2 cells, the expression of p-Src was suppressed by PP2 at 5 μM or SU6656 at 10 μM or by dasatinib at 0.1 μM.
Figure 1.
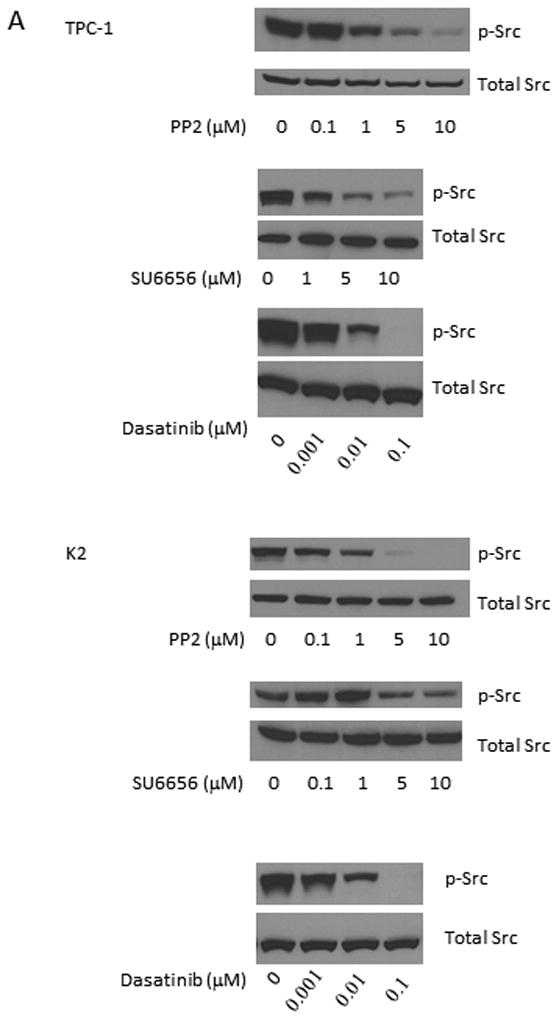
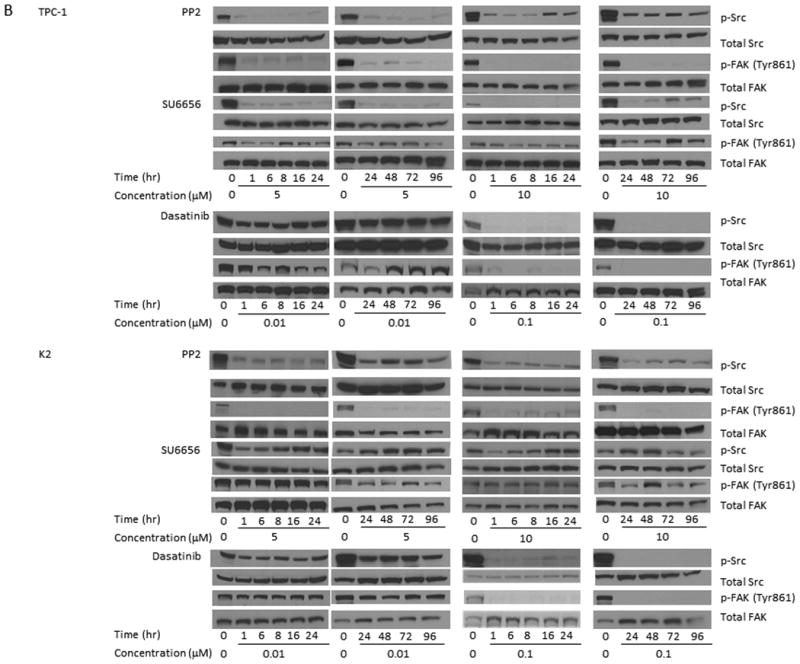
Src inhibitors suppress the phosphorylations of Src and FAK. (A) TPC-1 (top) and K2 (bottom) cells were treated with PP2, SU6656, or dasatinib for 1 h at 37°C with indicated concentrations. Protein extracts were prepared and the expressions of p-Src and total Src were detected by Western blot analysis. (B) TPC-1 (top) and K2 (bottom) cells were treated with PP2 (5 or 10 μM), SU6656 (5 or 10 μM), or dasatinib (0.01 or 0.1 μM) for 1-96 hours. Protein extracts were prepared and incubated with antibodies against p-Src and p-FAK (Tyr861) on Western blot analysis. Total Src and FAK were used as loading controls. Cells treated with DMSO only were used as positive controls for normal expression of p-Src and p-FAK (Tyr861).
Two doses from each inhibitor were chosen based on results from Figure 1A to test their abilities to inhibit the expression of p-Src and the downstream effector of the Src signaling transduction pathway, p-FAK (phosphorylation at Tyr 861 of FAK is related to Src activation). PTC cells were treated with each inhibitor for 1-96 h and the expression of p-Src and p-FAK (Tyr 861) was monitored by Western blot analysis. Using PP2, the expression of p-Src and p-FAK (Tyr 861) was suppressed at 1 h and the effects lasted for more than 96 h when either 5 or 10 μM was used in TPC-1 and K2 cells (Figure 1B). Although the expression of p-Src was detectable at 24 h when 5 μM PP2 was used in TPC-1 and K2 cells, the level of p-Src expression was still lower than untreated cells at 96 h. This suppression of FAK (Tyr 861) phosphorylation was less intensive in both TPC-1 and K2 cells treated with 5 or 10 μM SU6656, even though a significant suppression of p-Src expression was detected in TPC-1 cells when cells were treated with 5 or 10 μM SU6656 and the effect lasted for up to 96 h (Figure 1B). When PTC cells were treated with 0.1 μM dasatinib, the expression of p-Src and p-FAK (Tyr 861) was significantly suppressed (Figure 1B). Little to no suppression of p-Src and p-FAK (Tyr 861) expressions was detected in TPC-1and K2 cells when 0.01 μM dasatinib was used. The expression of total Src and FAK was not changed by any Src inhibitors (Figure 1B).
Src Inhibitors Suppressed The Phosphorylation Of ERK1/2 And Extended The Duration Of ERK1/2 Dephosphorylation When Used In Combination With A MEK Inhibitor
Previous studies using MEK1/2 inhibitor (CI-1040) suggested that the growth of PTC cells carrying a BRAF mutation could be suppressed completely in vitro and in vivo.6, 7 Prolonged suppression of ERK phosphorylation in response to MEK1/2 inhibitors was only observed in these cells. TPC-1 cells exhibited only transient suppression of ERK phosphorylation for less than 6 hours6 after CI-1040 treatment (Figure 2A). Similar to CI-1040, 5 μM PP2 alone was able to cause the dephosphorylation of p-ERK1/2 for less than 6 h. When PP2 concentration was increased to 10 μM, the dephosphorylation of p-ERK1/2 lasted for up to 8 h. SU6656 alone was able to cause the dephosphorylation of p-ERK1/2 for less than 8 or 16 h, respectively, when either 5 or 10 μM was used. No suppression on p-ERK1/2 expression was observed in TPC-1 cells after 0.01 or 0.1 μM dasatinib was used (Figure 2A). The expression of total ERK1/2 remains unchanged during treatments with all Src inhibitors.
Figure 2.
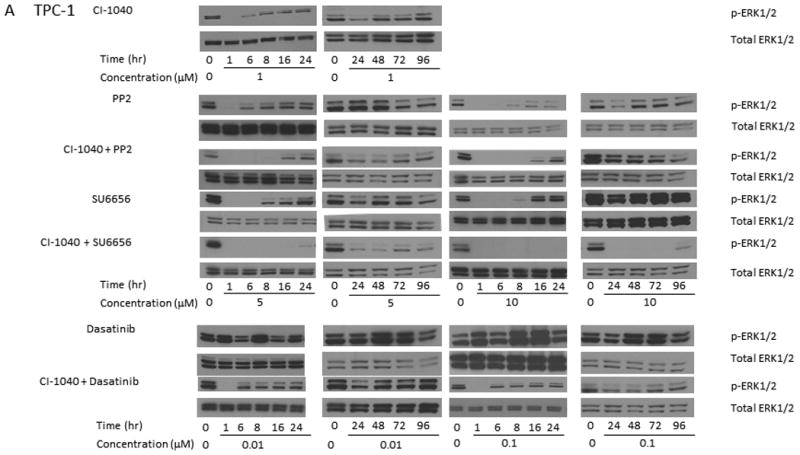
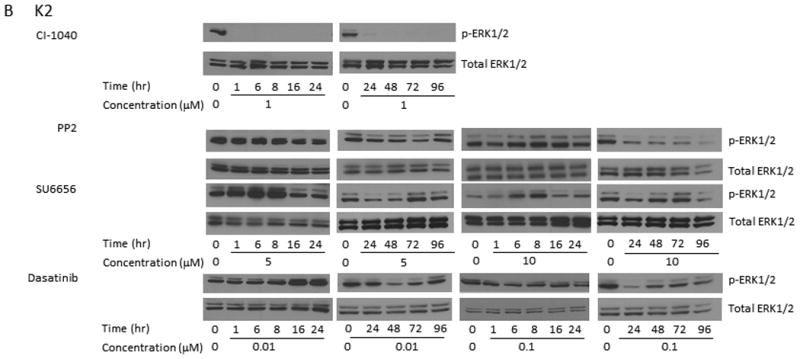
Src inhibitors in combination with a MEK1/2 inhibitor extend the dephosphorylation of ERK1/2. (A) TPC-1 cells were treated with 1 μM CI-1040 alone, 5 or 10 μM PP2 alone, 1 μM CI-1040 and 5 or 10 μM PP2, 5 or 10 μM SU6656 alone, 1 μM CI-1040 and 5 or 10 μM SU6656, 0.01 or 0.1 μM dasatinib alone, and 1 μM CI-1040 and 0.01 or 0.1 μM dasatinib for 1-96 hours at 37°C. Phosphorylation of ERK1/2 was detected using Western blot analysis and total ERK1/2 was used as a loading control. (B) K2 cells were treated with 1 μM CI-1040, 5 or 10 μM PP2, 5 or 10 μM SU6656, or 0.01 or 0.1 μM dasatinib for 1-96 hours. Protein extracts were prepared and incubated with antibodies against p-ERK1/2 on Western blot analysis. Total ERK1/2 was used as a loading control.
In an effort to extend the suppression of ERK1/2 phosphorylation, TPC-1 cells were treated with CI-1040 in combination with Src inhibitors. The expression of p-ERK1/2 was suppressed for less than 16 h when both CI-1040 and 5 or 10 μM PP2 were used, as compared to less than 6 h when CI-1040 or 5 μM PP2 was used alone or less than 8 h when 10 μM PP2 was used alone (Figure 2A). The suppression of p-ERK1/2 expression was extended to more than 96 h when both CI-1040 and SU6656 (either 5 or 10 μM) were used, as compared to less than 8 or 16 h when 5 or 10 μM SU6656 was used alone (Figure 2A). Although the expression of p-ERK1/2 was detectable at 24 h when 5 μM SU6656 was used, the intensity was much less than that in untreated cells. When 0.01 or 0.1 μM dasatinib was used in combination with CI-1040, the expression of p-ERK1/2 was suppressed for less than 6 h as compared to undetectable suppression when dasatinib was used alone.
In K2 cells, CI-1040 effectively suppressed the expression of p-ERK1/2 at all tested time points (1 to 96 h); while all tested Src inhibitors failed to suppress the expression of p-ERK1/2 as shown by Western blot analysis (Figure 2C).
Si-Src RNA Demonstrated The Same Effects On FAK As Src Inhibitors
To determine if Src inhibitors were specifically targeting the Src signaling transduction pathway, we examined the effect of si-Src on the expression of p-FAK. We found that si-Src RNA suppressed the expression of p-Src, total c-Src, and p-FAK (Tyr 861) at 2 days in both TPC-1 (Figure 3A) and K2 (Figure 3B) cells. This suppression lasted at least to 4 days in TPC-1 cells or up to 3 days in K2 cells. The expression of p-ERK1/2 and total FAK in both TPC-1 and K2 cells was not affected by si-Src RNA at all tested time points (2-4 days).
Figure 3. si-Src confirms the observed effects by Src inhibitors.
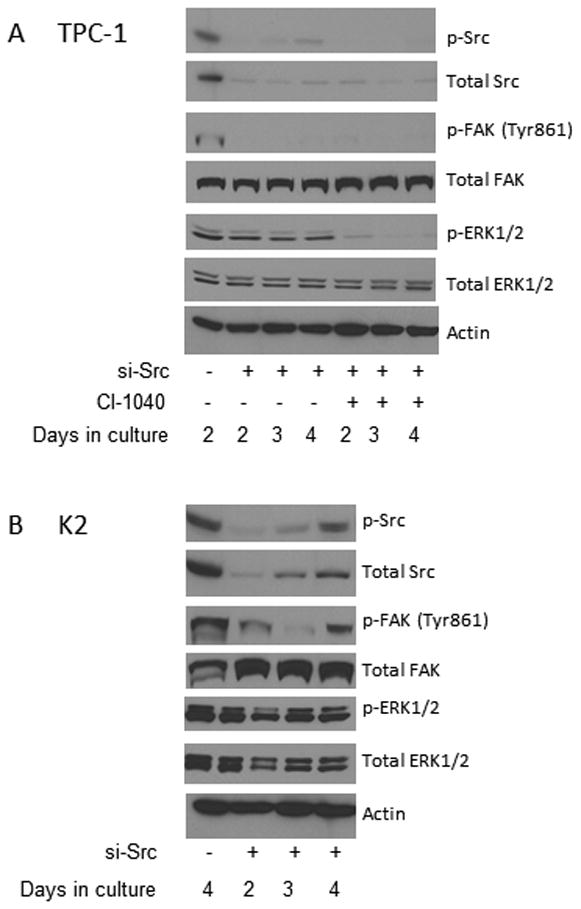
(A) TPC-1 cells were electroporated with si-control or si-Src and treated with 1 μM CI-1040 or DMSO (as controls) on day 0. Cells were harvested at 2, 3, or 4 days and protein extracts were prepared. The expression of Src, FAK (Tyr 861), and ERK1/2 phosphorylation and total c-Src were detected by Western blot analysis. Total FAK, ERK1/2, and β-actin were used as loading controls. (B) K2 cells were electroporated with si-control or si-Src. Cells were harvested at 2, 3, or 4 days and protein extracts were prepared. The expression of p-Src, total c-Src, p-FAK (Tyr 861), and p-ERK1/2 was detected by Western blot analysis. Total FAK, total ERK1/2, and β-actin were used as loading controls.
The combination effects of Src inhibitors and CI-1040 on the expression of p-ERK1/2 in TPC-1 cells were confirmed with si-Src RNA. The expression of p-ERK1/2 was suppressed in TPC-1 cells electroporated with si-Src RNA and treated with CI-1040 for 48 h as detected by Western blot analysis and the suppression lasted at least for 96 h (Figure 3A). This confirms the results we obtained using Src inhibitors in combination with CI-1040 in which the dephosphorylation of p-ERK1/2 was extended for 6-96 h, depends on which Src inhibitor was used.
Src Inhibitors Suppressed Cell Proliferation
Since activation of ERK1/2 has been shown to regulate cell proliferation, we tested the effects of Src inhibitors on PTC cell proliferation. In TPC-1 cells after 4 days of treatment, the cell growth was repressed for 36.2 or 71.4% (p < 0.001) by 0.1 or 1 μM PP2, 29.9 or 61.4% (p < 0.001) by 0.1 or 1 μM SU6656, or 36.7 or 69.2% (p < 0.001) by 0.01 or 0.1 μM dasatinib, respectively, when compared to untreated cells (Figure 4A and Table 1).
Figure 4.
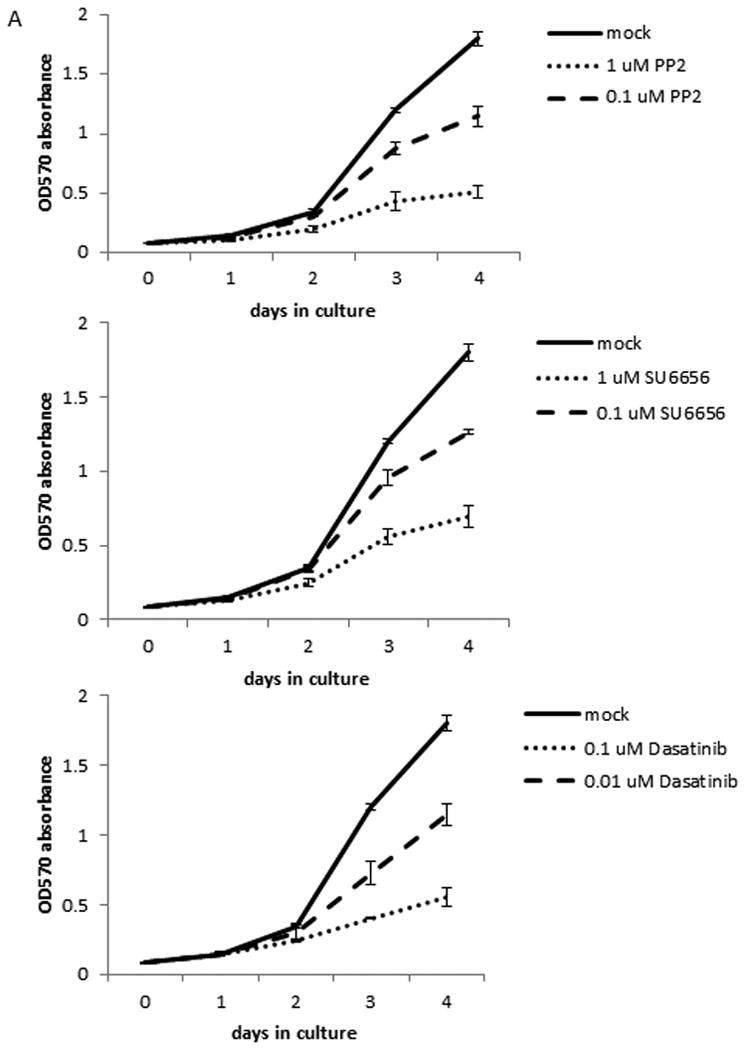
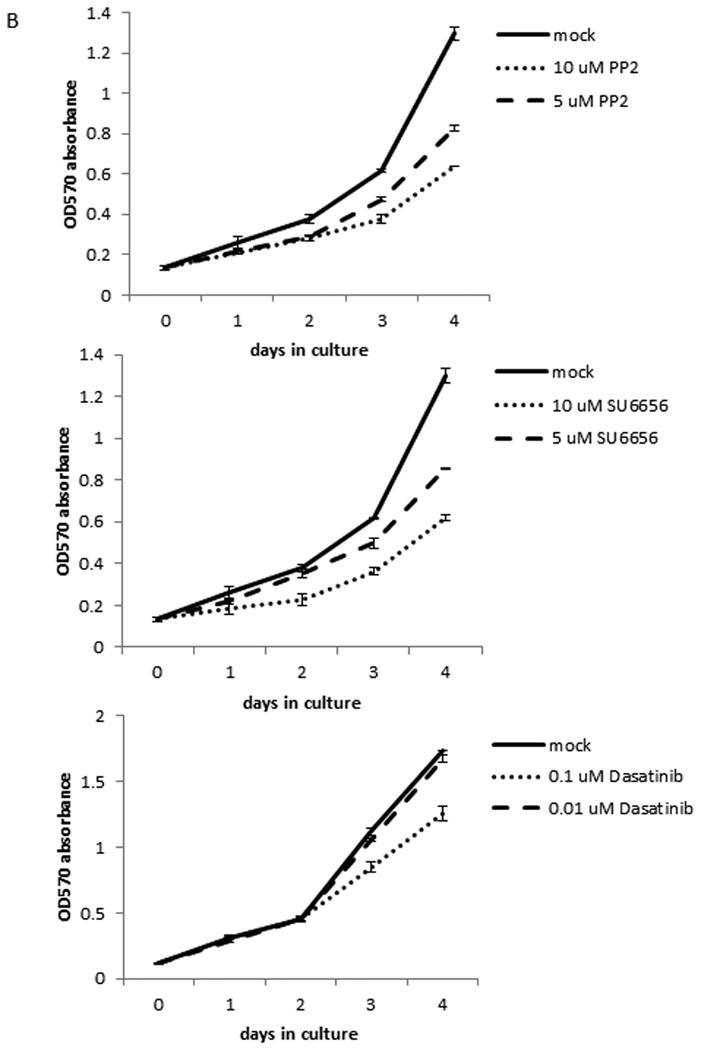
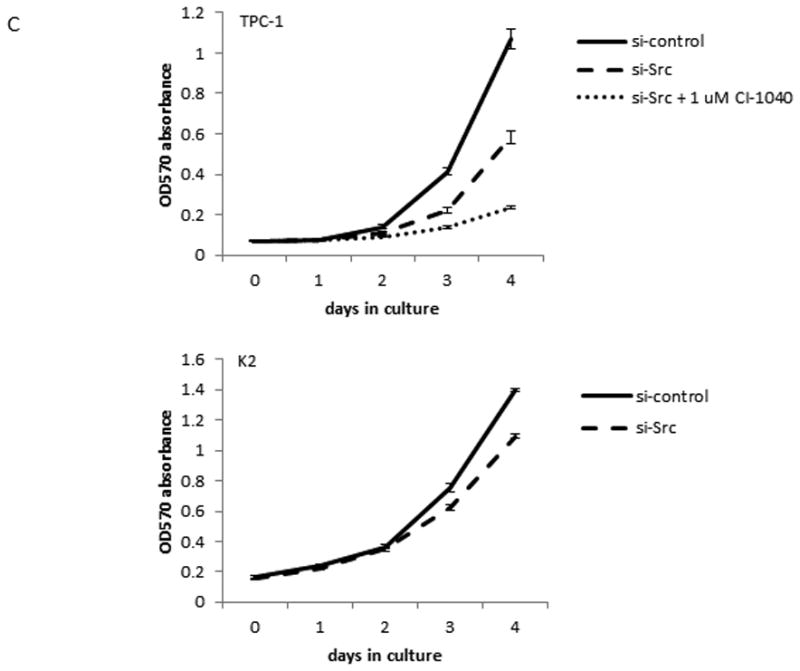
Src inhibitors suppress cell proliferation in TPC-1 cells only. The proliferation assay was done using MTT to determine the number of cells by measuring the absorption at 570 nM each day. Each time point was determined in triplicates and all assays were repeated at least once. (A) TPC-1 cells were treated with 0.1 or 1 μM PP2, 0.1 or 1 μM SU6656, or 0.01 or 0.1 μM dasatinib for indicated days at 37°C. (B) K2 cells were treated with 5 or 10 μM PP2, 5 or 10 μM SU6656, or 0.01 or 0.1 μM dasatinib for indicated days at 37°C. (C) TPC-1 and K2 cells were transfected with si-control or si-Src and plated in 24-well plates in triplicate at day 0 and cell growth was monitored for indicated days at 37°C. CI-1040 (1 μM) was added to TPC-1 cells transfected with si-Src RNA and DMSO was added to TPC-1 cells transfected with si-control or si-Src as controls at day 0 after cells were attached to plates.
Table 1. Summary of TPC-1 growth on day 4 using combination of CI-1040 and Src inhibitors.
| Treatment | Reduction (%) | p value vs mock* | p value vs CI-1040 alone* |
|---|---|---|---|
| 1 μM CI-1040 | 59.7 | < 0.001 | n/a |
| 0.1 μM PP2 | 36.2 | < 0.001 | n/a |
| 1 μM CI-1040 + 0.1 μM PP2 | 73.1 | < 0.001 | <0.007 |
| 1 μM PP2 | 71.4 | < 0.001 | n/a |
| 1 μM CI-1040 + 1 μM PP2 | 87 1 | < 0.001 | <0.001 |
| 0.1 μM SU6656 | 29.9 | < 0.001 | n/a |
| 1 μM CI-1040 + 0.1 μM SU6656 | 68.7 | < 0.001 | 0.01 |
| 1 μM SU6656 | 61.4 | < 0.001 | n/a |
| 1 μM CI-1040 + 1 μM su6656 | 77.5 | < 0.001 | <0.001 |
| 0.01 μM Dasatinib | 36.7 | < 0.001 | n/a |
| 1 μM CI-1040 + 0.01 μM Dasatinib | 74.0 | < 0.001 | 0.001 |
| 0.1 μM Dasatinib | 69.2 | < 0.001 | n/a |
| 1 μM CI-1040 + 0.1 μM Dasatinib | 84.8 | < 0.001 | <0.001 |
p value was determined by Student t-test
The MEK1/2 inhibitor CI-1040 (1 μM) repressed TPC-1 cell growth for 59.7 % (p < 0.001) after 4 days of treatment. When CI-1040 was combined with 0.1 or 1 μM PP2, the TPC-1 cell growth was suppressed for 73.1 (p < 0.001 vs mock and p < 0.007 vs CI-1040 alone) or 87.1% (p < 0.001 vs mock or CI-1040 alone), respectively, after 4 days of treatment (Table 1). When CI-1040 was combined with 0.1 or 1 μM SU6656, the TPC-1 cell growth was suppressed for 68.7 (p < 0.001 vs mock and p = 0.01 vs CI-1040 alone) or 77.5% (p < 0.001 vs mock or CI-1040 alone). In the presence of CI-1040 and 0.01 or 0.1 μM dasatinib, the growth of TPC-1 after 4 days treatment was suppressed for 74.0 (p < 0.001 vs mock and p = 0.001 vs CI-1040 alone) or 84.8% (p < 0.001 vs mock or CI-1040 alone, Table 1).
A much higher concentration of PP2 and SU6656 is needed to see a significant growth inhibition in K2 cells than in TPC-1 cells. In K2 cells after 4 days of treatment, the cell growth was repressed for 36.5 or 50.9% (p < 0.001) by 5 or 10 μM PP2, or 34 or 52.4% (p < 0.001) by 5 or 10 μM SU6656, respectively, when compared to untreated cells (Figure 4B and Table 2). When dasatinib was used at 0.1 μM, the growth inhibition in K2 cells was detected at 27.5% (p < 0.001, Figure 4B and Table 2). No significant growth inhibition was detected when K2 cells was treated with 0.01 μM dasatinib.
Table 2. Summary of K2 growth on day 4.
| Treatment | Reduction (%) | p value* |
|---|---|---|
| 5 μM PP2 | 36.5 | < 0.001 |
| 10 μM PP2 | 50.9 | < 0.001 |
| 5 μM SU6656 | 34.0 | < 0.001 |
| 10 μM SU6656 | 52.4 | < 0.001 |
| 0.01 μM Dasatinib | 3.5 | 0.1 |
| 0.1 μM Dasatinib | 27.5 | < 0.001 |
p value was determined by Student t-est
The effect of growth inhibition by Src inhibitors was confirmed by si-Src. When TPC-1 cells transfected with si-Src, the suppression of p-Src and total c-Src expressions was detected at 48 h by Western blot analysis (Figure 3A). However, TPC-1 cell growth was not suppressed until day 3 and to a maximum of 45.3% (p < 0.001) on day 4 when compared to cells transfected with si-control (Figure 4C). When CI-1040 was added to the TPC-1 cells transfected with si-Src, a significant growth inhibition (59.5%, p< 0.001) was detected compared to si-Src only and a total of 77.9% (p< 0.001) growth inhibition was detected compared with si-control (Figure 4C and Table 3). In K2 cells, growth inhibition, 21.9% (p< 0.001), was observed when cells were transfected with si-Src (Figure 4C and Table 3).
Table 3. Summary of PTC cell growth on day 4 with si-Src.
| Cell lines | si-RNA used | Reduction vs si-control (%) | p value vs si-control* | Reduction vs si-Src (%) | p value vs si-Src* |
|---|---|---|---|---|---|
| TPC-1 | si-Src | 45.3 | < 0.001 | n/a | n/a |
| si-Src + 1 μM CI-1040 | 77.9 | < 0.001 | 59.5 | < 0.001 | |
| K2 | si-Src | 21.9 | < 0.001 | n/a | n/a |
p value was determined by Student t-test
Dasatinib Reduced Tumor Volume In Vivo
Our in vitro data suggested that PP2, SU6656, and dasatinib inhibited Src signal transduction in PTC cells. This prompted us to investigate the effect of Src inhibitors in vivo. Since PP2 and SU6656 could not be used in vivo, dasatinib was selected as the Src inhibitor for animal studies. Dasatinib has demonstrated inhibitory effects on Src, ABL, DDR2, and PDGF kinases.11, 15 Since PTC cells do not carry the BCR/ABL translocation, the expression of ABL kinase is undetectable in PTC cells.16 Using an orthotopic xenograft mouse model, a significant reduction in average tumor volume was observed in TPC-1 mice treated with dasatinib either once (QD, 581.6±159 mm3 treatment vs. 784±168.5 mm3 control, p = 0.008) or twice daily (BID, 607.6±298.3 mm3 treatment vs. 1011.7±327.5 mm3 control, p = 0.007) and in K2 mice treated BID (513.3± 250.9 mm3 treatment vs. 846.4±286.9 mm3 control, p = 0.019) compared with vehicle-treated controls (Figure 5A). However, when K2 mice were treated with dasatinib QD (663±430 mm3 treatment vs. 808.9±283.8 mm3 control, p = 0.4), no significant change in average tumor volume was detected. Alternatively, the tumor growth could be monitored from the luciferase images of TPC-1 and K2 mice. About 3 out of 13 (23.1%) TPC-1 or K2 mice treated with dasatinib QD showed decreased or undetectable luciferase activity while all TPC-1 or K2 mice treated with vehicle showed increased activity after 1 week of treatment (supplemental Figures 1A and 1C). When TPC-1 mice were treated with dasatinib BID, 6 of 14 (42.9%) mice showed decreased or undetectable luciferase activity compared to 2 of 10 (20%) mice treated with vehicle after 1 week of treatment (supplemental Figure 2A). After treating TPC-1 mice with dasatinib BID for 2 weeks, all remaining 2 mice showed increased luciferase activity as well as 4 remaining mice treated with vehicle. In K2 mice treated with dasatinib BID, 7 of 13 (53.9%) showed decreased or undetectable luciferase activity compared to 2 of 10 (20%) mice treated with vehicle after 1 week of treatment (supplemental Figure 2C). After 2 weeks of treatment with dasatinib BID, 3 of 12 (25%) remaining K2 mice showed decreased or undetectable luciferase activity compared to increased luciferase activity in all 8 (100%) remaining K2 mice treated with vehicle.
Figure 5.
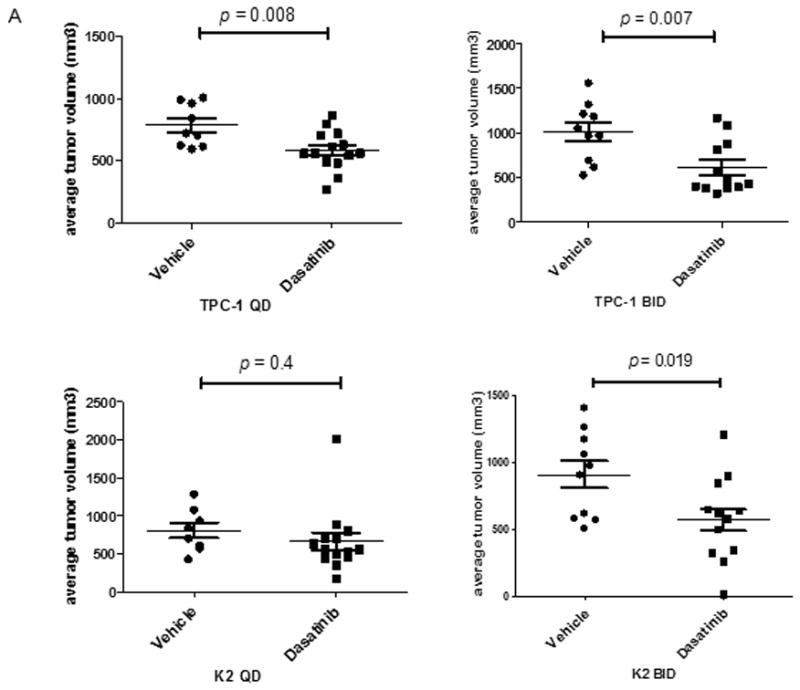
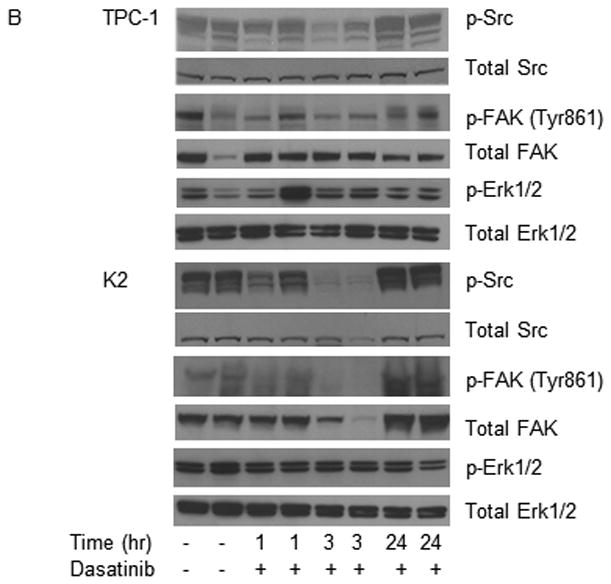
Dasatinib reduces tumor volume in vivo. For the in vivo studies, dasatinib (30 mg/mL) was dissolved in 80 mM citric acid overnight at room temperature (protected against light) and stored at 4°C for up to 2 weeks. Before being administered to the mice, dissolved dasatinib was diluted in 80 mM citric buffer (pH 3) to 2.5 mg/mL. (A) TPC-1 (top) and K2 (bottom) cells carrying luciferase were inoculated in situ into the right thyroid lobe of Ncr-nu/nu mice. Dasatinib (15 mg/kg) was delivered by oral gavage either once (QD) or twice (BID) a day in two treatment plans. Average tumor volumes (mm3) were calculated at the end of treatment cycle, plotted in Scatter plots, and t-test was performed using Prism 5.0. (B) Mice were inoculated with TPC-1 or K2 cells. After confirmation the tumor growth in mice by luciferase bioluminescent imaging, mice were treated with 15 mg/kg dasatinib once at 0 h and tumors were harvested at 1, 3, or 24 hr. Phosphorylations of Src and FAK at Tyr 861 site were detected on Western blots. Total Src and total FAK were used as loading controls. (C) Same as in (B) except mice were treated with 15 mg/kg dasatinib twice (12 h apart) and protein extracts were prepared from tumor after 2nd treatment at 1, 3, 6, or 12 hr. The 2nd and the 3rd lanes of vehicle control were from the same mouse and total of 2 tumors from vehicle was shown here.
To verify direct cellular targeting effects of dasatinib in vivo, we examined the phosphorylations of Src and FAK (Tyr 861) in mice with TPC-1 or K2 tumors after treating mice with dasatinib QD (Figure 5B) or BID (Figure 5C). For mice treated with dasatinib QD, the expression of p-Src was suppressed at 3 h only in both TPC-1 and K2 tumors (Figure 5B). Little or no change in the expression of p-FAK (Tyr 861) was observed in both TPC-1 and K2 tumors. The expression of p-Src, p-FAK (Tyr 861), and p-ERK1/2 remain unchanged in all TPC-1 and K2 tumors at the end of the QD treatment (up to 10 days for TPC-1 mice and up to 26 days for K2 mice, supplemental Figures 1B and 1D). For mice treated with dasatinib BID, the suppression of Src phosphorylation was observed 1 h after treatment and lasted up to 12 h in both TPC-1 and K2 tumors (Figure 5C). The expression of total Src was not changed during the dasatinib intervention. The expression of p-FAK (Tyr 861) was inhibited at 1 h and lasted up to 6 h in both TPC-1 and K2 tumors. No change was observed in the expression of total FAK in both types of tumors. The effects of dasatinib on the expression of p-Src and p-ERK1/2 were confirmed in TPC-1 and K2 tumors (from Figure 5A) which were harvested at the end of BID treatment. The expression of p-Src was completely suppressed in both TPC-1 and K2 mice (supplemental Figures 2B and 2D, respectively). The expression of total Src, p-ERK1/2, and total ERK1/2 was not changed in either TPC-1 or K2 tumors treated with dasatinib BID, and the expression of p-FAK was not detectable (data not shown).
Discussion
In this study, we examined the role of Src signaling transduction pathway in PTC cells. We found that PP2, SU6656, or dasatinib was able to suppress the phosphorylation of Src in both TPC-1 and K2 cells in a dose-dependent manner and PP2 and dasatinib inhibit the phosphorylation of its downstream effector, FAK, at Tyr 861, which is a phosphorylation site regulated by Src. Because none of the available inhibitors to Src are specific against c-Src only, we used si-Src RNA to determine whether the specificity was due to Src. Si-Src suppressed the expression of Src and decreased the phosphorylation of FAK at Tyr-861 in both TPC-1 and K2 cells; and this confirmed the effects of PP2, SU6656, or dasatinib on PTC cells were through the inhibition of the Src signaling transduction pathway, although it did not preclude the effect of Src inhibitors through other signaling transduction pathways. The inhibitory effect of dasatinib on TPC-1 cells was also reported by Caccia et al.17 and our data confirm their findings. The ability of Src inhibitors to suppress the phosphoryaltion of Src and its downstream effector FAK at Tyr 861 was also confirmed in BCPAP cells (another PTC cell line carrying a BRAF mutation, data not shown). Since there is only 1 PTC cell line carrying the RET/PTC1 rearrangement available, we were unable to test the effects of Src inhibitors in another PTC cell line carrying the RET/PTC rearrangements.
Phosphorylation of ERK1/2 results in activation of a variety of transcription factors that regulate cellular proliferation, differentiation, and apoptosis.3 Previous studies using MEK1/2 inhibitors showed that suppression of p-ERK1/2 in RET/PTC1-rearranged PTC cells (TPC-1) was only temporary and lasted 6-8 h, unlike PTC cells carrying the BRAF mutation (K2 cells) where suppression of ERK1/2 phosphorylation lasted at least 4 days in the presence of CI-1040. These data suggested that other signaling transduction pathways may exist and affect ERK1/2 phosphorylation in TPC-1 cells. Carlomagno et al.18 have reported that the ERK1/2 phosphorylation was suppressed at 6 h in TPC-1 cells treated with 5 μM PP2 and this is in agreement with our finding. To extend the dephosphorylation of p-ERK1/2 in TPC-1 cells, we found that Src inhibitors can be used in combination with the MEK1/2 inhibitor, CI-1040. In combination of CI-1040 and PP2, the suppression of p-ERK1/2 expression was extended to up to 16 h compared to 6 or 8 h when using 5 or 10 μM PP2 alone, respectively. When CI-1040 was used with 5 or 10 μM SU6656, the suppression of p-ERK1/2 expression lasted up to 96 h compared to up to 16 h when using 5 or 10 μM SU6656 alone. Dasatinib alone did not suppress the expression of p-ERK1/2 at any tested time points, however in combination with CI-1040, was able to suppress the expression of p-ERK1/2 for up to 6 h with 0.01 or 0.1 μM. This effect of Src inhibitors was confirmed in studies with si-Src and CI-1040, which decreased the phosphorylation of ERK1/2 for up to 4 days. These data suggested that there are at least two pathways regulating the phosphorylation of ERK1/2 in TPC-1 cells, one through MEK/ERK and the other through Src/ERK. When either MEK or Src inhibition was used alone, the suppression of p-ERK1/2 expression is short lived due to the activation of the other pathway. When both pathways are blocked by a combination of MEK1/2 and Src inhibition, the suppression on the expression of p-ERK1/2 was prolonged. Since RET/PTC rearrangement is unique in PTC, we were unable to test this effect in another system.
From our previous experience using MEK1/2 inhibitors, K2 cells carrying BRAF mutation are regulated through MEK/ERK pathway only and no evidence of other signaling transduction pathway is involved at this point. Thus, PP2, SU6656, or dasatinib was unable to suppress the ERK1/2 phosphorylation. However, MEK inhibitor CI-1040 was able to suppress the expression of p-ERK1/2 significantly in these cells. Although we have shown a brief suppression of p-ERK1/2 by PP2 and SU6656 alone, dasatinib alone was unable to suppression the expression of p-ERK1/2 in TPC-1 cells. Similarly, we did not detect any changes in ERK1/2 phosphorylation in vivo from PTC mice tumors treated with dasatinib.
From our previous studies, we have shown that the growth of PTC cells carrying a BRAF mutation could be suppressed completely in vitro and in vivo by MEK1/2 inhibitors, but not in PTC cells carrying RET/PTC1 rearrangement.6, 7 Mechanistically we sought to determine whether Src inhibitors regulating growth. We found that PP2, SU6656, or dasatinib was able to suppress cell proliferation in TPC-1 cells in a dose-dependent manner. In the presence of both CI-1040 and any of the 3 Src inhibitors, a statistical significant additive growth inhibition was observed in TPC-1 cells in a dose-dependent manner when compared to treat with CI-1040 or any Src inhibitors alone. This effect of growth inhibition using Src inhibitors in TPC-1 cells was also confirmed by si-Src. No effects on cell growth were detected when 0.1 or 1 μM PP2 and 0.1 or 1 μM SU6656 were used in BRAF-mutated K2 cells (data not shown). A much high concentration of PP2 and SU6656 (at 5 or 10 μM) was required to observe growth inhibition in K2 cells. Partial growth inhibition (27.5% reduction) was detected in K2 cells when 0.1 μM dasatinib was used. The growth inhibition by Src inhibitors detected in K2 cells was also confirmed by si-Src. These data suggested that TPC-1 cells utilize both MEK/ERK and Src/ERK signaling transduction pathways to regulate their proliferation and that Src signaling transduction pathway was only partially involved in regulating growth in K2 cells.
Dasatinib has been shown to reduce tumor volume in prostate cancer,9 pancreatic cancer,19 and multiple myeloma.20 No reports on the effects of dasatinib in PTC are available in vivo, although dasatinib has been tested by others in vitro.17 Since dasatinib has a short in vivo half-life (less than 4 h) in humans,21 we treated mice either once (QD) or twice (BID) daily. The effects of dasatinib in vivo were measured in three different approaches, by tumor volume at end of treatment, by luciferase bioimaging to monitor tumor growth in real-time, and by Western blot analysis from tumors for the expression of p-Src. When mice were treated with dasatinib QD, tumor volume was significantly reduced in mice carrying TPC-1 tumors and no reduction was detected in mice carrying K2 tumors; about 23.1% TPC-1 or K2 mice showed decrease or undetectable luciferase activity after 1 week of dasatinib QD treatment while 100 % mice treated with vehicle showed 100% increase in luciferase activity; and the suppression on the expression of Src phosphorylation was minimal at 3 h only in a time course study and no suppression was detected in mice tumors harvested at the end of treatment cycle as all tumors were harvested around 24 h after the last dose was administrated. When mice were treated with dasatinib BID, tumor volume was significantly reduced in both TPC-1and K2 mice at the end of treatment cycle; 42.9% TPC-1 mice and 53.9% K2 mice showed decreased or undetectable luciferase activity compared to 20% mice treated with vehicle after 1 week of treatment, after 2 weeks of treatment with dasatinib BID, 25% remaining K2 mice showed decreased or undetectable luciferase activity while increased luciferase activity was detected in all remaining K2 mice treated with vehicle. Eventually, all mice treated with dasatinib showed an increased luciferase activity. This may explain the insistency of K2 tumor volume vs K2 luciferase bioimaging when treated with dasatinib QD, where luciferase activity was measured in real-time and tumor volume was measured when mice were sacrificed due to weight loss or tumor burden; and the expression of p-Src was significantly suppressed in both TPC-1 and K2 tumors from either a time course study or end of treatment cycle. Tumor volume alone may not be enough to interpreter the effect of dasatinib in vivo. A combination of luciferase bioimaging, tumor volume, and the expression of p-Src should be used to interpret the results of in vivo dasatinib study. In this case, BID treatment is much more effective than QD treatment for both TPC-1 and K2 tumors.
We did not observe any changes in survival when PTC was treated with dasatinib on either dosing schedule (data not shown), although we demonstrated that dasatinib when given in BID inhibited the phosphorylation of Src in both types of PTC tumors. Using a different Src inhibitor, Kim et al. have shown that SKI-606 reduced tumor growth and improved survival in a mouse thyroid model.22 Therefore, questions remain with respect to which signaling pathways are directly involved in regulating survival in RET/PTC-rearranged PTC cells. Besides the Src/FAK pathway, the AKT signaling pathway has been shown in cells other than PTC to be involved in the regulation of Src signaling pathway.23 In PTC cells, the effects of Src inhibitors were inconclusive on the expression of p-AKT and si-Src did not significantly suppress the expression of p-AKT (data not shown). Src signaling transduction pathway has also been implicated to be involved in cancer metastasis and invasion.24 Although our orthotopic mouse model was not designed for testing metastasis, the in vitro cell invasion assay did not show a significant inhibition in invasion when Src inhibitors or si-Src were used in PTC cells (data not shown).
In conclusion, we found that in addition to the MEK/ERK signaling transduction pathway, Src may play an important role in regulating growth in PTC cells. Inhibition of the Src signaling transduction pathway alone was effective in reducing PTC tumor volume but did not affect survival. The clinical impact of this tumor volume change remains in question. Therefore, combination therapy with complementary inhibitors of other signaling transduction pathways may be necessary to improve overall survival.
Supplementary Material
Supplemental Figure 1. Dasatinib suppresses tumor growth when administrated QD. (A) TPC-1 mice were treated with vehicle or dasatinib QD and tumor growth was monitored by luciferase activity through Xenogen bioimaging. Luciferase activities before treatment and 1 week after dasatinib treatment were shown here. All mice were sacrificed within 10 days after starting of dasatinib treatment. (B) Protein extracts were prepared from selected mice from (A) and the expressions of p-Src, p-FAK (Tyr 861), and p-ERK1/2 were detected by Western blot analysis. Total Src, total FAK, and total ERK1/2 were used as loading controls. (C) K2 mice were treated with vehicle or dasatinib QD and tumor growth was monitored by luciferase activity through Xenogen bioimaging. Luciferase activities before treatment and 1 week after dasatinib treatment were shown here. All mice were sacrificed within 26 days after starting of dasatinib treatment. (D) Protein extracts were prepared from selected mice from (C) and the expressions of p-Src, p-FAK (Tyr 861), and p-ERK1/2 were detected by Western blot analysis. Total Src, total FAK, and total ERK1/2 were used as loading controls.
Supplemental Figure 2. Dasatinib suppresses tumor growth when administrated BID. (A) TPC-1 mice were treated with vehicle or dasatinib BID and tumor growth was monitored by luciferase activity through Xenogen bioimaging. Luciferase activities before treatment and 1 or 2 weeks after dasatinib treatment were shown here. All mice were sacrificed within 18 days after starting of dasatinib treatment. (B) Frozen tumors embedded in OCT were thawed in 0.8% sodium chloride solution on ice and protein extracts were prepared from selected mice from (A) and the expressions of p-Src and p-ERK1/2 were detected by Western blot analysis. Total Src and total ERK1/2 were used as loading controls. (C) K2 mice were treated with vehicle or dasatinib BID and tumor growth was monitored by luciferase activity through Xenogen bioimaging. Luciferase activities before treatment and 1 or 2 weeks after dasatinib treatment were shown here. All mice were sacrificed within 31 days after starting of dasatinib treatment. (D) Protein extracts were prepared from selected mice from (C) and the expressions of p-Src and p-ERK1/2 were detected by Western blot analysis. Total Src and total ERK1/2 were used as loading controls.
Acknowledgments
This research was partly supported by The Michael A. O'Bannon Endowment for Cancer Research, The Betty Berry Cancer Research Fund, The Alando J. Ballantyne Distinguished Chair Fund, donations from Marty Schaffel, Abraham Rosenthal and Kevin Weinrich, and National Cancer Institute Cancer Center Support (CORE) Grant CA 16672 for media production. S.Y.L. was supported in part by a National Institutes of Health Mentored Career Development Award K08 DE018061. We thank Dr. John Araujo for providing the dasatinib; Dr. Judith Sebolt-Leopold from Pfizer Global Research and Development (Ann Arbor, MI) for providing CI-1040; Dr. Jerome Hershman from VA Greater Los Angeles Healthcare System (Los Angeles, CA) for providing TPC-1 cells; Dr. D. Wynford-Thomas from Cardiff University (Cardiff, United Kingdom) for providing K2 cells; Dr. Dianna Roberts for statistical analysis; and Kelli Cottingham, Tina Camacho, and Samar Jasser for technical support.
Footnotes
Part of this study was presented at 2011 AHNS meeting
References
- 1.Ain KB. Papillary thyroid carcinoma. Etiology, assessment, and therapy. Endocrinol Metab Clin North Am. 1995;24(4):711–760. [PubMed] [Google Scholar]
- 2.Bilimoria KY, Bentrem DJ, Ko CY, et al. Extent of surgery affects survival for papillary thyroid cancer. Ann Surg. 2007;246(3):375–81. doi: 10.1097/SLA.0b013e31814697d9. discussion 381-4. [DOI] [PMC free article] [PubMed] [Google Scholar]
- 3.Davies H, Bignell GR, Cox C, et al. Mutations of the BRAF gene in human cancer. Nature. 2002;417(6892):949–954. doi: 10.1038/nature00766. [DOI] [PubMed] [Google Scholar]
- 4.Ciampi R, Nikiforov YE. RET/PTC rearrangements and BRAF mutations in thyroid tumorigenesis. Endocrinol. 2007;148(3):936–941. doi: 10.1210/en.2006-0921. [DOI] [PubMed] [Google Scholar]
- 5.Henderson YC, Fredrick MJ, Clayman GL. Differential responses of human papillary thyroid cancer cell lines carrying the RET/PTC1 rearrangement or a BRAF mutation to MEK1/2 inhibitors. Arch Otolaryngol Head Neck Surg. 2007;133(8):810–815. doi: 10.1001/archotol.133.8.810. [DOI] [PubMed] [Google Scholar]
- 6.Henderson YC, Ahn SH, Clayman GL. Inhibition of the Growth of Papillary Thyroid Carcinoma Cells by CI-1040. Arch Otolaryngol Head Neck Surg. 2009;135(4):347–354. doi: 10.1001/archoto.2009.17. [DOI] [PMC free article] [PubMed] [Google Scholar]
- 7.Henderson YC, Chen Y, Frederick MJ, Lai SY, Clayman GL. MEK Inhibitor PD0325901 Significantly Reduces the Growth of Papillary Thyroid Carcinoma Cells In vitro and In vivo. Molecular Cancer Therapeutics. 2010;9(7):1968–1976. doi: 10.1158/1535-7163.MCT-10-0062. [DOI] [PMC free article] [PubMed] [Google Scholar]
- 8.Yeatman TJ. A renaissance for SRC. Nat Rev Cancer. 2004;4(6):470–80. doi: 10.1038/nrc1366. [DOI] [PubMed] [Google Scholar]
- 9.Park SI, Zhang J, Phillips KA, et al. Targeting Src Family Kinases Inhibits Growth and Lymph Node Metastases of Prostate Cancer in an Orthotopic Nude Mouse Model. Cancer Res. 2008;68(9):3323–3333. doi: 10.1158/0008-5472.CAN-07-2997. [DOI] [PubMed] [Google Scholar]
- 10.Johnson FM, Gallick GE. SRC family nonreceptor tyrosine kinases as molecular targets for cancer therapy. Anticancer Agents Med Chem. 2007;7(6):651–9. doi: 10.2174/187152007784111278. [DOI] [PubMed] [Google Scholar]
- 11.Araujo J, Logothetis C. Dasatinib: A potent SRC inhibitor in clinical development for the treatment of solid tumors. Cancer Treat Rev. 2010;36(6):492–500. doi: 10.1016/j.ctrv.2010.02.015. [DOI] [PMC free article] [PubMed] [Google Scholar]
- 12.Lombardo LJ, Lee FY, Chen P, et al. Discovery of N-(2-chloro-6-methyl- phenyl)-2-(6-(4-(2-hydroxyethyl)- piperazin-1-yl)-2-methylpyrimidin-4-ylamino)thiazole-5-carboxamide (BMS-354825), a dual Src/Abl kinase inhibitor with potent antitumor activity in preclinical assays. J Med Chem. 2004;47(27):6658–61. doi: 10.1021/jm049486a. [DOI] [PubMed] [Google Scholar]
- 13.Byers LA, Sen B, Saigal B, et al. Reciprocal Regulation of c-Src and STAT3 in Non-Small Cell Lung Cancer. Clin Cancer Res. 2009;15(22):6852–6861. doi: 10.1158/1078-0432.CCR-09-0767. [DOI] [PMC free article] [PubMed] [Google Scholar]
- 14.Ahn SH, Henderson Y, Kang Y, et al. An orthotopic model of papillary thyroid carcinoma in athymic nude mice. Arch Otolaryngol Head Neck Surg. 2008;134(2):190–7. doi: 10.1001/archoto.2007.36. [DOI] [PubMed] [Google Scholar]
- 15.Day E, Waters B, Spiegel K, et al. Inhibition of collagen-induced discoidin domain receptor 1 and 2 activation by imatinib, nilotinib and dasatinib. Eur J Pharmacol. 2008;599(1-3):44–53. doi: 10.1016/j.ejphar.2008.10.014. [DOI] [PubMed] [Google Scholar]
- 16.Schweppe RE, Kerege AA, French JD, Sharma V, Grzywa RL, Haugen BR. Inhibition of Src with AZD0530 Reveals the Src-Focal Adhesion Kinase Complex as a Novel Therapeutic Target in Papillary and Anaplastic Thyroid Cancer. J Clin Endocrinol Metab. 2009;94(6):2199–2203. doi: 10.1210/jc.2008-2511. [DOI] [PMC free article] [PubMed] [Google Scholar]
- 17.Caccia D, Micciche F, Cassinelli G, Mondellini P, Casalini P, Bongarzone I. Dasatinib reduces FAK phosphorylation increasing the effects of RPI-1 inhibition in a RET/PTC1-expressing cell line. Mol Cancer. 2010;9:278. doi: 10.1186/1476-4598-9-278. [DOI] [PMC free article] [PubMed] [Google Scholar]
- 18.Carlomagno F, Vitagliano D, Guida T, et al. Efficient Inhibition of RET/Papillary Thyroid Carcinoma Oncogenic Kinases by 4-Amino-5-(4-Chloro-Phenyl)-7-(t-Butyl)Pyrazolo[3,4-d]Pyrimidine (PP2) J Clin Endocrinol Metab. 2003;88(4):1897–1902. doi: 10.1210/jc.2002-021278. [DOI] [PubMed] [Google Scholar]
- 19.Trevino JG, Summy JM, Lesslie DP, et al. Inhibition of Src Expression and Activity Inhibits Tumor Progression and Metastasis of Human Pancreatic Adenocarcinoma Cells in an Orthotopic Nude Mouse Model. Am J Pathol. 2006;168(3):962–972. doi: 10.2353/ajpath.2006.050570. [DOI] [PMC free article] [PubMed] [Google Scholar]
- 20.Coluccia AML, Cirulli T, Neri P, et al. Validation of PDGFRβ and c-Src tyrosine kinases as tumor/vessel targets in patients with multiple myeloma: preclinical efficacy of the novel, orally available inhibitor dasatinib. Blood. 2008;112(4):1346–1356. doi: 10.1182/blood-2007-10-116590. [DOI] [PubMed] [Google Scholar]
- 21.Christopher LJ, Cui D, Wu C, et al. Metabolism and Disposition of Dasatinib after Oral Administration to Humans. Drug Metabolism and Disposition. 2008;36(7):1357–1364. doi: 10.1124/dmd.107.018267. [DOI] [PubMed] [Google Scholar]
- 22.Kim WG, Guigon CJ, Fozzatti L, et al. SKI-606, an Src Inhibitor, Reduces Tumor Growth, Invasion, and Distant Metastasis in a Mouse Model of Thyroid Cancer. Clin Cancer Res. 2012;18(5):1281–1290. doi: 10.1158/1078-0432.CCR-11-2892. [DOI] [PMC free article] [PubMed] [Google Scholar]
- 23.Summy JM, Gallick GE. Treatment for Advanced Tumors: Src Reclaims Center Stage. Clin Cancer Res. 2006;12(5):1398–1401. doi: 10.1158/1078-0432.CCR-05-2692. [DOI] [PubMed] [Google Scholar]
- 24.Summy JM, Gallick GE. Src family kinases in tumor progression and metastasis. Cancer Metastasis Rev. 2003;22(4):337–358. doi: 10.1023/a:1023772912750. [DOI] [PubMed] [Google Scholar]
Associated Data
This section collects any data citations, data availability statements, or supplementary materials included in this article.
Supplementary Materials
Supplemental Figure 1. Dasatinib suppresses tumor growth when administrated QD. (A) TPC-1 mice were treated with vehicle or dasatinib QD and tumor growth was monitored by luciferase activity through Xenogen bioimaging. Luciferase activities before treatment and 1 week after dasatinib treatment were shown here. All mice were sacrificed within 10 days after starting of dasatinib treatment. (B) Protein extracts were prepared from selected mice from (A) and the expressions of p-Src, p-FAK (Tyr 861), and p-ERK1/2 were detected by Western blot analysis. Total Src, total FAK, and total ERK1/2 were used as loading controls. (C) K2 mice were treated with vehicle or dasatinib QD and tumor growth was monitored by luciferase activity through Xenogen bioimaging. Luciferase activities before treatment and 1 week after dasatinib treatment were shown here. All mice were sacrificed within 26 days after starting of dasatinib treatment. (D) Protein extracts were prepared from selected mice from (C) and the expressions of p-Src, p-FAK (Tyr 861), and p-ERK1/2 were detected by Western blot analysis. Total Src, total FAK, and total ERK1/2 were used as loading controls.
Supplemental Figure 2. Dasatinib suppresses tumor growth when administrated BID. (A) TPC-1 mice were treated with vehicle or dasatinib BID and tumor growth was monitored by luciferase activity through Xenogen bioimaging. Luciferase activities before treatment and 1 or 2 weeks after dasatinib treatment were shown here. All mice were sacrificed within 18 days after starting of dasatinib treatment. (B) Frozen tumors embedded in OCT were thawed in 0.8% sodium chloride solution on ice and protein extracts were prepared from selected mice from (A) and the expressions of p-Src and p-ERK1/2 were detected by Western blot analysis. Total Src and total ERK1/2 were used as loading controls. (C) K2 mice were treated with vehicle or dasatinib BID and tumor growth was monitored by luciferase activity through Xenogen bioimaging. Luciferase activities before treatment and 1 or 2 weeks after dasatinib treatment were shown here. All mice were sacrificed within 31 days after starting of dasatinib treatment. (D) Protein extracts were prepared from selected mice from (C) and the expressions of p-Src and p-ERK1/2 were detected by Western blot analysis. Total Src and total ERK1/2 were used as loading controls.


