Abstract
Purpose
This study investigates amide proton transfer (APT) and nuclear overhauser enhancement (NOE) in phantoms and 9L tumors in rat brains at 9.4 Tesla, using a recently developed method that can isolate different contributions to exchange.
Methods
Chemical exchange rotation transfer (CERT) was used to quantify APT and NOEs through subtraction of signals acquired at two irradiation flip angles, but with the same average irradiation power.
Results
CERT separates and quantifies specific APT and NOE signals without contamination from other proton pools, and thus overcomes a key shortcoming of conventional CEST asymmetry approaches. CERT thus has increased specificity, though at the cost of decreased signal strength. In vivo experiments show that the APT effect acquired with CERT in 9L rat tumors (3.1%) is relatively greater than that in normal tissue (2.5%), which is consistent with previous CEST asymmetry analysis. The NOE effect centered at −1.6 ppm shows substantial image contrast within the tumor and between the tumor and the surrounding tissue, while the NOE effect centered at −3.5 ppm shows little contrast.
Conclusion
CERT provides an image contrast that is more specific to chemical exchange than conventional APT by means of asymmetric CEST Z-spectra analysis.
Keywords: chemical exchange saturation transfer (CEST), chemical exchange rotation transfer (CERT), amide proton transfer (APT), nuclear overhauser enhancement (NOE)
INTRODUCTION
Magnetization transfer (MT) provides a unique mechanism for producing contrast and makes MRI sensitive to the presence of metabolites, mobile macromolecules, and semisolid macromolecules through their effects on the water signal (1–3). Conventionally, an off-resonance irradiation (continuous-wave [CW] or a series of shaped pulses) is applied to saturate targeted protons, and the bulk water signal is attenuated through chemical exchange or dipolar–dipolar cross-relaxation with these saturated nuclei. By measuring the attenuated water signal, properties of the molecules can be indirectly detected.
Amide proton transfer (APT) imaging (4–12), which originates from the chemical exchange of nitrogen bound amide protons with oxygen bound water protons, has shown promise for detecting variations in endogenous protein and peptide contents and for probing tissue microenvironments and pH. Possible clinical applications of APT include the detection of brain tumors, stroke, and multiple sclerosis. In distinction, peaks originating from nuclear Overhauser enhancement (NOE) (also sometimes referred to as the nuclear Overhauser effect) occur at the frequency of carbon bound protons, and hence the coupling with water protons is ascribed to direct through-space dipolar interactions or indirect coupling by means of separate chemically exchanging sites (1,13). (The exact mechanism behind the NOE peaks is an area of active research.) Sources of NOE peaks in brain include proteins/peptides, lipids, or restricted metabolites (1–3,14).
Typical experiments for assessing APT or NOEs measure the water magnetization while varying the saturation irradiation frequency. The resulting “Z-spectrum” shows dips from exchangeable sites (–NH2, –NH, and OH) at downfield frequencies and NOE dips at upfield frequencies from water. Quantitative mapping of such effects using conventional asymmetric analyses is confounded by cross contaminations from both exchangeable sites and NOEs. An alternative approach is to quantify amide and NOE effects by fitting the direct water effects and examining deviations from the fit (15,16). However, the fitted curves are affected by several proton exchanging sites, making interpretation difficult. We recently reported a modified method, chemical exchange rotation transfer (CERT), which can quantify amide proton transfer (APT) through subtraction of CEST signals at two irradiation flip angles instead of two frequency offsets, which potentially provides a more specific amide signal (17,18). Here, we demonstrate the application of CERT to in vivo mapping of APT in a 9L glioma in rat brain at 9.4 Tesla (T). In addition, we expand the concept of rotation transfer in CERT to NOE dipolar interactions as they can also be modeled as z-magnetization exchange between distinct pools. In vivo mapping of NOE peaks at −1.6 and −3.5 ppm from water in a 9L rat glioma model was also performed.
METHODS
CEST versus CERT
The CERT MTRdouble metric (Eq. [1]) is calculated by the subtraction of signals after pulse-train saturation at two net nutation angles (but constant average power). In distinction, the conventional CEST MTRasym metric (Eq. [2]) comes from the subtraction at two frequencies:
| [1] |
| [2] |
where (+) represents the offset of the exchanging species and (−) is the symmetric offset on the opposite side of the water peak. (π) and (2π) are the irradiation flip angles. S0 is the signal acquired in the nonirradiated control case. Bavg power is the average irradiation power, which is proportional to the integral to the square of irradiation amplitude B1 over a repetition period and hence can be manipulated independent of the flip angle by varying the pulse duration and repetition time.
We have studied the rotation transfer of chemically exchanging sites in our previous works (17,18). We found that only spins with relatively slow exchange rates show a rotation effect when irradiated at their resonant frequency. In contrast, spins with fast exchange rates, extremely short T2, or spins subject to off-resonance irradiation show saturation effects. The rotation effect depends on the irradiation flip angle, while the saturation effect depends only on the average irradiation power. Therefore, when images are acquired with two different irradiation flip angles (such as π and 2π), but the same average irradiation power, spins that exhibit a rotation effect will have a different response to the irradiation flip angles, while spins that show a saturation effect will have the same response to the two irradiations. The subtraction of two signals acquired with two different irradiation flip angles, but the same average power, will isolate the rotation contribution, while removing the saturation effect. In particular, the effects of direct water saturation or the saturation of solid-like macromolecular protons that contribute to conventional MT measurements will be cancelled by the subtraction in Eq. [1]. The remaining rotation component is an important spin characteristic that can be used to isolate specific spins. Hence, the new CERT metric MTRdouble isolates the rotation contribution, avoids acquisitions at multiple frequencies, and avoids the confounding signals on the other side of water (18). Amides are a relatively slowly exchanging species (4) and are hence well suited to study by CERT. The NOE peak also shows effectively slow dynamic exchange effects, although the magnetization exchange may include several distinct processes of varying rates. Therefore, MTRdouble in CERT should be sensitive to both APT and NOE.
Phantom and Animal Preparation
A phantom containing 3% agarose gel (w/w) was prepared by adding low-gelling point agarose to deionized water. The solution was then heated to boiling point. A boiled egg white phantom was also prepared in a 10-mm tube.
Eight Sprague Dawley rats were used to generate tumor-bearing rats. 9L glioblastoma cells were obtained from American Type Culture Collection (ATCC 9L/lacZ, CRL-2200) and grown in Dulbecco’s modified Eagle’s medium (DMEM; Gibco, Gaithersburg, MD) with 10% fetal calf serum and 50 units/ml penicillin and 50 μg/ml streptomycin maintained in a humidified incubator at 37 °C with 5% CO2. Each rat was injected with 1 × 10⁵ 9L glioblastoma cells in their right brain hemispheres. These rats were subjected to MR imaging four weeks after implantation of tumor cells. The rats were immobilized and anesthetized with a 2%/98% isoflurane/oxygen mixture. Respiration was monitored to be stable, and a rectal temperature of 37°C was maintained constant throughout the experiments using a warm-air feedback system (SA Instruments, Stony Brook, NY). All procedures were approved by the Institutional Animal Care and Usage Committee at Vanderbilt University. The measurements were performed on a Varian DirectDrive™ horizontal 9.4T magnet with a 38-mm Litz radiofrequency (RF) coil (Doty Scientific Inc. Columbia, SC).
MR Scanning
To demonstrate the performance of CERT, agar and egg white phantom studies were performed with pulsed CEST sequences at irradiation flip angles of π and 2π and Bavg power of 0.8 or 1.6 μT. Images were acquired using a two-shot EPI sequence with matrix size 64 × 64, field of view 32 × 32 mm and number of acquisitions = 1. Z-spectra were acquired with RF offsets from −4000 Hz to 4000 Hz (−10 ppm to 10 ppm at 9.4T) with a step size of 100 Hz (0.25 ppm at 9.4T) for the agar phantom and with RF offsets from −4000 Hz to 4000 Hz (−10 ppm to 10 ppm at 9.4T) with a step size of 200 Hz (0.5 ppm at 9.4T) for boiled egg white phantom.
Studies of 9L tumors in rat brain in vivo were performed with CW-CEST at an irradiation power (Bcw) of 1μT and pulsed-CEST at irradiation flip angles of π and 2π and at Bavg power of 1.6μT. Images were acquired using a two-shot EPI sequence with matrix size 64 × 64, field of view 32 × 32 mm and number of acquisitions = 1. Z-spectra were acquired with RF offsets from −2000 Hz to 2000 Hz (−5 ppm to 5 ppm at 9.4T) with a step size of 100 Hz (0.25 ppm at 9.4T). To demonstrate the structure of the brain, high-resolution images were obtained using four-shot EPI with matrix size 128 × 128, field of view 32 × 32 mm and number of acquisitions = 10. Also, a T1 map was acquired with an inversion recovery spin-echo EPI with a 64 × 64 matrix. Specifically, T1 was measured by acquiring a series of single-shot EPI images preceded by a nonselective adiabatic spin inversion and different inversion delays (TI = 100, 200, 300, 500, 700, 1000, and 3000 ms). A delay of 10 s was inserted after each acquisition to allow for full spin relaxation. T1 was calculated pixelwise using a three-parameter least-squares fit. The total acquisition time for the T1 map was roughly 1.3 min.
The CW-CEST experiment used a rectangular irradiation pulse followed by a multi-shot spin echo (SE)-EPI readout. The pulsed-CEST experiment used a series of Gaussian RF irradiation pulses followed by a multi-shot SE-EPI readout. Crusher gradients (with alternating sign) were applied between each irradiation pulse to spoil residual transverse magnetization. In both cases, irradiation was applied 8.0 s in total to ensure the exchange was in steady state. For example, at a Bavg power of 1.6μT, 600 π pulses or 300 2π pulses were implemented before acquisition. The pulse repetition time and pulse duration were 13.5 ms and 6.8 ms, respectively, for π pulses, and 27.0 ms and 13.5 ms for 2π pulses. After the irradiation pulse train, a 2-s delay time was used for readout and signal recovery. A control scan was performed to acquire S0 by setting the RF offset to 100,000 HZ. The total acquisition time for each CW or pulsed low resolution CEST Z-spectrum (π or 2π irradiation) takes 27.3 min in phantom studies (81 offsets) and 13.7 min in animal studies (41 offsets). The total acquisition time for each high-resolution in vivo image (including reference (or 2π), label (or π), and control scan) takes 20 min.
CERT is relatively insensitive to B0 inhomogeneity compared with the APT by means of asymmetric analysis. In this study, we make a separate WASSR acquisition to correct the MTRasym for B0 inhomogeneities, but we make no correction to the CERT MTRdouble results. A water saturation shift referencing (WASSR) Z-spectrum (19) was acquired by using the CW-CEST sequence (with 1000 ms block saturation pulse) with RF offsets from −0.25 ppm to 0.25 ppm, with step size of 0.0125 ppm, and an RF field strength (Bcw) of 0.1μT. After irradiation pulses, 2-s delay time was used for readout and signal recovery. Images were acquired using a one-shot EPI sequence with matrix size 64 × 64, field of view 32 × 32 mm and number of acquisitions = 1. The total acquisition time was 2 min.
RESULTS
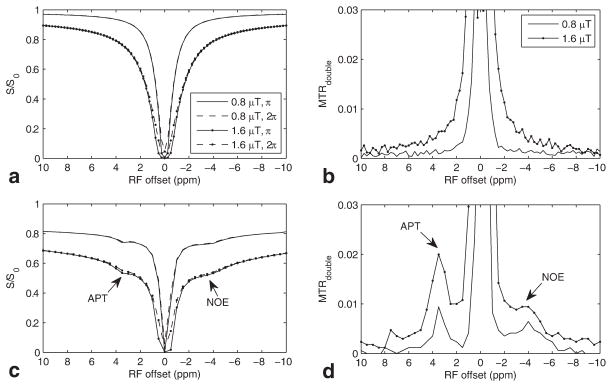
In our previous work, simulations showed that CERT can be used to remove the effects of macromolecular magnetization transfer (MT) and direct saturation because they do not depend on irradiation flip angle when the average power remains constant (18). Here we confirm these predictions in agar (which has water and solid-like macromolecular components) and egg white (which has water, macromolecular, and multiple small exchanging components). Figure 1a shows that the Z-spectra of agar using π or 2π pulses give near identical results (when offsets are ≥ 1 ppm). That is, MT and direct water effects contribute equally to the two Z-spectra. (The gap between the Z-spectra at two irradiation flip angles at small offsets is caused by the nonadiabatic condition of the irradiation pulse causing direct rotation of the water pool, which occurs at small offsets and/or large powers (18).) Figure 1b plots the corresponding MTRdouble spectrum and shows that the MTRdouble values at + 3.5 ppm (which are caused solely by nonadiabatic effects because there are no amide peaks in agar) are approximately 0.1 % and 0.5 % when Bavg power equals 0.8 and 1.6μT, respectively. These MTRdouble values are much less than typical APT effects in CERT experiments on tissues. Egg white contains a variety of proteins, and so it provides large APT and NOE effects. Figure 1c shows the APT dips at 3.5 ppm and a broad NOE range centered at −3.5 ppm, respectively. Figure 1d plots the corresponding MTRdouble spectra and shows two clear peaks for APT and NOE.
FIG. 1.
Experimental Z-spectra and MTRdouble on (a,b) agar and (c,d) boiled egg white phantoms. Note and Z-spectra for irradiation flip angle of π and 2π in (a) match especially at relatively lower power and far from water line. Also note the APT (3.5 ppm) and NOE (−3.5 ppm) peaks in (c) and (d).
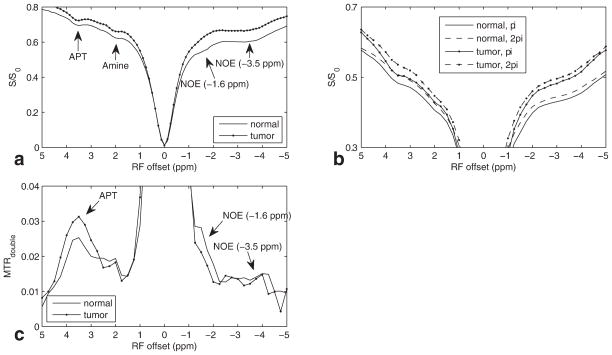
Figure 2a plots the CW-CEST Z-spectrum averaged over tumor or contralateral regions with a Bcw of 1μT from a rat brain bearing 9L tumor. Note the dips from APT (3.5 ppm), amine (2.0 ppm), NOE (−1.6 ppm), and NOE (−3.5 ppm). Figure 2b and 2c plot CERT Z-spectra and MTRdouble spectra from the same rat regions. Note that the APT, NOE(−3.5 ppm), and NOE(−1.6 ppm) peaks that are visible in the CEST z-spectra in Figure 2a are also visible in the CERT MTRdouble spectra in Figure 2c. (The MTRdouble NOE(−1.6 ppm) peak is distinct from the large direct water effects, as evidenced by the asymmetry at this offset.) Note also the large separation between the tumor and contralateral tissues in the APT and the NOE centered at −1.6 ppm, while the separation in the NOE at −3.5 ppm is much smaller. Results averaged over all rats are: APT of 0.025 ± 0.001 (normal) and 0.031 ± 0.0012 (tumor), NOE(−1.6ppm) of 0.028 ± 0.0009 (normal) and 0.021 ± 0.0008 (tumor), and NOE(−3.5 ppm) of 0.013 ± 0.0005 (normal) and 0.012 ± 0.0006 (tumor). The amine peak is weak as CERT filtering at this power removes fast exchanging sites (18).
FIG. 2.
Experimental CW-CEST Z-spectra at Bcw of (a) 1μT, (b) pulsed-CEST Z-spectra, and (c) MTRdouble on live rat brain with 9L tumor at Bavg power of 1.6μT. Note the APT peak at 3.5 ppm and two NOE peaks at −1.6 and −3.5 ppm.
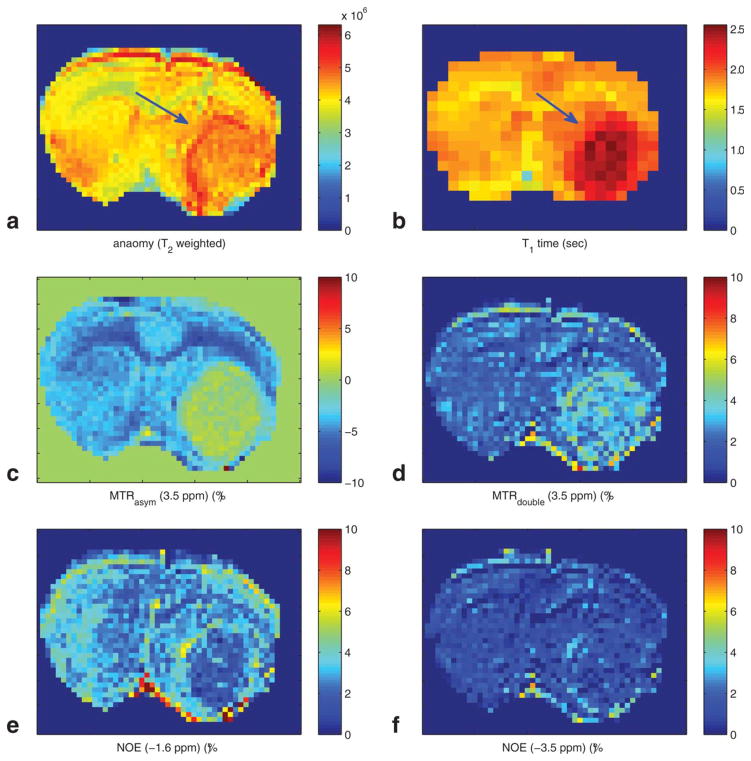
Figure 3 shows (a) anatomic image (T2 weighted), showing the 9L tumor (arrow) in a rat brain, (b) T1 map, (c) the conventional MTRasym image, (d) the APT CERT contrast (MTRdouble) at 3.5 ppm, (e) the low offset NOE (MTRdouble) at −1.6 ppm, showing relative lower signal in tumor core, and (f) the high offset NOE (MTRdouble) at −3.5 ppm, showing no contrast. (Our measurements of S0 had an SNR of roughly 350, which corresponds to a noise of 0.004 in the unitless MTRdouble metric.)
FIG. 3.
(a) Anatomy (T2 weighted), (b) T1 map, (c) MTRasym (3.5 ppm), (d) MTRdouble (3.5 ppm), (e) NOE (−1.6 ppm), and (f) NOE (−3.5 ppm) images on a rat brain with 9L tumor.
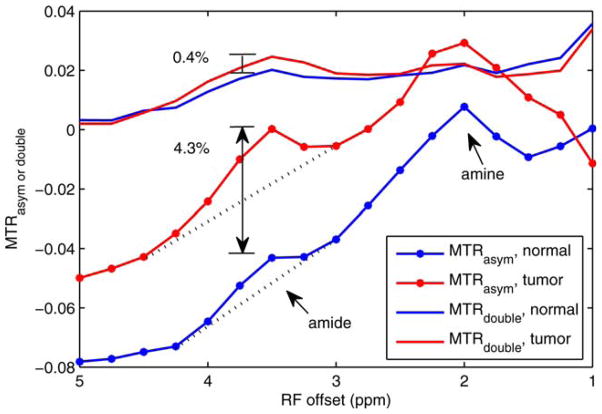
Figure 4 plots MTRdouble and MTRasym spectra of a tumor bearing rat brain acquired at 9.4T. Contrast between tumor and normal tissue at the amide resonance is 4.3% for MTRasym and 0.4% for MTRdouble. However, the large MTRasym contrast mostly comes from the sloping baseline, which is due to broad NOE and macromolecular MT asymmetry effects. (In addition, while the nearby amine peak does not overlap with the amide peak in Figure 4, at higher irradiation powers (20,21) or lower field strengths, amine contamination of the MTRa-sym amide peak is also problematic.) In contrast, MTRdouble minimizes confounding signals from NOE or solid MT asymmetry, and hence has a relatively low and flat baseline. In addition to increasing amide-exchange specificity, this improved baseline allows meaningful MTRdouble studies at a single frequency offset, without the additional acquisitions and model fitting required to isolate amide contributions in the MTRasym signal.
FIG. 4.
MTRdouble and MTRasym on a rat brain bearing 9L tumor. Note the amide peak overrides on a broad NOE or MT asymmetry peak, indicating the MTRasym contrast between tumor and normal tissue is mostly come from the NOE or MT asymmetry. [Color figure can be viewed in the online issue, which is available at wileyonlinelibrary.com.]
DISCUSSION
Zhou et al have shown that the APT signal likely originates predominantly from endogenous mobile proteins, such as those in the cytoplasm, through phantom experiments on egg white and egg yolk (22). However, the APT quantified with asymmetric analysis in vivo is contaminated by many other MT effects. Jin et al have recently found that the APT by means of asymmetric analysis is mostly from NOE or macromolecular MT asymmetry effects at lower power, and amine contributions at higher power (16,20). Therefore, the specificity of the APT by means of asymmetric analysis in proteins can be unclear. Although in vivo APT by means of asymmetric analysis has been used as a biomarker for assessing malignancy versus radiation necrosis, grade of tumor, and predicting tumor response to therapy (6), the actual biological basis for the contrast is still not clear and should not be attributed solely to mobile proteins. For example, the strong CEST contrast from the tumor in Figure 3c using conventional MTRasym likely comes from the macromolecular (MT) asymmetric component, as can been seen in the equally strong WM/GM contrast. CERT is not directly sensitive to this MT asymmetry and the resulting MTRdouble image in Figure 3d shows contrast which (while smaller) is more specific to amide exchange. (MTRdouble does have a 2nd order sensitivity to MT. Solid pool saturation and transfer may change the overall signal intensity and, hence, may affect the resulting MTRdouble value even though the direct effects of MT cancel upon the subtraction in Eq. [1]. T1 recovery may have similar effects. Conventional MTRasym is also sensitive to these subtle 2nd order effects, in addition to its direct 1st order sensitivity to MT asymmetry.).
Determining the molecular basis of the NOE peaks in CEST and CERT experiments is an area of active research and multiple exchange mechanisms may play a role. For the purposes of this study, the essential result is that NOE effects couple distinct proton pools at relatively slow exchange rates and are hence amendable to CERT imaging.
CONCLUSIONS
We obtained measurements of NOE and APT using CERT in a tumor model in vivo. The APT effects in tumors in vivo as measured in conventional CEST may be dominated by MT asymmetry rather than chemical exchange. CERT appears to produce data that are more specific for APT.
Acknowledgments
Grant sponsor: NIH; Grant numbers: NIH EB000214, K25CA168936.
References
- 1.van Zijl PCM, Zhou J, Mori N, Payen JF, Wilson D, Mori S. Mechanism of magnetization transfer during on-resonance water saturation. A new approach to detect mobile proteins, peptides, and lipids. Magn Reson Med. 2003;49:440–449. doi: 10.1002/mrm.10398. [DOI] [PubMed] [Google Scholar]
- 2.Swanson SD. Protein mediated magnetic coupling between lactate and water protons. J Magn Reson. 1998;135:248–255. doi: 10.1006/jmre.1998.1535. [DOI] [PubMed] [Google Scholar]
- 3.Estilaei MR, Matson GB, Meyerhoff DJ. Indirect imaging of ethanol via magnetization transfer at high and low magnetic fields. Magn Reson Med. 2003;49:755–759. doi: 10.1002/mrm.10413. [DOI] [PubMed] [Google Scholar]
- 4.Zhou JY, Payen JF, Wilson DA, Traystman RJ, van Zijl PCM. Using the amide proton signals of intracellular proteins and peptides to detect pH effects in MRI. Nat Med. 2003;9:1085–1090. doi: 10.1038/nm907. [DOI] [PubMed] [Google Scholar]
- 5.Jokivarsi KT, Grohn HI, Grohn OH, Kauppinen RA. Proton transfer ratio, lactate, and intracellular pH in acute cerebral ischemia. Magn Reson Med. 2007;57:647–653. doi: 10.1002/mrm.21181. [DOI] [PubMed] [Google Scholar]
- 6.Zhou JY, Tryggestad E, Wen ZB, et al. Differentiation between glioma and radiation necrosis using molecular magnetic resonance imaging of endogenous proteins and peptides. Nat Med. 2011;17:130–134. doi: 10.1038/nm.2268. [DOI] [PMC free article] [PubMed] [Google Scholar]
- 7.Jones CK, Schlosser MJ, van Zijl PCM, Pomper MG, Golay X, Zhou JY. Amide proton transfer imaging of human brain tumors at 3T. Magn Reson Med. 2006;56:585–592. doi: 10.1002/mrm.20989. [DOI] [PubMed] [Google Scholar]
- 8.Sun PZ, Zhou JY, Huang J, van Zijl P. Simplified quantitative description of amide proton transfer (APT) imaging during acute ischemia. Magn Reson Med. 2007;57:405–410. doi: 10.1002/mrm.21151. [DOI] [PubMed] [Google Scholar]
- 9.Zhou JY, Lal B, Wilson DA, Laterra J, van Zijl PCM. Amide proton transfer (APT) contrast for imaging of brain tumors. Magn Reson Med. 2003;50:1120–1126. doi: 10.1002/mrm.10651. [DOI] [PubMed] [Google Scholar]
- 10.Sun PZ, Benner T, Kumar A, Sorensen AG. Investigation of optimizing and translating pH-sensitive pulsed-chemical exchange saturation transfer (CEST) imaging to a 3T clinical scanner. Magn Reson Med. 2008;60:834–841. doi: 10.1002/mrm.21714. [DOI] [PMC free article] [PubMed] [Google Scholar]
- 11.Sun PZ, Wang EF, Cheung JS. Imaging acute ischemic tissue acidosis with pH-sensitive endogenous amide proton transfer (APT) MRI-Correction of tissue relaxation and concomitant RF irradiation effects toward mapping quantitative cerebral tissue pH. Neuroimage. 2012;60:1–6. doi: 10.1016/j.neuroimage.2011.11.091. [DOI] [PMC free article] [PubMed] [Google Scholar]
- 12.Sun PZ, Murata Y, Lu J, Wang X, Lo EH, Sorensen AG. Relaxation-compensated fast multislice amide proton transfer (APT) imaging of acute ischemic stroke. Magn Reson Med. 2008;59:1175–1182. doi: 10.1002/mrm.21591. [DOI] [PubMed] [Google Scholar]
- 13.van Zijl PCM, Yadav NN. Chemical Exchange Saturation Transfer (CEST): what is in a name and what isn’t? Magn Reson Med. 2011;65:927–948. doi: 10.1002/mrm.22761. [DOI] [PMC free article] [PubMed] [Google Scholar]
- 14.Ling W, Regatte RR, Navon G, Jerschow A. Assessment of glycosaminoglycan concentration in vivo by chemical exchange-dependent saturation transfer (gagCEST) Proc Natl Acad Sci U S A. 2008;105:2266–2270. doi: 10.1073/pnas.0707666105. [DOI] [PMC free article] [PubMed] [Google Scholar]
- 15.Jones CK, Polders D, Hua J, Zhu H, Hoogduin HJ, Zhou JY, Luijten P, van Zijl PCM. In vivo three-dimensional whole-brain pulsed steady-state chemical exchange saturation transfer at 7 T. Magn Reson Med. 2012;67:1579–1589. doi: 10.1002/mrm.23141. [DOI] [PMC free article] [PubMed] [Google Scholar]
- 16.Jin T, Wang P, Zong XP, Kim SG. MR imaging of the amide-proton transfer effect and the pH-insensitive nuclear overhauser effect at 9. 4 T. Magn Reson Med. 2013;69:760–770. doi: 10.1002/mrm.24315. [DOI] [PMC free article] [PubMed] [Google Scholar]
- 17.Zu ZL, Janve VA, Li K, Does MD, Gore JC, Gochberg DF. Multi-angle ratiometric approach to measure chemical exchange in amide proton transfer imaging. Magn Reson Med. 2012;68:711–719. doi: 10.1002/mrm.23276. [DOI] [PMC free article] [PubMed] [Google Scholar]
- 18.Zu ZL, Janve VA, Xu JZ, Does MD, Gore JC, Gochberg DF. A new method for detecting exchanging amide protons using chemical exchange rotation transfer. Magn Reson Med. 2013;69:637–647. doi: 10.1002/mrm.24284. [DOI] [PMC free article] [PubMed] [Google Scholar]
- 19.Kim M, Gillen J, Landman BA, Zhou JY, van Zijl PCM. Water Saturation Shift Referencing (WASSR) for Chemical Exchange Saturation Transfer (CEST) experiments. Magn Reson Med. 2009;61:1441–1450. doi: 10.1002/mrm.21873. [DOI] [PMC free article] [PubMed] [Google Scholar]
- 20.Jin T, Wang P, Zong XP, Kim SG. Magnetic resonance imaging of the Amine-Proton EXchange (APEX) dependent contrast. Neuroimage. 2012;59:1218–1227. doi: 10.1016/j.neuroimage.2011.08.014. [DOI] [PMC free article] [PubMed] [Google Scholar]
- 21.Zong XP, Wang P, Kim SG, jin T. Sensitivity and source of amin-proton exchange and amide-proton transfer magnetic imaging in cerebral ischemia. Magn Reson Med. 2014;71:118–132. doi: 10.1002/mrm.24639. [DOI] [PMC free article] [PubMed] [Google Scholar]
- 22.Zhou JY, Yan K, Zhu H. A simple model for understanding the origin of the amide proton transfer MRI signal in tissue. Appl Magn Reson. 2012;42:393–402. doi: 10.1007/s00723-011-0306-5. [DOI] [PMC free article] [PubMed] [Google Scholar]


