Abstract
A vascular term was incorporated into a reference region (RR) model analysis of DCE-MRI data, and its effect on the accuracy of the model in estimating tissue kinetic parameters in a tissue of interest (TOI) was systematically investigated through computer simulations. Errors in the TOI volume transfer constant (Ktrans,TOI) and TOI extravascular extracellular volume (ve,TOI) that result when the fractional plasma volume (vp) was included in (1) neither region, (2) TOI only (3) both regions were investigated. For nominal values of tumor kinetic parameters (ve,TOI = 0.40 and Ktrans,TOI = 0.25 min–1), if the vascular term was included in neither region or the TOI only, Ktrans,TOI error was within 20% for 0.03 < vp,TOI < 0.10, and ve,TOI error was within 20% for the range of vp,TOI studied (0.01–0.10). The effects of temporal resolution were shown to be complex, and in some cases errors increased with increasing temporal resolution.
Introduction
Dynamic contrast-enhanced MRI (DCE-MRI) can be used to characterize tumor physiology by tracking the movement of contrast media throughout the vasculature and tissue. It has been observed that tumor tissue displays different enhancement characteristics than normal tissue, and, in particular, it is believed that the rapid wash-in of contrast is due to the increased ‘leakiness’ of angiogenic tumor vasculature due to the larger gaps between endothelial cells (Fournier et al 2007, Kiessling et al 2007, Nakamura et al 2006, Provenzale et al 2006). Investigators have demonstrated that quantification of kinetic parameters in a DCE-MRI exam can be used to discriminate malignant and benign lesions (Chen et al 2006, Goto et al 2007, Kono et al 2007, Yankeelov and Gore 2007) and detect early treatment response in tumors (Lankester et al 2007, Wilmes et al 2007, Zahra et al 2007).
In a DCE-MRI exam, images are serially acquired during the intravenous administration of a bolus of a paramagnetic contrast agent. From the images the contrast agent concentration time course is calculated, and a pharmacokinetic model is used to extract parameters which characterize the concentration uptake curve. A commonly used model is the two-compartment pharmacokinetic model reviewed by Tofts et al (1999). The inputs to this model are the contrast agent concentrations in the vasculature (the so-called arterial or vascular input function) and tissue, and the fit parameters are the volume transfer constant (Ktrans), the fractional extravascular extracellular (interstitial) volume (ve), and the fractional plasma volume (vp). The interstitial volume may increase in the case of either edema or cellular necrosis. The plasma volume is affected by changes in angiogenic activity and local hematocrit (Jain 1988). The physiological meaning of Ktrans is complex, in that it relates to both the bulk flow and the permeability surface-area product of the tissue vasculature (Tofts et al 1999). It is generally believed that it correlates with the degree of tumor angiogenesis (Cha et al 2003, Montemurro et al 2007, Su et al 2003).
One of the primary challenges of DCE-MRI analysis is the accurate measurement of the plasma contrast agent concentration, often termed the arterial input function (AIF), which is used to drive the kinetic model. First, it is often difficult to achieve the temporal resolution (e.g. high sampling frequency) needed to accurately measure the AIF. For example, Henderson et al concluded that images must be acquired at least every second in order to accurately characterize plasma volume in the context of breast disease (Henderson et al 1998). Second, it is desirable to measure the AIF in close proximity to the tumor, and an appropriate vessel may not be in the field of view or it may be very small and difficult to image. Finally, vessel motion, flow and partial volume effects further confound accurate measurements of the AIF.
Models have recently been developed that enable the analysis of DCE-MRI data without having to characterize the time course of the contrast agent concentration in the plasma (Kovar et al 1998, Yang et al 2004, Yankeelov et al 2005). These ‘reference region’ methods do not yet account for the plasma volume contribution, though several investigators have pointed out its significance in tumor studies (Harrer et al 2004, Henderson et al 2000). The plasma volume in normal tissue is small and is therefore often ignored in DCE-MRI analysis. By comparison, the plasma volume in tumors and other pathological tissue may be quite large, possibly requiring explicit consideration. The primary goal of this work is to determine the effect of the vascular term on DCE-MRI analysis using the reference region model. In this work we explicitly incorporate a vascular term into the formalism and analyze, through simulations, its effect on the extracted pharmacokinetic parameters. By considering the inclusion of a vascular term in both the reference region (RR) and the tissue of interest (TOI) as the gold standard, we systematically investigated accuracy and precision in the extracted pharmacokinetic parameters that result when a vascular term was included in (1) neither region, (2) the TOI only and (3) in both regions in the presence of realistic experimental noise levels. The effect of temporal resolution was also investigated, by varying the sampling period from 1 to 30 s in the simulations. We conclude by making suggestions on when vascular terms should be incorporated if a priori knowledge concerning the range of tumor vascular volumes is known.
Theory
In the standard two-compartment model (Kety 1951, Larsson et al 1990, Tofts 1997, Tofts and Kermode 1991) the differential equation which describes the transport of contrast across the capillaries is given by
| (1) |
where Ce and Cp are the contrast agent concentrations in the extravascular extracellular space and plasma space, respectively. The total tissue concentration, Ct(t), is given by
| (2) |
If the vascular contribution is neglected, then Cp(t) may be calculated from Ct(t) as
| (3) |
If the vascular term is included, then (see the appendix)
| (4) |
Using either equation (3) or equation (4), Cp(t) may be calculated from a reference region of normal tissue (provided a reasonable estimate of Ktrans and ve of the reference tissue can be obtained) and used to drive the model in a tissue of interest to fit the kinetic parameters using equation (5):
| (5) |
To improve computational efficiency, a linear form of equation (5) has been formulated by Murase (2004),
| (6) |
In the tissue of interest, the vascular term may either be included or neglected by setting vp to zero in equation (5) or equation (6). The plasma concentration is first calculated by either equations (3) or (4), and then substituted into equation (6) to calculate the concentration in the TOI.
Materials and methods
Simulations were run to determine the effects of including or excluding the vascular term on the accuracy and precision of the reference region model. The plasma concentration time course was defined by the functional form given by Parker et al (2006), which was derived from experimental data in patients acquired at a relatively high temporal resolution (4.97 s). In our work, we also assumed a nominal hematocrit of 0.42 (Kratz and Lewandrowski 1998). The initial time course value was subtracted off in order to set the initial point to zero, and a time step of 1 s was used.
Time courses for Ct,RR(t) and Ct,TOI(t) were synthesized using equation (5) with the following parameters: Ktrans,RR = 0.08 min–1, ve,RR = 0.1, vp,RR = 0.02, Ktrans,TOI = 0.1–0.5 min–1, ve,TOI = 0.1–0.5 and vp,TOI = 0.01–0.10. Varying amounts of noise were added to Ct,RR(t) and Ct,TOI(t), and Cp(t) was calculated using either equation (3) (excluding vp,RR) or equation (4) (including vp,RR). The noise standard deviation was calculated as the maximum of Ct,RR(t) divided by the desired signal-to-noise ratio (SNR). The kinetic parameters in the tissue of interest were calculated from the least-squares solution to equation (6), including and excluding the vascular term.
The tissue curves were analyzed in the following ways:
-
(1)
nvp,RR – nvp,TOI: vascular term excluded from both regions (equations (3) and (6), with vp = 0).
-
(2)
nvp,RR – vp,TOI: vascular term excluded from reference region and included in tissue of interest (equations (3) and (6)).
-
(3)
vp,RR – vp,TOI: vascular term included in both regions (equations (4) and (6)).
A series of 1000 Monte Carlo runs was performed and the per cent error was tabulated for each parameter.
In theory, the slower dynamics of the RR and TOI tissue time courses should allow a slower sampling rate to adequately characterize these curves, compared with the rate necessary to properly sample the plasma curve, thereby providing the opportunity to increase spatial resolution and/or signal-to-noise during data acquisition. To test this hypothesis, the tissue curves were sub-sampled at periods of 10, 20 and 30 s and the errors in all three parameters were calculated. For these simulations no noise was added to the curves, as we are interested in systematic errors.
Results
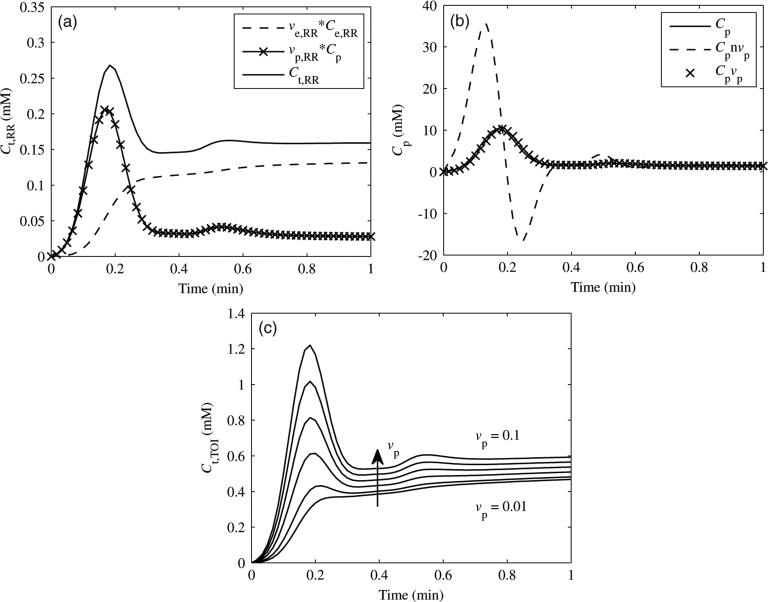
The simulated reference region tissue curve (Ct,RR) with the individual contributions of the plasma concentration (Cp) and extravascular extracellular concentration (Ce,RR) (see equation (2)) is shown in figure 1(a). Both Cp and Ce,RR are weighted by their respective fractional volumes (vp,RR and ve,RR). The plasma concentration contributes the initial peak in the tissue curve, while the extravascular extracellular concentration contributes the more gradual wash-in, plateau and wash-out phases. The calculated Cp curves are shown in figure 1(b). The actual value of Cp (solid line), Cp excluding vp,RR (equation (3)) (dashed line) and Cp including vpRR (equation (4)) (crosses) are shown. When the vascular term was excluded, large over- and undershoots resulted. If the vascular term was included, then the fit matched well with the actual value. The effects of increasing values of vp,TOI on Ct,TOI are shown in figure 1(c). As vp,TOI increased, the initial slope, peak and plateau all increased in Ct,TOI.
Figure 1.
(a) Contributions of Cp and Ce,RR (each weighted by their respective fractional volumes) to Ct,RR, the reference region tissue concentration. (b) Resulting Cp curves from Ct,RR, excluding (Cpnvp) or including (Cpvp) the vascular term (see equations (3) and (4)). Note the large over- and undershoots when the vascular term was excluded. (c) Effect of vp,TOI on Ct,TOI. Curves are shown for values of vp,TOI increasing from 0.01 to 0.10.
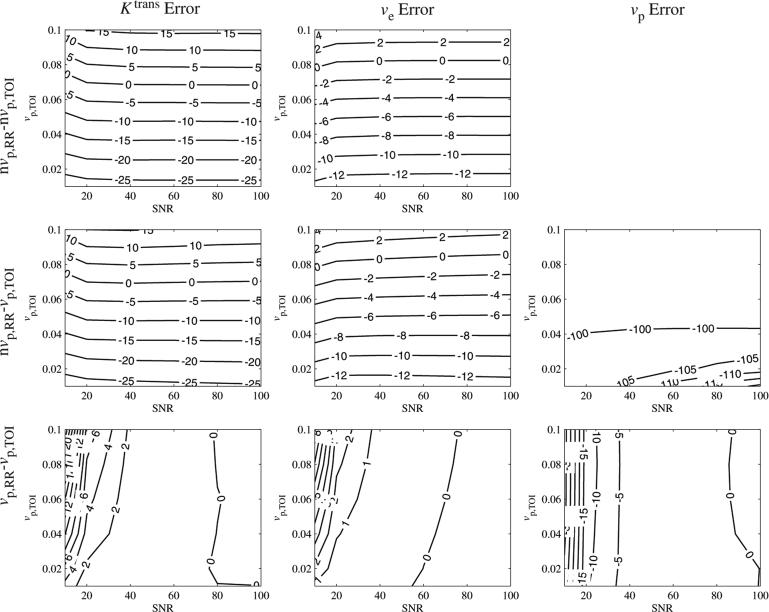
We first explore the noise sensitivity for particular Ktrans,TOI and ve,TOI values and a range of vp,TOI. The SNR sensitivity of the parameters is shown in figure 2 (Ktrans,TOI = 0.25 min–1, ve,TOI = 0.40). If the vascular term was excluded from either the RR or TOI, then the errors in Ktrans,TOI and ve,TOI were stable for SNR > 40. For SNR = 60 and a nominal value of vp,TOI = 0.06, the Ktrans,TOI errors were: nvp,RR – nvp,TOI = –4% and nvp,RR – vp,TOI = –5%. If the vascular term was included in both regions (vp,RR – vp,TOI), then the error in Ktrans,TOI decreased monotonically with increasing SNR, from 14% (SNR = 10) to < 1% for SNR > 40.
Figure 2.
Effect of SNR and vp,TOI on kinetic parameter errors, shown in per cent error. Errors were stable for SNR > 40, except for vp,TOI < 0.04 in the nvp,RR – vp,TOI case.
The ve,TOI error exhibited similar trends as the Ktrans,TOI error, in that the values were stable for SNR > 40 if the vascular term was excluded from either the RR or TOI. For SNR = 60 and vp,TOI = 0.06, the ve,TOI errors were: nvp,RR – nvp,TOI = –4% and nvp,RR – vp,TOI = –4%. With the vascular term included in both regions, the ve,TOI error decreased from 5% to < 1% for SNR > 40.
The vp,TOI error showed a modest dependence on SNR for the nvp,RR – vp,TOI case for values of vp,TOI > 0.04 and was approximately –100% for values of vp,TOI < 0.04. In the vp,RR – vp,TOI case, the error in vp,TOI decreased exponentially with SNR, from approximately 35% (SNR = 10) to < 3% for SNR > 40.
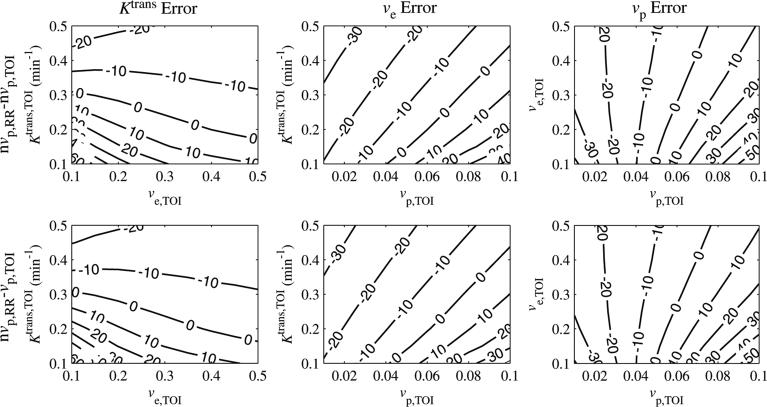
We next present data on the dependence of parameter errors on the parameter values. Because the errors were relatively flat for SNR > 40, the SNR was fixed to 60 for the results described below, which examine the interdependence between the three parameters. Figure 3 shows contour plots for the error in Ktrans,TOI as a function of each parameter, for SNR = 60. For each column, one parameter was fixed, while the other two were varied. The fixed parameter values were Ktrans,TOI = 0.25 min–1, ve,TOI = 0.40 and vp,TOI = 0.06 (Eliat 2004). Each row shows a different combination of including or excluding the vascular terms from the reference region and tissue of interest.
Figure 3.
Ktrans,TOI per cent error as a function of Ktrans,TOI, ve,TOI and vp,TOI. The errors intersected zero, indicating that the correct values awere estimated under certain conditions. The Ktrans,TOI error decreased with Ktrans,TOI and was relatively insensitive to ve,TOI, although for low values of Ktrans,TOI it decreased with ve,TOI. The error was linearly proportional to vp,TOI.
When the vascular term was excluded from the reference region and included in the tissue of interest (nvp,RR – vp,TOI), the vascular term was set to approximately zero by the least-squares fit (the maximum confidence interval for vp,TOI was [0.003, 0.005] in this case), resulting in a fit similar to the case where the vascular term was excluded from both regions (nvp,RR – nvp,TOI). This is likely due to the large peaks in the calculated AIF, as shown in figure 1(b).
If the vascular term was excluded from the reference region, the error in Ktrans,TOI crossed zero for certain parameter values. The error decreased with Ktrans,TOI and grew linearly with vp,TOI. The slope of the error versus vp,TOI decreased with Ktrans,TOI. The error was less sensitive to ve,TOI, except for low values of Ktrans,TOI (< 0.25 min–1), where the error decreased with ve,TOI. For the nominal values Ktrans,TOI = 0.25 min–1 and ve,TOI = 0.40, when the vascular term was excluded from the reference region then the errors in Ktrans,TOI were within 10% for 0.05<vp,TOI<0.09 and within 20% for 0.03<vp,TOI<0.10.
Figure 4 shows contour plots for the error in ve,TOI as a function of each parameter for SNR = 60. The error in ve,TOI was insensitive to Ktrans,TOI. It decreased nonlinearly with ve,TOI and increased linearly by approximately 4% per 0.02 increase with vp,TOI. As with the Ktrans,TOI error, the ve,TOI error crossed zero for certain parameter values when the vascular term was excluded from the reference region. For the nominal values Ktrans,TOI = 0.25 min–1 and ve,TOI = 0.40, when the vascular term was excluded from the reference region, then the ve,TOI errors were within 10% for 0.03 < vp,TOI < 0.10 and were within 20% for 0.01 < vp,TOI < 0.10.
Figure 4.
ve,TOI per cent error as a function of Ktrans,TOI, ve,TOI and vp,TOI. The error intersected zero, indicating that the correct values were estimated under certain conditions. The ve,TOI error was relatively insensitive to Ktrans,TOI decreased nonlinearly with ve,TOI and increased linearly with vp,TOI.
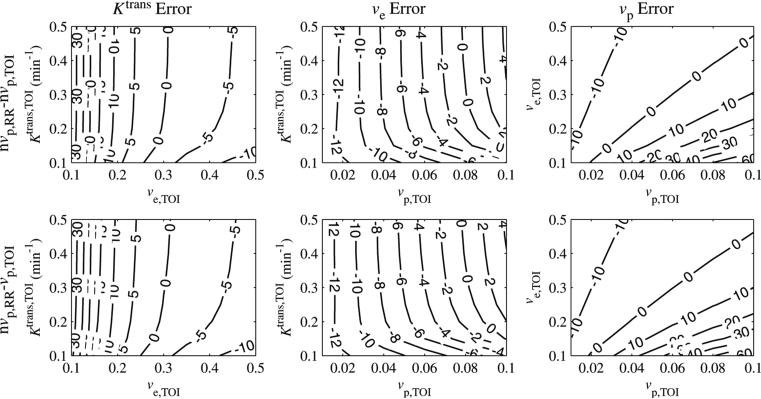
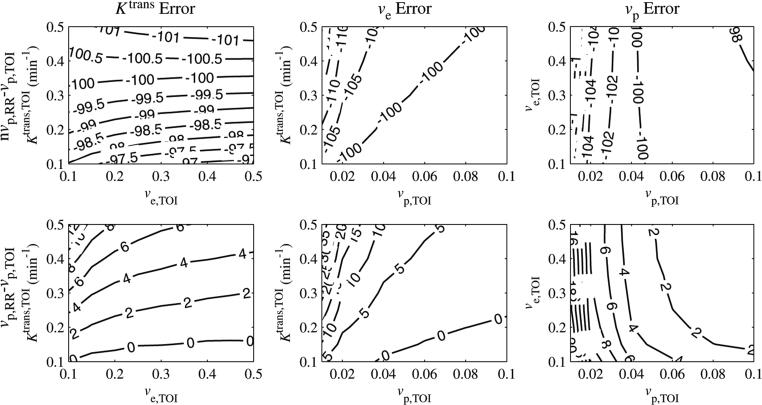
Contour plots of the errors in vp,TOI for when the vascular term was excluded from the reference region are shown in figure 5. The errors in vp,TOI were close to –100% for all parameter values, meaning that the model set it to close to zero. This implies that the tissue of interest vascular term cannot be accurately estimated from the reference region model if the reference region vascular term is not included.
Figure 5.
vp,TOI error as a function of Ktrans,TOI, ve,TOI and vp,TOI. For the nvp,RR – vp,TOI case, the error was close to –100%, reflecting the fact that the model set vp,TOI to close to zero even if it was included in the model. In the vp,RR – vp,TOI case, the error increased linearly with Ktrans,TOI, was insensitive to ve,TOI and decreased nonlinearly with vp,TOI.
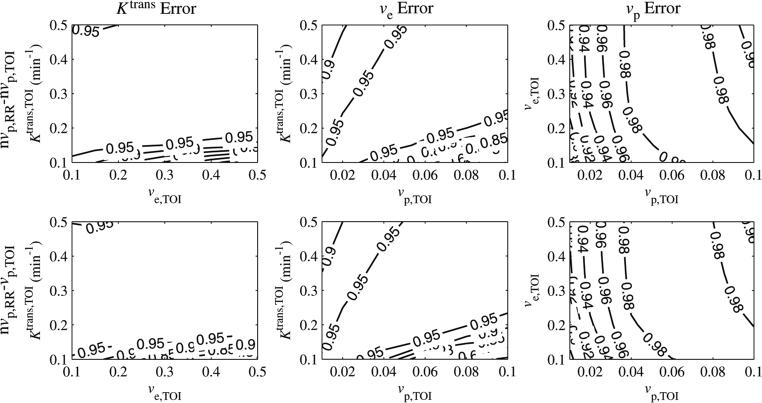
To evaluate how well the tissue of interest curve fit equation (6), the correlation coefficient, r2, was calculated and is plotted in figure 6. When the vascular term was excluded from the reference region, r2 ≥ 0.95 for most parameter values, indicating a good fit to the model. For the nominal values of Ktrans,TOI = 0.25 min–1 and ve,TOI = 0.40, r2 > 0.95 for vp,TOI > 0.02.
Figure 6.
r2 goodness-of-fit statistic as a function of Ktrans,TOI, ve,TOI and vp,TOI. For most values, r2 > 0.9, except for regions of high Ktrans,TOI, low vp,TOI and low Ktrans,TOI, high vp,TOI.
Effects of temporal resolution
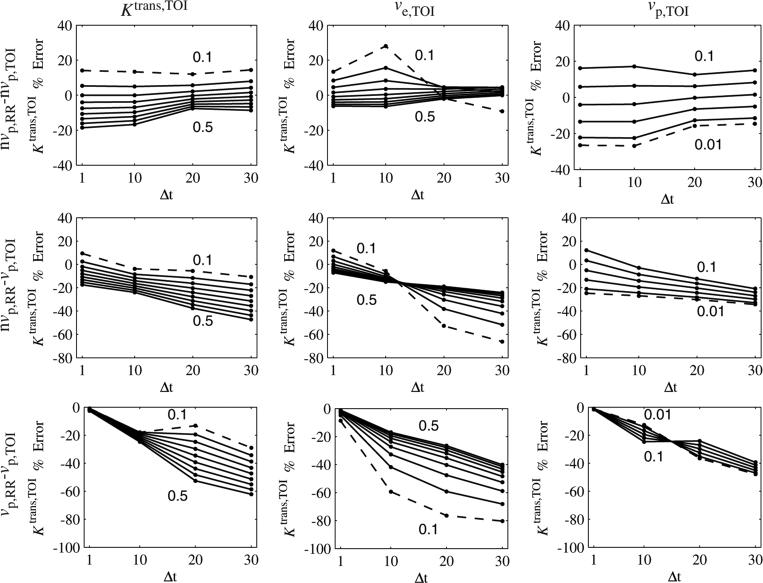
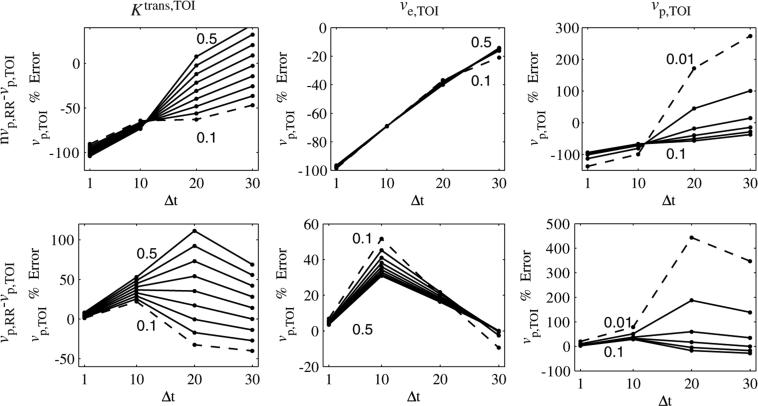
The effects of temporal resolution on Ktrans,TOI error are shown in figure 7. The sampling interval, Δt, was set to 1, 10, 20 and 30 s. This rate was used to sample the (noiseless) tissue curves in the reference region and tissue of interest, and the parameters were calculated as before, excluding or including the vascular term in each region. In each graph, one parameter was varied, while the other two were fixed at the following values: Ktrans,TOI = 0.25 min–1, ve,TOI = 0.40 and vp,TOI = 0.06. The minimum and maximum parameter values are shown on each graph, with the curve corresponding to the minimum value shown as a dashed line.
Figure 7.
Ktrans,TOI error as a function of sampling interval (Δt) and Ktrans,TOI, ve,TOI and vp,TOI. For each column, one parameter was varied, with the minimum and maximum parameter values shown in the graph (minimum shown as a dashed line). For the nvp,RR – nvp,TOI case, the dependence on the parameter values reached a minimum at Δt = 20 s. For the nvp,RR – vp,TOI case, the errors became more negative (sometimes crossing zero) as Δt increased. For the vp,RR – vp,TOI case, the errors decreased from zero as Δt increased. The sign of the dependence on vp,TOI reversed when going from Δt = 10 s to Δt = 20 s.
When the vascular term was excluded from both regions (nvp,RR – nvp,TOI, first row), the Ktrans,TOI error was bounded by ±30% for the range of parameter values studied. The errors clustered at Δt = 20 s, where they exhibited little dependence on the parameter values. The Ktrans,TOI error became more negative with increasing Δt if the vascular term was included in only the tissue of interest (nvp,RR – vp,TOI). Compared with the nvp,RR – nvp,TOI case, the errors varied over a wider range, and in several cases the error went from positive to negative as Δt increased, implying that the error was equal to zero for a particular sampling frequency. When the vascular term was included in both regions (vpRR – vp,TOI, third row), the errors began near zero and became more negative as Δt increased, as expected. The dependence on Δt was not linear and was different for each parameter. The dependence on Ktrans,TOI and ve,TOI was largest for Δt = 20 s. The sign of the dependence on vp,TOI reversed in going from Δt = 10 s to Δt = 20 s, seen as a ‘twist’ in the graph.
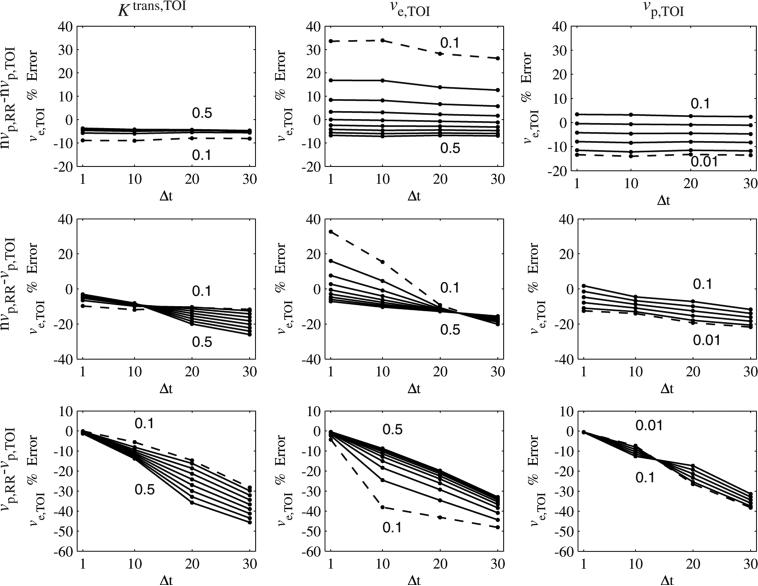
Figure 8 shows the error in ve,TOI as a function of the sampling period and each of the parameters. For the nvpRR – nvp,TOI case, the ve,TOI error had little dependence Δt. If the vascular term was included in only the tissue of interest (nvpRR – vp,TOI), then the errors became more negative with Δt, but in some cases crossed zeros, as with the Ktrans,TOI error. When the vascular term was included in both regions the error began near zero then became more negative with Δt. Similar to the Ktrans,TOI error, the dependence on vp,TOI changes sign as Δt goes from 10 s to 20 s.
Figure 8.
Error in ve,TOI as a function of sampling rate (Δt) and Ktrans,TOI, ve,TOI and vp,TOI. For each column, one parameter was varied, with the minimum and maximum parameter values shown in the graph (minimum shown as a dashed line). For the nvp,RR – nvp,TOI case, the errors were fairly insensitive to Δt. For the nvp,RR – vp,TOI case, the errors became more negative (sometimes crossing zero) as Δt increased. For the vp,RR – vp,TOI case, the errors decreased from zero as Δt increased. The sign of the dependence on vp,TOI reversed when going from Δt = 10 s to Δt = 20 s.
The influence of temporal resolution on vp,TOI error is shown in figure 9. For the nvp,RR – vp,TOI case, the error became more positive with Δt, in some cases going from negative to positive. This dependence increased with Ktrans,TOI, did not seem to depend on ve,TOI and decreased with vp,TOI. For the vp,RR – vp,TOI case, the vp,TOI error began near zero, increased for Δt = 10 s, then at Δt = 20 s increased for larger values of Ktrans,TOI and decreased for smaller values of Ktrans,TOI. The vp,TOI error had less dependence on ve,TOI, and peaked at Δt = 10 s, then decreased. For vp,TOI > 0.02, the error had little dependence on Δt, but increased rapidly when Δt changes from 10 s to 20 s, for vp,TOI ≤ 0.02.
Figure 9.
Error in vp,TOI as a function of sampling rate (Δt) and Ktrans,TOI, ve,TOI and vp,TOI. For each column, one parameter was varied, with the minimum and maximum parameter values shown in the graph (minimum shown as a dashed line). For the nvpRR – vp,TOI case the dependence on Ktrans,TOI increased with Δt, was insensitive to ve,TOI and decreased with vp,TOI. For the vpRR – vp,TOI case, the dependence on Ktrans,TOI and vp,TOI increased the most in going from Δt = 10 s to Δt = 20 s. The dependency on ve,TOI peaked at Δt = 10 s.
Discussion
In normal muscle tissue, the plasma contribution is approximately 1–2% (Faranesh et al 2006, Kuwatsuru et al 1993), and is often neglected in quantitative DCE-MRI. The fractional vascular volume may be significantly larger in tumors, and consequently may need to be considered in the kinetic model. For example, Harrer et al demonstrated in a study of patients with high grade gliomas (a highly vascularized tumor) that when the vascular term was not included in the kinetic model Ktrans was overestimated by up to two orders of magnitude (Harrer et al 2004). In this work, the importance of the plasma term in calculating kinetic parameters from the reference region model was systematically analyzed.
If the vascular term was excluded from the reference region, then the errors in Ktrans,TOI crossed zero for particular combinations of the three parameters. In tumors or other environments that tend to be quite heterogeneous, this means that both the sign and magnitude of the error may be quite unpredictable; for example, for the values studied here, the error was in the range of [–42%, 71%].
Values for tumor Ktrans,TOI, ve,TOI and vp,TOI vary widely in the literature (Henderson et al 2000), due to differences in tumor physiology, image acquisition protocols and analysis methods. It is still useful, however, to pick ‘typical’ values for these parameters to further examine the implications of the vascular term on DCE-MRI analysis. The fractional plasma volume (vp,TOI) in tumors has been evaluated with macromolecular contrast agents such as albumin-GDTPA (Ogan et al 1987) or Gadomer-17 (Misselwitz et al 2001), which are currently only approved for use in pre-clinical studies. Using such agents, vp,TOI has been measured to be in the range of 0.045–0.0725 (Fournier et al 2007, Turetschek et al 2004) in human breast cancer xenograft studies. In a study of breast cancer in patients, Eliat et al measured Ktrans,TOI = 0.35 ± 0.29 min–1 and ve,TOI 0.43 ± 0.22 in malignant lesions, and Ktrans,TOI 0.14 ± 0.18 min–1 and ve,TOI = 0.49 ± 0.29 in benign lesions (Eliat 2004). Similar values were also measured by Furman-Haran et al (Furman-Haran 2005). The choices of fixed TOI parameter values here are consistent with these studies.
The effects of temporal resolution on quantitative DCE-MRI have been investigated by several groups (Buckley 2002, Evelhoch 1999, Lopata 2007). With the two-compartment model, as the sampling period is increased, Ktrans is underestimated and it becomes difficult to accurately measure vp. In the reference region model, the effects of increasing the sampling period are more complx. Each of the terms in equation (6), Cp(t) (calculated from the reference region), , and , is effected by the sampling period, which in turn effect the least-squares fit. When the sampling interval is made large enough to miss the initial peak in Ct,RR, the calculated Cp will not contain the large over- and undershoots seen in figure 1(a). This leads to unexpected results. For example, the absolute Ktrans,TOI error decreased when the sampling interval increased from 10 s to 20 s for the nvp,RR – nvp,TOI case. In the nνp,RR – νp,TOI case, the error decreased with increased sampling period, but in some cases it decreased from positive to negative, so that the absolute error was reduced for larger sampling intervals. In the vp,RR – vp,TOI case, the errors in general decreased from zero in all cases as the sampling period increased, but the dependence was not straightforward, as with the sign reversal for vp,TOI.
The physiology is best modeled if the vascular term is included in both regions, but this requires a priori knowledge of vp,RR and also introduces an additional degree of freedom in the fit, which will reduce the overall precision of the model. While the range of values of vp,RR in normal tissue is narrow, high temporal resolution (~ 1 s) is still needed since the integrals of Cp and Ct appear in the model solution (see equation (6)). With insufficient temporal resolution, these integral terms will be underestimated. In a model that includes the vascular term, the requirement for high temporal resolution for increased accuracy will impose greater limits on spatial resolution, slice coverage, and/or signal-to-noise, compared with a RR model that does not include the vascular term.
For the RR model without the vascular term, the errors may be acceptable at lower temporal resolutions, even for large ranges of vp,TOI. For nominal values of Ktrans,TOI = 0.25 min–1 and ve,TOI = 0.40, the errors in Ktrans,TOI ranged from –27 to 17%, and the errors in ve,TOI ranged from –14 to –3% for the range of vp,TOI studied (0.01–0.10). If vp,TOI = 0.04–0.08 (based on data in Fournier et al (2007) and Turetschek et al (2004)), the error ranges are small for Ktrans,TOI (–13 to 8%) and ve,TOI (–8 to –0%) for sampling periods up to 30 s.
In order for coarser sampling resolution to be sufficient, the magnitude of veCe must be large compared with vpCp, especially during the first pass, so that the initial peak due to the vascular contribution does not contribute significantly to Ct. When the vascular term was excluded from the tissue of interest, the model increased Ktrans,TOI as vp,TOI increased in an attempt to fit Ct,TOI (see figure 1(c)). In the nvp,RR – nvp,TOI case, Ktrans,TOI is first underestimated to compensate for the large overshoots in the fitted Cp (see figure 1(b)), then overestimated to compensate for the contribution of vp,TOI. The effect of ve,TOI is opposite that of vp,TOI, in that the error in Ktrans,TOI decreased with increasing values of ve,TOI. As ve,TOI increases, the relative contribution of Ce,RR to Ct,RR increases, decreasing the importance of the vascular contribution and the corresponding error in Ktrans,TOI.
Errors in the kinetic parameter calculations will affect the diagnostic accuracy of tests designed to detect differences between malignant and benign lesions or response to treatment. For example, consider the data collected by Eliat et al (Eliat 2004). Assume that the true difference of means is 0.35–0.14 = 0.21, and n is equal to 50 in the malignant and benign groups, and α = 0.05 for statistical significance. The power (1—probability of Type II error) of a two sample t-test test is quite high, 0.99 (Lenth 2006). If the Ktrans,TOI error is 30% (a conservative value for the nvp,RR – nvp,TOI case), so that in the malignant lesions it is measured to be 0.25 (with the same SD), then the power is reduced to 0.61. Alternatively, to maintain the same power of 0.99, then the n for each group would have to be increased from 50 to 178.
In this work the effect of the vascular term and sampling period in the reference region model was investigated through computer simulations. The complex interdependence of Ktrans,TOI, ve,TOI and vp,TOI was examined for different combinations of including the vascular term in the RR and TOI regions. If the vascular term was excluded from both regions, then the errors in Ktrans,TOI and ve,TOI were found to be within 30% for a large range of Ktrans,TOI, ve,TOI and vp,TOI. For nominal values of the kinetic parameters in the TOI (Ktrans,TOI = 0.25–1, ve,TOI = 0.40), Ktrans,TOI errors are within 10% for 0.05 < vp,TOI < 0.09 and within 20% for 0.03 < vp,TOI < 0.10. For these nominal values ve,TOI errors are within 10% for 0.03 < vp,TOI < 0.10 and within 20% for 0.01 < vp,TOI < 0.10.
The effect of the sampling period was complex, and in some cases increasing the sampling period actually reduced the error in the parameter estimation. This investigation demonstrates that the vascular term may have significant effects which need to be considered in the reference region model analysis of DCE-MRI data.
Acknowledgments
We thank the Lucas Foundation and National Institutes of Health for financial support through T32 CA09695, U24 CA 126588 and 1K25 EB005936.
Appendix
Here we outline the calculation of the plasma concentration, Cp, from the tissue concentration with inclusion of the vascular term. For the Tofts two-compartment model, the differential equation which describes the change in contrast concentration in the extravascular, extracellular space is
| (A.1) |
The tissue concentration is a weighted sum of the concentrations in the two compartments:
| (A.2) |
Solving for Ce gives
| (A.3) |
Substituting this expression into equation (A.1)
| (A.4) |
equation (A.4) may be written as
| (A.5) |
with y = Cp, f = Ct, a = Ktrans(1/vp + 1/ve), b = (1/vp) and c = (Ktrans/vpve).
Taking the Laplace transform of equation (A.5) and assuming y(0) = 0 and f(0) = 0,
| (A.6) |
where Y(s) and F(s) are the Laplace transforms of y and f, respectively.
Taking the inverse transform of equation (A.6), and denoting convolution by ⊗:
| (A.7) |
| (A.8) |
After using integration by parts on the first term, we have
| (A.9) |
Substituting our original terms back in and simplifying, we have
| (A.10) |
which is equation (4).
References
- Buckley DL. Uncertainty in the analysis of tracer kinetics using dynamic contrast-enhanced T1-weighted MRI. Magn. Reson. Med. 2002;47:601–6. doi: 10.1002/mrm.10080. [DOI] [PubMed] [Google Scholar]
- Cha S, Johnson G, Wadghiri YZ, Jin O, Babb J, Zagzag D, Turnbull DH. Dynamic, contrast-enhanced perfusion MRI in mouse gliomas: correlation with histopathology. Magn. Reson. Med. 2003;49:848–55. doi: 10.1002/mrm.10446. [DOI] [PubMed] [Google Scholar]
- Chen W, Giger ML, Bick U, Newstead GM. Automatic identification and classification of characteristic kinetic curves of breast lesions on DCE-MRI. Med. Phys. 2006;33:2878–87. doi: 10.1118/1.2210568. [DOI] [PubMed] [Google Scholar]
- Eliat PP-AD. Magnetic resonance imaging contrast-enhanced relaxometry of breast tumors: an MRI multicenter investigation concerning 100 patients. Magn. Reson. Imaging. 2004;22:475–81. doi: 10.1016/j.mri.2004.01.024. [DOI] [PubMed] [Google Scholar]
- Evelhoch JL. Key factors in the acquisition of contrast kinetic data for oncology. J. Magn. Reson. Imaging. 1999;10:254–9. doi: 10.1002/(sici)1522-2586(199909)10:3<254::aid-jmri5>3.0.co;2-9. [DOI] [PubMed] [Google Scholar]
- Faranesh AZ, Kraitchman DL, McVeigh ER. Measurement of kinetic parameters in skeletal muscle by magnetic resonance imaging with an intravascular agent. Magn. Reson. Med. 2006;55:1114–23. doi: 10.1002/mrm.20884. [DOI] [PMC free article] [PubMed] [Google Scholar]
- Fournier LS, Novikov V, Lucidi V, Fu Y, Miller T, Floyd E, Shames DM, Brasch RC. MR monitoring of cyclooxygenase-2 inhibition of angiogenesis in a human breast cancer model in rats. Radiology. 2007;243:105–11. doi: 10.1148/radiol.2431050658. [DOI] [PubMed] [Google Scholar]
- Furman-Haran EES. Magnetic resonance imaging reveals functional diversity of the vasculature in benign and malignant breast lesions. Cancer. 2005;104:708–18. doi: 10.1002/cncr.21225. [DOI] [PubMed] [Google Scholar]
- Goto M, Ito H, Akazawa K, Kubota T, Kizu O, Yamada K, Nishimura T. Diagnosis of breast tumors by contrast-enhanced MR imaging: comparison between the diagnostic performance of dynamic enhancement patterns and morphologic features. J. Magn. Reson. Imaging. 2007;25:104–12. doi: 10.1002/jmri.20812. [DOI] [PubMed] [Google Scholar]
- Harrer JU, Parker GJ, Haroon HA, Buckley DL, Embelton K, Roberts C, Baleriaux D, Jackson A. Comparative study of methods for determining vascular permeability and blood volume in human gliomas. J. Magn. Reson. Imaging. 2004;20:748–57. doi: 10.1002/jmri.20182. [DOI] [PubMed] [Google Scholar]
- Henderson E, Rutt BK, Lee TY. Temporal sampling requirements for the tracer kinetics modeling of breast disease. Magn. Reson. Imaging. 1998;16:1057–73. doi: 10.1016/s0730-725x(98)00130-1. [DOI] [PubMed] [Google Scholar]
- Henderson E, Sykes J, Drost D, Weinmann HJ, Rutt BK, Lee TY. Simultaneous MRI measurement of blood, flow blood volume, and capillary permeability in mammary tumors using two different contrast agents. J. Magn. Reson. Imaging. 2000;12:991–1003. doi: 10.1002/1522-2586(200012)12:6<991::aid-jmri26>3.0.co;2-1. [DOI] [PubMed] [Google Scholar]
- Jain RK. Determinants of tumor blood flow: a review. Cancer research. 1988;48:2641–58. [PubMed] [Google Scholar]
- Kety SS. The theory and applications of the exchange of inert gas at the lungs and tissues. Pharmacol. Rev. 1951;3:1–41. [PubMed] [Google Scholar]
- Kiessling F, Morgenstern B, Zhang C. Contrast agents and applications to assess tumor angiogenesis in vivo by magnetic resonance imaging. Curr. Med. Chem. 2007;14:77–91. doi: 10.2174/092986707779313516. [DOI] [PubMed] [Google Scholar]
- Kono R, Fujimoto K, Terasaki H, Muller NL, Kato S, Sadohara J, Hayabuchi N, Takamori S. Dynamic MRI of solitary pulmonary nodules: comparison of enhancement patterns of malignant and benign small peripheral lung lesions. Am. J. Roentgenol. 2007;188:26–36. doi: 10.2214/AJR.05.1446. [DOI] [PubMed] [Google Scholar]
- Kovar DA, Lewis M, Karczmar GS. A new method for imaging perfusion and contrast extraction fraction: input functions derived from reference tissues. J. Magn. Reson. Imaging. 1998;8:1126–34. doi: 10.1002/jmri.1880080519. [DOI] [PubMed] [Google Scholar]
- Kratz A, Lewandrowski KB. Case records of the Massachusetts General Hospital. Weekly clinicopathological exercises. Normal reference laboratory values. N. Engl. J. Med. 1998;339 doi: 10.1056/NEJM199810083391508. [DOI] [PubMed] [Google Scholar]
- Kuwatsuru R, Shames DM, Muhler A, Mintorovitch J, Vexler V, Mann JS, Cohn F, Price D, Huberty J, Brasch RC. Quantification of tissue plasma volume in the rat by contrast-enhanced magnetic resonance imaging. Magn. Reson. Med. 1993;30:76–81. doi: 10.1002/mrm.1910300112. [DOI] [PubMed] [Google Scholar]
- Lankester KJ, Maxwell RJ, Pedley RB, Dearling JL, Qureshi UA, El Emir E, Hill SA, Tozer GM. Combretastatin A-4-phosphate effectively increases tumor retention of the therapeutic antibody, 131I-A5B7, even at doses that are sub-optimal for vascular shut-down. Int. J. Oncol. 2007;30:453–60. [PubMed] [Google Scholar]
- Larsson HB, Stubgaard M, Frederiksen JL, Jensen M, Henriksen O, Paulson OB. Quantitation of blood– brain barrier defect by magnetic resonance imaging and gadolinium-DTPA in patients with multiple sclerosis and brain tumors. Magn. Reson. Med. 1990;16:117–31. doi: 10.1002/mrm.1910160111. [DOI] [PubMed] [Google Scholar]
- Lenth RV. [14 September 2007];Java Applets for Power and Sample Size [Computer software] 2006 from http://www.stat.uiowa.edu/~rlenth/Power.
- Lopata RG. On the identifiability of pharmacokinetic parameters in dynamic contrast-enhanced imaging. Magn. Reson. Med. 2007;58:425–9. doi: 10.1002/mrm.21336. [DOI] [PubMed] [Google Scholar]
- Misselwitz B, Schmitt-Willich H, Ebert W, Frenzel T, Weinmann HJ. Pharmacokinetics of Gadomer-17, a new dendritic magnetic resonance contrast agent. MAGMA. 2001;12:128–34. doi: 10.1007/BF02668094. [DOI] [PubMed] [Google Scholar]
- Montemurro F, Martincich L, Sarotto I, Bertotto I, Ponzone R, Cellini L, Redana S, Sismondi P, Aglietta M, Regge D. Relationship between DCE-MRI morphological and functional features and histopathological characteristics of breast cancer. Eur. Radiol. 2007;17:1490–7. doi: 10.1007/s00330-006-0505-x. [DOI] [PubMed] [Google Scholar]
- Murase K. Efficient method for calculating kinetic parameters using T1-weighted dynamic contrast-enhanced magnetic resonance imaging. Magn. Reson. Med. 2004;51:858–62. doi: 10.1002/mrm.20022. [DOI] [PubMed] [Google Scholar]
- Nakamura K, et al. KRN951, a highly potent inhibitor of vascular endothelial growth factor receptor tyrosine kinases, has antitumor activities and affects functional vascular properties. Cancer Res. 2006;66:9134–42. doi: 10.1158/0008-5472.CAN-05-4290. [DOI] [PubMed] [Google Scholar]
- Ogan MD, Schmiedl U, Moseley ME, Grodd W, Paajanen H, Brasch RC. Albumin labeled with Gd- DTPA. An intravascular contrast-enhancing agent for magnetic resonance blood pool imaging: preparation and characterization. Invest. Radiol. 1987;22:665–71. [PubMed] [Google Scholar]
- Parker GJ, Roberts C, Macdonald A, Buonaccorsi GA, Cheung S, Buckley DL, Jackson A, Watson Y, Davies K, Jayson GC. Experimentally-derived functional form for a population-averaged high-temporal-resolution arterial input function for dynamic contrast-enhanced. MRI Magn. Reson. Med. 2006;56:993–1000. doi: 10.1002/mrm.21066. [DOI] [PubMed] [Google Scholar]
- Provenzale JM, York G, Moya MG, Parks L, Choma M, Kealey S, Cole P, Serajuddin H. Correlation of relative permeability and relative cerebral blood volume in high-grade cerebral neoplasms. Am. J. Roentgenol. 2006;187:1036–42. doi: 10.2214/AJR.04.0676. [DOI] [PubMed] [Google Scholar]
- Su MY, et al. Correlation of dynamic contrast enhancement MRI parameters with microvessel density and VEGF for assessment of angiogenesis in breast cancer. J. Magn. Reson. Imaging. 2003;18:467–77. doi: 10.1002/jmri.10380. [DOI] [PubMed] [Google Scholar]
- Tofts PS. Modeling tracer kinetics in dynamic Gd-DTPA MR imaging. J. Magn. Reson. Imaging. 1997;7:91–101. doi: 10.1002/jmri.1880070113. [DOI] [PubMed] [Google Scholar]
- Tofts PS, Kermode AG. Measurement of the blood–brain barrier permeability and leakage space using dynamic MR imaging: 1. fundamental concepts. Magn. Reson. Med. 1991;17:357–67. doi: 10.1002/mrm.1910170208. [DOI] [PubMed] [Google Scholar]
- Tofts PS, et al. Estimating kinetic parameters from dynamic contrast-enhanced T(1)-weighted MRI of a diffusable tracer: standardized quantities and symbols. J. Magn. Reson. Imaging. 1999;10:223–32. doi: 10.1002/(sici)1522-2586(199909)10:3<223::aid-jmri2>3.0.co;2-s. [DOI] [PubMed] [Google Scholar]
- Turetschek K, Preda A, Novikov V, Brasch RC, Weinmann HJ, Wunderbaldinger P, Roberts TP. Tumor microvascular changes in antiangiogenic treatment: assessment by magnetic resonance contrast media of different molecular weights. J. Magn. Reson. Imaging. 2004;20:138–44. doi: 10.1002/jmri.20049. [DOI] [PubMed] [Google Scholar]
- Wilmes LJ, et al. AG-013736, a novel inhibitor of VEGF receptor tyrosine kinases, inhibits breast cancer growth and decreases vascular permeability as detected by dynamic contrast-enhanced magnetic resonance imaging. Magn. Reson. Imaging. 2007;25:319–27. doi: 10.1016/j.mri.2006.09.041. [DOI] [PubMed] [Google Scholar]
- Yang C, Karczmar GS, Medved M, Stadler WM. Estimating the arterial input function using two reference tissues in dynamic contrast-enhanced MRI studies: fundamental concepts and simulations. Magn. Reson. Med. 2004;52:1110–7. doi: 10.1002/mrm.20243. [DOI] [PubMed] [Google Scholar]
- Yankeelov TE, Gore JC. Dynamic contrast enhanced magnetic resonance imaging in oncology: theory, data acquisition, analysis, and examples. Curr. Med. Imaging Rev. 2007;3:91–107. doi: 10.2174/157340507780619179. [DOI] [PMC free article] [PubMed] [Google Scholar]
- Yankeelov TE, Luci JJ, Lepage M, Li R, Debusk L, Lin PC, Price RR, Gore JC. Quantitative pharmacokinetic analysis of DCE-MRI data without an arterial input function: a reference region model. Magn. Reson. Imaging. 2005;23:519–29. doi: 10.1016/j.mri.2005.02.013. [DOI] [PubMed] [Google Scholar]
- Zahra MA, Hollingsworth KG, Sala E, Lomas DJ, Tan LT. Dynamic contrast-enhanced MRI as a predictor of tumour response to radiotherapy. Lancet Oncol. 2007;8:63–74. doi: 10.1016/S1470-2045(06)71012-9. [DOI] [PubMed] [Google Scholar]


