
Fig. 3 .
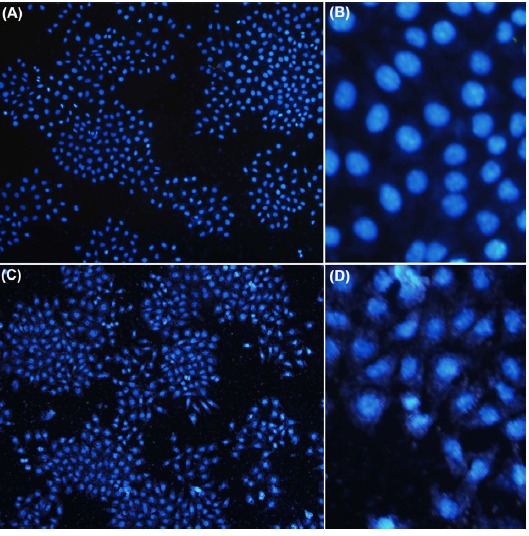
Fluorescent microscopy of NIH-3T3 cells stained with DAPI. A and B) Untreated control cells. C and D) H2O2 - treated cells.
Official websites use .gov
A
.gov website belongs to an official
government organization in the United States.
Secure .gov websites use HTTPS
A lock (
) or https:// means you've safely
connected to the .gov website. Share sensitive
information only on official, secure websites.
Fluorescent microscopy of NIH-3T3 cells stained with DAPI. A and B) Untreated control cells. C and D) H2O2 - treated cells.