Abstract
Background
The prognostic value of inflammatory index in esophageal cancer (EC) has not been established. In the present study, therefore, we initially evaluated a novel prognostic system, named the COCC (COmbination of C-reactive protein [CRP] and carcinoembryonic antigen [CEA]), for making a prognosis in patients with esophageal squamous cell carcinoma (ESCC).
Methods
A total of 327 patients with ESCC between January 2006 and December 2008 were included in this retrospective study. The COCC was calculated by combined CRP and CEA according to the logistic equation. The Kaplan–Meier method was used to calculate the cancer-specific survival (CSS), and the difference was assessed by the log-rank test. Cox regression analyses were performed to evaluate the prognostic factors.
Results
In our study, COCC was defined as CRP +0.71 CEA according to the logistic equation. Receiver operating characteristic curves for CSS prediction were plotted to verify the optimum cutoff points for CRP, CEA, and COCC, which were 9.8 mg/L, 4.2 ng/mL, and 8.0, respectively. Patients with COCC ≤8.0 had a significantly better CSS than patients with COCC >8.0 (53.1% vs 15.3%, P<0.001). Multivariate analysis revealed that COCC was an independent prognostic factor in patients with ESCC (P=0.006). In addition, the area under the curve (AUC) was 0.722 for COCC, 0.645 for CRP, and 0.618 for CEA, indicating that COCC was superior to CRP or CEA for CSS prediction.
Conclusion
The COCC is an independent prognostic factor in patients with ESCC. We conclude that COCC was superior to CRP or CEA as a more precise prognostic factor in patients with ESCC.
Keywords: esophageal squamous cell carcinoma, C-reactive protein, carcinoembryonic antigen, cancer-specific survival, prognosis
Introduction
Esophageal cancer (EC) is the eighth most common cancer worldwide, but the sixth leading cause of death due to cancer.1 The most common histological types regarding EC are esophageal squamous cell carcinoma (ESCC) and esophageal adenocarcinoma (EAC).2 In contrast to the predominance of EAC in the Western countries, ESCC accounts for more than 95% of ECs in People’s Republic of China.2,3 Radical resection remains the treatment of choice; however, the prognosis is still poor in patients with EC.4,5 The histological types in ECs differ between People’s Republic of China and Western countries, and therefore, a prognostic study that takes into account ESCC in People’s Republic of China is more and more important.
In recent years, systemic inflammatory response (SIR) has been playing an important role in cancer.6,7 Serum C-reactive protein (CRP) is a sensitive indicator of SIR. Previous studies have shown that serum CRP was associated with prognosis in several cancers.8–10 Similar results were also found in ECs. This observation is in line with data from Nozoe et al,11 Feng et al12 and Ikeda et al.13 However, Zingg et al14 suggested that CRP is not an independent factor in EC patients who proceeded directly to surgery. Moreover, it was shown that trauma, renal and/or hepatic failure, and many inflammatory diseases may potentially affect the CRP.15,16 Therefore, CRP alone without other variables may not be associated with real prognosis. Thus, the prognostic value of serum CRP with other variables (such as tumor markers) may be a new research hotspot. Carcinoembryonic antigen (CEA) is the most widely used and readily available tumor marker for gastrointestinal cancer.17,18 In the present study, therefore, we initially evaluated a novel prognostic system, named the COCC (COmbination of CRP and CEA), for making a prognosis of patients with ESCC.
Patients and methods
A total of 327 consecutive patients with ESCC who underwent curative esophagectomy between January 2006 and December 2008 in Zhejiang Cancer Hospital (Hangzhou, People’s Republic of China) were included in this retrospective study. All of the patients included in the analysis fit the criteria: 1) ESCC was confirmed by histopathology with curative esophagectomy; 2) patients without preoperative neoadjuvant therapy; 3) patients without previous anti-inflammatory medicines within 1 week; 4) patients without trauma, renal and/or hepatic failure, and other inflammatory diseases; and 5) preoperative serum CRP and CEA were obtained before esophagectomy within 1 week.
Serum CRP was determined by latex-enhanced homogeneous immunoassay. Serum CEA was detected by immunoradiometric assay. The cutoff values for CRP and CEA were 10 mg/L and 5 ng/mL, respectively. Based on our medical records, the following data were also collected for each patient: age, gender, tumor length and location, differentiation, T stage, and N stage. Ethical approval was obtained from the Ethical Committees of Zhejiang Cancer Hospital (Hangzhou, People’s Republic of China). All of the patients included in the study were staged according to the seventh edition of the American Joint Committee on Cancer (AJCC) Staging.19
Patients were followed up at our outpatient department every 3–6 months for the first 2 years, then annually. The last follow-up was on November 30, 2011. As this series described the prognosis of patients with ESCC, a cancer-specific survival (CSS) was ascertained in the current study. The CSS was defined as the time from surgery to cancer-related death.
Statistical analysis
Statistical evaluation was performed with SPSS 17.0 (Chicago, IL, USA). A logistic regression analysis was done to identify the CRP and CEA in the prognosis of ESCC and yield a logistic equation. The COCC was calculated by combined CRP and CEA according to the logistic equation. A receiver operating characteristic (ROC) curve for CSS prediction was plotted to verify the optimum cutoff point for CRP, CEA, and COCC. The area under the curve (AUC) was used as an estimation of diagnostic accuracy. Chi-squared test was used to determine the significance of differences for patients grouped by COCC. Pearson correlation analysis was performed to calculate the correlation among CRP, CEA, and COCC. The CSS was calculated by the Kaplan–Meier method, and the difference was assessed by the log-rank test. A univariate analysis was used to examine the prognostic predictors. Possible prognostic factors were considered in a multivariable analysis. A P<0.05 was considered to be statistically significant.
Results
The baseline characteristics are shown in Table 1. Among the 327 patients, 41 (12.5%) were women and 286 (87.5%) were men. The mean age was 59.3±7.8 years (ranges, 38–80 years). The mean CRP and CEA were 9.1±14.9 mg/L and 3.5±2.9 ng/mL, respectively. The positive rates for CRP and CEA were 27.8% (91/327) and 17.4% (57/327), respectively.
Table 1.
The baseline characteristics of patients in ESCC
| Cases (n, %) | |
|---|---|
| Age (mean ± SD, years) | 59.3±7.8 |
| ≤60 | 183 (56.0) |
| >60 | 144 (44.0) |
| Gender | |
| Female | 41 (12.5) |
| Male | 286 (87.5) |
| Tumor location | |
| Upper | 16 (4.9) |
| Middle | 159 (48.6) |
| Lower | 152 (46.5) |
| Differentiation | |
| Well | 48 (14.7) |
| Moderate | 214 (65.4) |
| Poor | 65 (19.9) |
| T stage | |
| T1 | 52 (15.9) |
| T2 | 55 (16.8) |
| T3 | 185 (56.6) |
| T4a | 35 (10.7) |
| N stage | |
| N0 | 174 (53.2) |
| N1 | 88 (26.9) |
| N2 | 44 (13.5) |
| N3 | 21 (6.4) |
| CRP (mean ± SD, mg/L) | 9.1±14.9 |
| CEA (mean ± SD, ng/mL) | 3.5±2.9 |
Abbreviations: ESCC, esophageal squamous cell carcinoma; SD, standard deviations; T, tumor; N, node; CRP, C-reactive protein; CEA, carcinoembryonic antigen.
CRP and CEA were then extracted for logistic regression analysis to identify the positive prognosis. Subsequently, the logistic regression equation was as follows:
Thus,
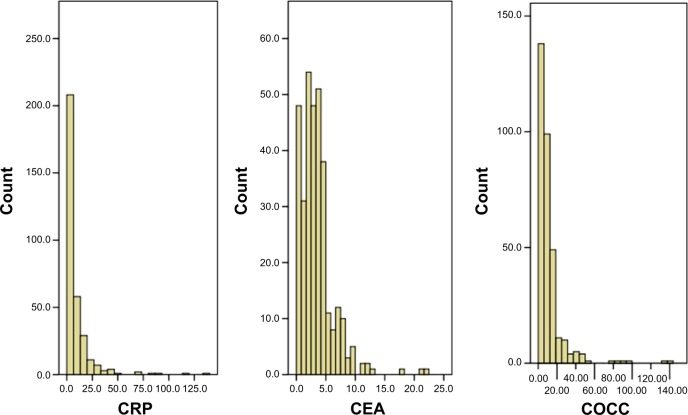
The histograms of CRP, CEA, and COCC are shown in Figure 1.
Figure 1.
The histograms of the CRP, CEA, and COCC.
Notes: The mean values for CRP, CEA, and COCC were 9.1±14.9 mg/L, 3.5±2.9 ng/mL, and 11.5±15.9, respectively.
Abbreviations: CRP, C-reactive protein; CEA, carcinoembryonic antigen; COCC, COmbination of CRP and CEA.
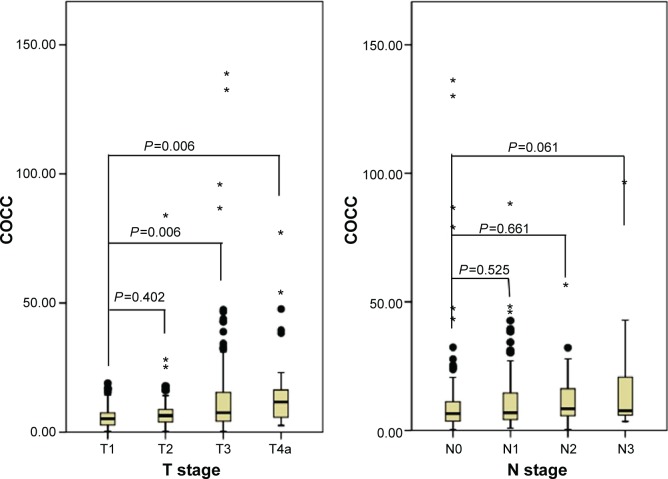
The ROC curves for survival prediction (CSS) were plotted to verify the optimum cutoff points for CRP, CEA, and COCC, which were 9.8 mg/L, 4.2 ng/mL, and 8.0, respectively (Figure 2). The patients were then divided into two groups for further analysis (patients with COCC ≤8.0 and patients with COCC >8.0). In our study, there were 196 (59.9%) patients with COCC ≤8.0 and 131 (40.1%) patients with COCC >8.0. Our study demonstrated that COCC was associated with tumor length (P=0.002), differentiation (P=0.035), T stage (P<0.001), and N stage (P=0.016) (Table 2). In addition, our study showed that the values of COCC were higher in patients with high T stage and N stage (Figure 3).
Figure 2.
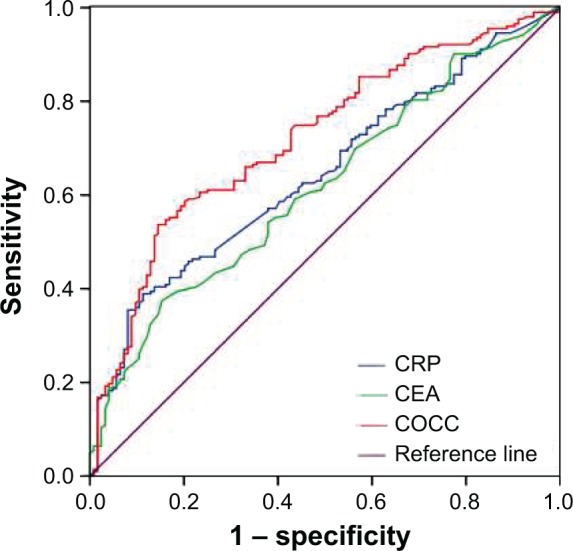
ROC curves for CSS prediction.
Notes: An ROC curve plots the sensitivity on the y-axis against one minus the specificity on the x-axis. A diagonal line at 45°, known as the line of chance, would result from a test that allocated subjects randomly. ROC curves for CSS were plotted to verify the optimum cutoff points for CRP, CEA, and COCC, which were 9.8 mg/L, 4.2 ng/mL, and 8.0, respectively. The AUC was 0.722 (95% CI: 0.666–0.778, P<0.001) for COCC, 0.645 (95% CI: 0.586–0.705, P<0.001) for CRP, and 0.618 (95% CI: 0.557–0.679, P<0.001) for CEA.
Abbreviations: CRP, C-reactive protein; CEA, carcinoembryonic antigen; COCC, COmbination of CRP and CEA; ROC, receiver operating characteristic; CSS, cancer-specific survival; AUC, area under the curve.
Table 2.
Comparison of baseline clinical characteristics based on COCC
| COCC ≤8.0 (n, %) | COCC >8.0 (n, %) | P-value | |
|---|---|---|---|
| Age (years) | |||
| ≤60 | 113 (57.7) | 70 (53.4) | 0.452 |
| >60 | 83 (42.3) | 61 (46.6) | |
| Gender | |||
| Female | 25 (12.8) | 16 (12.2) | 0.885 |
| Male | 171 (87.2) | 115 (87.8) | |
| Tumor length (cm) | |||
| ≤3 | 65 (33.2) | 23 (17.6) | 0.002 |
| >3 | 131 (66.8) | 108 (82.4) | |
| Tumor location | |||
| Upper | 10 (5.1) | 6 (4.6) | 0.064 |
| Middle | 85 (43.4) | 74 (56.5) | |
| Lower | 101 (51.5) | 51 (38.9) | |
| Vessel invasion | |||
| Negative | 168 (85.7) | 108 (82.4) | 0.424 |
| Positive | 28 (14.3) | 23 (17.6) | |
| Differentiation | |||
| Well | 32 (16.3) | 16 (12.2) | 0.035 |
| Moderate | 134 (68.4) | 80 (61.1) | |
| Poor | 30 (15.3) | 35 (26.7) | |
| T stage | |||
| T1 | 41 (20.9) | 11 (8.4) | 0.001 |
| T2 | 38 (19.4) | 17 (13.0) | |
| T3 | 103 (52.6) | 82 (62.6) | |
| T4a | 14 (7.1) | 21 (16.0) | |
| N stage | |||
| N0 | 116 (59.2) | 58 (44.3) | 0.016 |
| N1 | 50 (25.5) | 38 (29.0) | |
| N2 | 18 (9.2) | 26 (19.8) | |
| N3 | 12 (6.1) | 9 (6.9) | |
Note: The bold values indicate <0.05.
Abbreviations: COCC, COmbination of CRP and CEA; T, tumor; N, node.
Figure 3.
The values of COCCin patients with different T stages and Nstages.
Notes: The mean values of COCCfor T1, T2, T3, and T4a were 6.23±4.71, 8.78±11.99, 13.05±18.26, and 15.71±16.46, respectively. The mean values of COCCfor N0, N1, N2, and N3 were 10.58±17.35, 11.89±13.57, 11.75±9.61, and 17.46±21.62, respectively.
Abbreviations: COCC, COmbination of CRP and CEA; T, tumor; N, node.
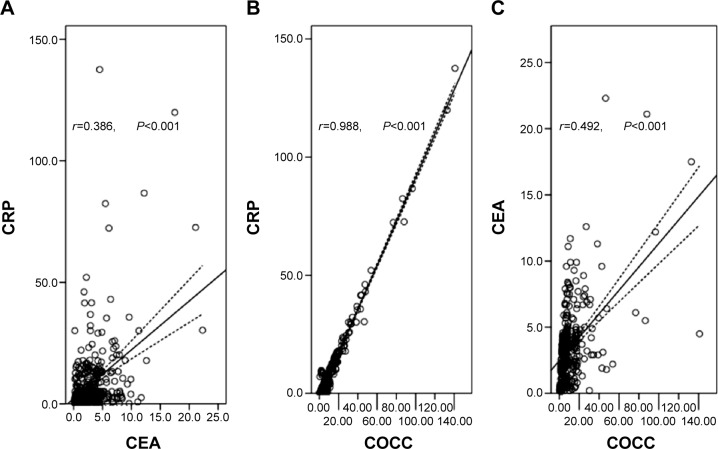
Pearson correlation analysis was used to analyze the correlation of CRP, CEA, and COCC. Our results revealed that there were significant positive correlations between CRP and CEA (r=0.386, P<0.001, Figure 4A), CRP and COCC (r=0.988, P<0.001, Figure 4B), CEA and COCC (r=0.492, P<0.001, Figure 4C).
Figure 4.
Pearson correlation analysis.
Notes: There were significant positive correlations between CRP and CEA (r=0.386, P<0.001; A), CRP and COCC (r=0.988, P<0.001; B), CEA and COCC (r=0.492, P<0.001; C).
Abbreviations: CRP, C-reactive protein; CEA, carcinoembryonic antigen; COCC, COmbination of CRP and CEA.
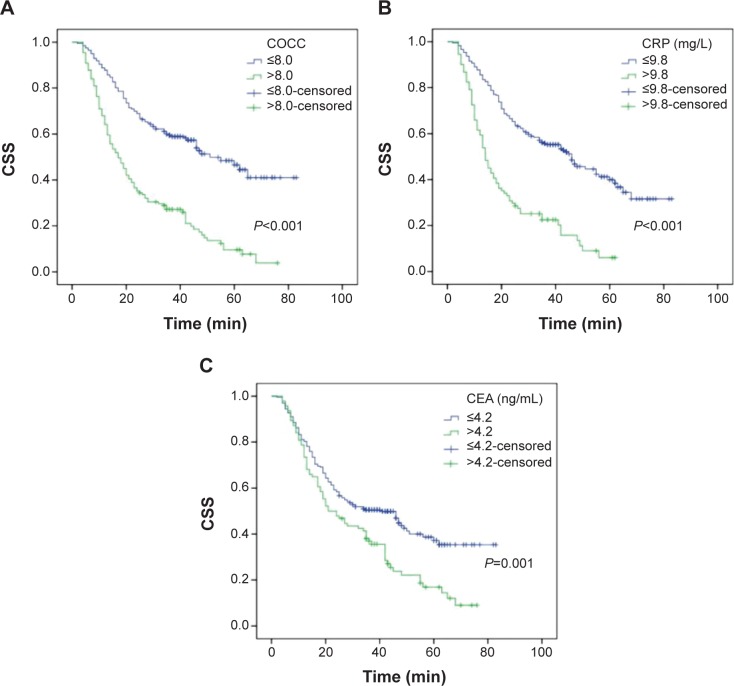
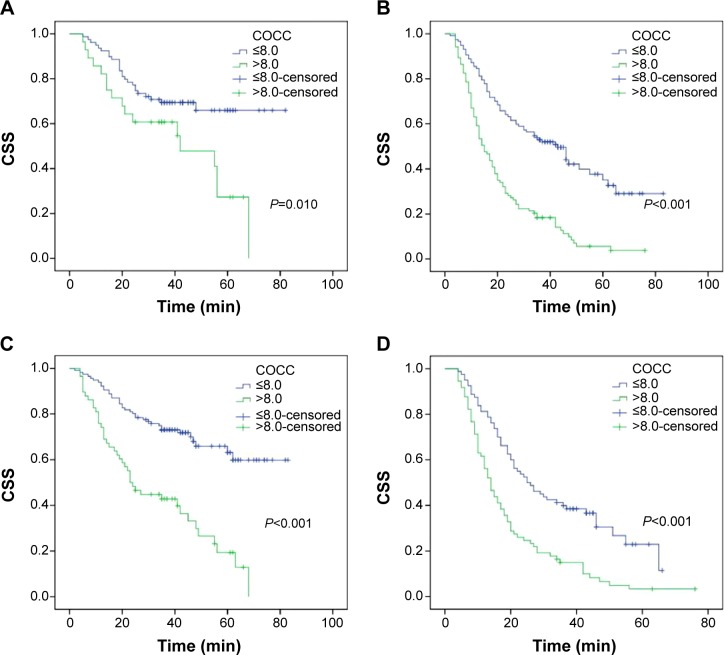
Patients with COCC ≤8.0 had a significantly better CSS than patients with COCC >8.0 (53.1% vs 15.3%, P<0.001) (Figure 5A). There were also significant differences in CSS regarding CRP (46.6% vs 15.4%, P<0.001, Figure 5B) and CEA (45.1% vs 20.2%, P=0.001, Figure 5C). To assess the confounding effect of COCC on T stage and N stage, we further stratified patients into different groups corresponding to T stage (T1–T2 and T3–T4a) and N stage (N0 and N1–N3). The predictive value of COCC was significant in patients with T1–T2 (P=0.010), T3–T4a (P<0.001), N0 (P<0.001), and N1–N3 (P<0.001) (Figure 6).
Figure 5.
Kaplan–Meier CSS curves stratified by CRP, CEA, and COCC.
Notes: Patients with COCC ≤8.0 had a significantly better CSS than patients with COCC >8.0 (53.1% vs 15.3%, P<0.001; A). There were also significant differences in CSS regarding CRP (46.6% vs 15.4%, P<0.001; B) and CEA (45.1% vs 20.2%, P=0.001; C).
Abbreviations: CSS, cancer-specific survival; CRP, Creactive protein; CEA, carcinoembryonic antigen; COCC, COmbination of CRP and CEA.
Figure 6.
Kaplan–Meier CSS curves stratified by COCC in patients with T stage and N stage.
Notes: The predictive value of COCC was significant in patients with T1–T2 (P=0.010, A), T3–T4a (P<0.001, B), N0 (P<0.001, C), and N1–N3 (P<0.001, D).
Abbreviations: CSS, cancer-specific survival; COCC, COmbination of CRP and CEA; T, tumor; N, node.
In univariate analysis, we found that tumor length (P<0.001), vessel invasion (P<0.001), T stage (P<0.001), N stage (P<0.001), CRP (P<0.001), CEA (P=0.001), and COCC (P<0.001) had significant associations with CSS (Table 3). The multivariate Cox proportional hazards model demonstrated that COCC was an independent prognostic factor in patients with ESCC (Table 3). COCC >8.0 had a hazard ratio (HR) of 1.809 [95% confidence interval (CI): 1.190–2.751, P=0.006] for CSS (Table 4).
Table 3.
Univariate analyses of CSS in ESCC patients
| CSS (%) | P-value | HR (95% CI) | P-value | |
|---|---|---|---|---|
| Age (years) | ||||
| ≤60 | 38.8 | 0.543 | 1.000 | 0.547 |
| >60 | 36.8 | 1.089 (0.825–1.436) | ||
| Gender | ||||
| Female | 43.9 | 0.425 | 1.000 | 0.431 |
| Male | 37.1 | 1.191 (0.771–1.838) | ||
| Tumor length (cm) | ||||
| ≤3 | 54.5 | <0.001 | 1.000 | <0.001 |
| >3 | 31.8 | 2.048 (1.446–2.902) | ||
| Tumor location | ||||
| Upper/middle | 41.7 | 0.264 | 1.000 | 0.270 |
| Lower | 33.6 | 1.167 (0.833–1.394) | ||
| Vessel invasion | ||||
| Negative | 41.7 | <0.001 | 1.000 | <0.001 |
| Positive | 17.6 | 1.971 (1.400–2.774) | ||
| Differentiation | ||||
| Well/moderate | 39.1 | 0.119 | 1.000 | 0.124 |
| Poor | 33.3 | 1.300 (0.930–1.816) | ||
| T stage | ||||
| T1–T2 | 60.7 | <0.001 | 1.000 | <0.001 |
| T3–T4 | 26.8 | 2.523 (1.795–3.546) | ||
| N stage | ||||
| N0 | 54.6 | <0.001 | 1.000 | <0.001 |
| N1–N3 | 19.0 | 2.717 (2.040–3.618) | ||
| Adjuvant therapy | ||||
| No | 39.4 | 0.236 | 1.000 | 0.242 |
| Yes | 34.7 | 1.192 (0.888–1.600) | ||
| CRP (mg/L) | ||||
| ≤9.8 | 46.6 | <0.001 | 1.000 | <0.001 |
| >9.8 | 15.4 | 2.821 (2.111–3.770) | ||
| CEA (ng/mL) | ||||
| ≤4.2 | 45.1 | 0.001 | 1.000 | 0.001 |
| >4.2 | 20.2 | 1.616 (1.215–2.150) | ||
| COCC | ||||
| ≤8.0 | 53.1 | <0.001 | 1.000 | <0.001 |
| >8.0 | 15.3 | 2.804 (2.121–3.707) | ||
Note: The bold values indicate <0.05.
Abbreviations: CSS, cancer-specific survival; ESCC, esophageal squamous cell carcinoma; T, tumor; N, node; CRP, C-reactive protein; CEA, carcinoembryonic antigen; COCC, COmbination of CRP and CEA; HR, hazard ratio; CI, confidence interval.
Table 4.
Multivariate analyses of CSS in ESCC patients
| HR (95% CI) | P-value | |
|---|---|---|
| Tumor length (>3 vs ≤3 cm) | 1.240 (0.838–1.834) | 0.282 |
| Vessel invasion (positive vs negative) | 1.341 (0.936–1.921) | 0.109 |
| T stage (T3–T4a vs T1–T2) | 1.546 (1.047–2.282) | 0.028 |
| N stage (N1–N3 vs N0) | 1.999 (1.454–2.747) | <0.001 |
| CRP (>9.8 vs ≤9.8 mg/L) | 1.627 (1.072–2.471) | 0.022 |
| CEA (>4.2 vs ≤4.2 ng/mL) | 1.037 (0.762–1.411) | 0.818 |
| COCC (>8.0 vs ≤8.0) | 1.809 (1.190–2.751) | 0.006 |
Note: The bold values indicate <0.05.
Abbreviations: CSS, cancer-specific survival; ESCC, esophageal squamous cell carcinoma; T, tumor; N, node; CRP, C-reactive protein; CEA, carcinoembryonic antigen; COCC, COmbination of CRP and CEA; HR, hazard ratio; CI, confidence interval.
The AUC was 0.722 (95% CI: 0.666–0.778, P<0.001) for COCC, 0.645 (95% CI: 0.586–0.705, P<0.001) for CRP, and 0.618 (95% CI: 0.557–0.679, P<0.001) for CEA, indicating that COCC was superior to CRP or CEA and could be used as a more precise prognostic model for ESCC patients (Figure 2).
Discussion
In the present study, we initially evaluated the novel prognostic model (COCC) in patients with ESCC. Our study demonstrated that COCC is associated with cancer prognosis and can be considered as an independent prognostic marker in patients with ESCC. We used an ROC curve for CSS prediction to verify the optimal cutoff point. In our study, we concluded that the value of 8.0 may be the optimum cutoff point for COCC in predicting CSS in patients with ESCC. We conclude COCC was superior to CRP or CEA as a more precise prognostic factor in patients with ESCC.
Serum tumor marker plays an important role in cancer diagnosis and prognosis. CEA is the most widely used and readily available tumor marker for gastrointestinal cancer.17,18 To date, there have been few studies regarding CEA in patients with EC mainly because of its low sensitivity and specificity. In our study, the positive rate for CEA in patients with ESCC was 17.4%. Thus, we used an ROC curve for CSS prediction to verify the optimal cutoff point for CEA, which was 4.2 ng/mL. Previous studies have demonstrated the efficacy of CEA as a diagnostic and prognostic marker in patients with EC.20,21 In our study, there were significant differences in CSS regarding CEA (45.1% vs 20.2%, P=0.001). However, CEA was not an independent prognostic factor in patients with ESCC (P=0.818).
There is a strong linkage between inflammation and cancer. In the current study, we analyzed the prognostic value of COCC in patients with ESCC without preoperative neoadjuvant therapy mainly because chemotherapy and/or radiation will have an important impact on the SIR. CRP is a very sensitive indicator of SIR. Previous published studies have shown that serum CRP is a significant prognostic indicator in several cancers.8–10 However, its role in EC is still controversial.11–14 In addition, several studies have demonstrated that trauma, renal and/or hepatic failure, and many inflammatory diseases may potentially affect the CRP.15,16 Therefore, the CRP may be considered insufficient for prognostication.
In the current study, therefore, we initially conducted a study to determine whether the novel prognostic model (COCC) is useful for predicting CSS in patients with ESCC. Thus, we used an ROC curve for CSS prediction to verify the optimal cutoff point for COCC, which was 8.0. In our study, Kaplan–Meier analysis showed that COCC was able to divide such patients into two independent groups (P<0.001). Then multivariate analysis demonstrated that COCC was an independent prognostic factor in patients with ESCC (P=0.006). In addition, our study showed a better discrimination for COCC in terms of HR than CRP and CEA. The AUC of the COCC was the largest (Figure 2), indicating that COCC was superior to CRP or CEA as a predictive factor in patients with ESCC. In the further investigation, subgroup analysis was also performed. In our study, the predictive value of COCC was also significant in patients with T1–T2 (P=0.010), T3–T4a (P<0.001), N0 (P<0.001), and N1–N3 (P<0.001) (Figure 5).
Several limitations should be acknowledged in the current study. First, the current study was a retrospective study with a small sample and short duration of the mean follow-up. Second, the current study used data from a single institution, but without a control group, there may have been a lack of uniformity. Third, patients who had neoadjuvant chemotherapy and/or radiotherapy were excluded from the current study, which may have influenced our analysis. Therefore, further studies are needed to illuminate the relationship between COCC and prognosis in patients with ESCC.
Conclusion
In summary, our study showed that COCC is associated with prognosis and can be considered as an independent prognostic marker in patients who underwent esophagectomy for ESCC. We conclude that COCC was superior to CRP or CEA as a more precise prognostic factor in patients with ESCC.
Footnotes
Disclosure
The authors report no conflicts of interest in this work.
References
- 1.Ferlay J, Shin HR, Bray F, et al. Estimates of worldwide burden of cancer in 2008: GLOBOCAN 2008. Int J Cancer. 2010;127(12):2893–2897. doi: 10.1002/ijc.25516. [DOI] [PubMed] [Google Scholar]
- 2.Napier KJ, Scheerer M, Misra S. Esophageal cancer: a review of epidemiology, pathogenesis, staging workup and treatment modalities. World J Gastrointest Oncol. 2014;6(5):112–120. doi: 10.4251/wjgo.v6.i5.112. [DOI] [PMC free article] [PubMed] [Google Scholar]
- 3.Lin Y, Totsuka Y, He Y, et al. Epidemiology of esophageal cancer in Japan and China. J Epidemiol. 2013;23(4):233–242. doi: 10.2188/jea.JE20120162. [DOI] [PMC free article] [PubMed] [Google Scholar]
- 4.Feng JF, Chen QX. Significance of the prognostic nutritional index in patients with esophageal squamous cell carcinoma. Ther Clin Risk Manag. 2014;10:1–7. doi: 10.2147/TCRM.S56159. [DOI] [PMC free article] [PubMed] [Google Scholar]
- 5.Keditsu KK, Jiwnani S, Karimundackal G, et al. Multimodality management of esophageal cancer. Indian J Surg Oncol. 2013;4(2):96–104. doi: 10.1007/s13193-013-0216-0. [DOI] [PMC free article] [PubMed] [Google Scholar]
- 6.Balkwill F, Mantovani A. Inflammation and cancer: back to Virchow? Lancet. 2001;357(9255):539–545. doi: 10.1016/S0140-6736(00)04046-0. [DOI] [PubMed] [Google Scholar]
- 7.Mantovani A, Allavena P, Sica A, et al. Cancer-related inflammation. Nature. 2008;454(7203):436–444. doi: 10.1038/nature07205. [DOI] [PubMed] [Google Scholar]
- 8.Nozoe T, Iguchi T, Adachi E, et al. Preoperative elevation of serum C-reactive protein as an independent prognostic indicator for gastric cancer. Surg Today. 2011;41(4):510–513. doi: 10.1007/s00595-009-4297-x. [DOI] [PubMed] [Google Scholar]
- 9.Hashimoto K, Ikeda Y, Korenaga D, et al. The impact of preoperative serum C-reactive protein on the prognosis of patients with hepatocellular carcinoma. Cancer. 2005;103(9):1856–1864. doi: 10.1002/cncr.20976. [DOI] [PubMed] [Google Scholar]
- 10.Koike Y, Miki C, Okugawa Y, et al. Preoperative C-reactive protein as a prognostic and therapeutic marker for colorectal cancer. J Surg Oncol. 2008;98(7):540–544. doi: 10.1002/jso.21154. [DOI] [PubMed] [Google Scholar]
- 11.Nozoe T, Saeki H, Sugimachi K. Significance of pre-operative elevation of serum C-reactive protein as an indicator of prognosis. Am J Surg. 2001;182(2):197–201. doi: 10.1016/s0002-9610(01)00684-5. [DOI] [PubMed] [Google Scholar]
- 12.Feng JF, Zhao HG, Liu JS, et al. Significance of preoperative C-reactive protein as a parameter in patients with small cell carcinoma of the esophagus. Onco Targets Ther. 2013;6:1147–1151. doi: 10.2147/OTT.S50039. [DOI] [PMC free article] [PubMed] [Google Scholar]
- 13.Ikeda M, Natsugoe S, Ueno S, et al. Significant host- and tumor-related factors for predicting prognosis in patients with esophageal carcinoma. Ann Surg. 2003;238(2):197–202. doi: 10.1097/01.sla.0000080822.22415.cb. [DOI] [PMC free article] [PubMed] [Google Scholar]
- 14.Zingg U, Forberger J, Rajcic B, et al. Association of C-reactive protein levels and long-term survival after neoadjuvant therapy and esophagectomy for esophageal cancer. J Gastrointest Surg. 2010;14(3):462–469. doi: 10.1007/s11605-009-1113-2. [DOI] [PubMed] [Google Scholar]
- 15.Schrepf A, Markon K, Lutgendorf SK. From childhood trauma to elevated C-reactive protein in adulthood: the role of anxiety and emotional eating. Psychosom Med. 2014;76(5):327–336. doi: 10.1097/PSY.0000000000000072. [DOI] [PMC free article] [PubMed] [Google Scholar]
- 16.Takahashi H, Ishii H, Aoyama T, et al. Association of cardiac valvular calcifications and C-reactive protein with cardiovascular mortality in incident hemodialysis patients: a Japanese cohort study. Am J Kidney Dis. 2013;61(2):254–261. doi: 10.1053/j.ajkd.2012.09.007. [DOI] [PubMed] [Google Scholar]
- 17.Michl M, Koch J, Laubender RP, et al. Tumor markers CEA and CA 19-9 correlate with radiological imaging in metastatic colorectal cancer patients receiving first-line chemotherapy. Tumour Biol. 2014;35(10):10121–10127. doi: 10.1007/s13277-014-2280-7. [DOI] [PubMed] [Google Scholar]
- 18.Jeon CH, Kim IH, Chae HD. Prognostic value of genetic detection using CEA and MAGE in peritoneal washes with gastriccarcinoma after curative resection: result of a 3-year follow-up. Medicine. 2014;93(11):e83. doi: 10.1097/MD.0000000000000083. [DOI] [PMC free article] [PubMed] [Google Scholar]
- 19.Rice TW, Rusch VW, Ishwaran H, et al. Cancer of the esophagus and esophagogastric junction: data-driven staging for the seventh edition of the American Joint Committee on Cancer/International Union Against Cancer Staging Manuals. Cancer. 2010;116(16):3763–3773. doi: 10.1002/cncr.25146. [DOI] [PubMed] [Google Scholar]
- 20.Zhang HQ, Wang RB, Yan HJ, et al. Prognostic significance of CYFRA21-1, CEA and hemoglobin in patients with esophageal squamous cancer undergoing concurrent chemoradiotherapy. Asian Pac J Cancer Prev. 2012;13(1):199–203. doi: 10.7314/apjcp.2012.13.1.199. [DOI] [PubMed] [Google Scholar]
- 21.Yi Y, Li B, Wang Z, et al. CYFRA21-1 and CEA are useful markers for predicting the sensitivity to chemoradiotherapy of esophageal squamous cell carcinoma. Biomarkers. 2009;14(7):480–485. doi: 10.3109/13547500903180265. [DOI] [PubMed] [Google Scholar]


