Abstract
Biofilms are surface-attached microbial communities that have complex structures and produce significant spatial heterogeneities. Biofilm development is strongly regulated by the surrounding flow and nutritional environment. Biofilm growth also increases the heterogeneity of the local microenvironment by generating complex flow fields and solute transport patterns. To investigate the development of heterogeneity in biofilms and interactions between biofilms and their local micro-habitat, we grew mono-species biofilms of Pseudomonas aeruginosa and dual-species biofilms of P. aeruginosa and Escherichia coli under nutritional gradients in a microfluidic flow cell. We provide detailed protocols for creating nutrient gradients within the flow cell and for growing and visualizing biofilm development under these conditions. We also present protocols for a series of optical methods to quantify spatial patterns in biofilm structure, flow distributions over biofilms, and mass transport around and within biofilm colonies. These methods support comprehensive investigations of the co-development of biofilm and habitat heterogeneity.
Keywords: Bioengineering, Issue 97, microfluidic flow cell, chemical gradient, biofilm development, particle tracking, flow characterization, fluorescent tracer, solute transport
Introduction
Microorganisms attach to surfaces and form biofilms — cell aggregates enclosed in an extracellular-polymer matrix1. Biofilms behave very differently from individual microbial cells, because biofilms have dramatic spatial heterogeneity resulting from a combination of internal solute transport limitations and spatial variations in cellular metabolism2,3. Oxygen and nutrient concentrations drastically decrease at the interface between biofilm and surrounding fluid and get further depleted within in the biofilm2. Spatial variations in biofilm respiration and protein synthesis can also occur as a response to localized oxygen and nutrient availability2.
In aquatic and soil environments, most bacteria dwell in biofilms. Natural biofilms carry out important biogeochemical processes including cycling carbon and nitrogen and reducing metals4,5. Clinically, biofilm formation is responsible for prolonged pulmonary and urinary infections6. Biofilm-associated infections are highly problematic because cells in biofilms have extremely high resistance to antimicrobials compared to their planktonic counterparts6. Because biofilms are important in diverse settings, a substantial amount of research has been focused on understanding the environmental factors that control biofilm activities and the spatial heterogeneity in biofilms and the surrounding microenvironment.
Previous studies have found that biofilm development is strongly regulated by a number of environmental factors: biofilms develop different morphologies under various flow conditions; oxygen and nutrient availability influence biofilm morphology; and hydrodynamic shear stress affects the attachment of planktonic cells to surfaces and the detachment of cells from biofilms7-9. Furthermore, external flow condition influences the delivery of substrates into and within biofilms10. The growth of biofilms also alters surrounding physical and chemical conditions. For example, biofilm growth leads to local depletion of oxygen and nutrients2; biofilms accumulate inorganic and organic compounds from the surrounding environment11; and biofilm clusters divert flow and increase surface friction12,13. Because biofilms interact with their surrounding environment in very complex ways, it is critical to simultaneously obtain information on biofilm properties and environmental conditions, and multi-disciplinary approaches need to be used to comprehensively characterize biofilm-environment interactions.
Here we present a series of integrated methods to characterize spatial patterns in microbial growth within mono-species and dual-species biofilms under an imposed nutritional gradient, and to observe the resulting modification of the local chemical and fluid microenvironment. We first describe the use of a recently developed double-inlet microfluidic flow cell to observe biofilm growth under well-defined chemical gradients. We then demonstrate the use of this microfluidic flow cell to observe the growth of two species of bacteria, Pseudomonas aeruginosa and Escherichia coli, in biofilms under a range of nutritional conditions. We show how in situ visualization of fluorescent tracer propagation into biofilm colonies can be used to quantitatively assess patterns of solute transport in biofilms. Finally, we show how microscale particle tracking velocimetry, performed under confocal microscopy, can be used to obtain local flow field around the growing biofilms.
Protocol
1. Flow Cell Setup and Inoculation
NOTE: Use a double-inlet microfluidic flow cell described in Song et al., 201414 to grow biofilms. This flow cell is able to create well-defined smooth chemical gradients. The flow cell design is shown in Figure 1 and flow cell fabrication was previously described in Song et al., 201414. Here we detail our methods by using P. aeruginosa and E. coli to form biofilms, but other species may be suitable too. We used P. aeruginosa PAO1-gfp, which constitutively expresses a green fluorescent protein (GFP), as a model organism for biofilm development. Additionally, we used E. coli DH5α to form mixed-species biofilms with P. aeruginosa. P. aeruginosa and E. coli strains were grown on LB agar plates.
Prepare the flow cell using polydimethylsiloxane (PDMS) bound to a glass coverslip via oxygen plasma treatment as described in14. The dimensions of the flow cell chamber are 23 mm × 13 mm × 0.24 mm (length × width × depth).
Prepare modified FAB growth medium15. To observe biofilm growth under a nutritional gradient within the flow cell, introduce modified FAB medium15 with 0.6 μM glucose in one inlet and introduce FAB medium without any carbon source through the other inlet. Filter-sterilize (pore size = 0.2 μm) the glucose stock solution (60 mM) before adding it to the FAB medium. Also autoclave the FAB medium with cycle 1 (liquid, 15 min; 121 °C, 17 psi) before use.
Sterilize the flow system. Prior to inoculation, autoclave the entire flow path (medium bottles, tubing, bubble traps, flow cells) using cycle 1, except for the plastic three-way valves (disposable and pre-sterilized) located upstream of the flow cell. (Three-ways valves are used for injecting cell culture, fluorescent tracer and microbeads.) To avoid contamination during assembly, cover all the tubing and connector openings with aluminum foil or autoclave bags before autoclaving.
Connect the flow system. Assemble the components of the flow cell system carefully (see video for flow system assembly) and deliver growth medium to the flow cell via a peristaltic pump that precisely controls the flow rate.
Prepare cell culture for inoculation by transferring a colony of P. aeruginosa or E. coli from LB plates to 3 ml of LB broth and shake the culture O/N at 225 rpm and 37 °C. Dilute the O/N cell cultures in 1 ml sterilized water to a final OD600 = 0.01 as the inoculum. (Culture and dilute the bacteria in a laminar flow hood to avoid contamination.)
For the experiments with mixed-species biofilms, dilute the two bacterial cultures to a ratio of 1:1 in 1 ml with an equivalent OD600 = 0.01 for each bacterium.
Inoculate the flow cell. Inject 1 ml of the inoculum to the flow cell inlet from the three-way valve. After the injection, pause the flow for 1 hr to allow bacterial cells to attach to the cover glass. (Make sure that the flow cell is placed with the coverslip side down to allow suspended cells to settle onto the coverslip.)
After 1 hr, resume the flow and pump the growth medium to the flow cell at a constant rate of 0.03 ml/min for each inlet for 3 days.
2. Characterizing Biofilm Development in Response to Nutrient Gradients Using Confocal Microscopy
NOTE: P. aeruginosa can be imaged with constitutively-expressed GFP, but E. coli in mixed-species biofilms must be imaged by counterstaining.
Observe the 3-day biofilms using confocal microscopy. For the representative results, observe biofilms using a confocal microscope with a 63X objective. Prior to imaging, mark the double-inlet flow cell with a grid on the cover glass side. (The purpose of this grid is to allow the experimenter to locate the imaging regions within the flow cell chamber.)
To counterstain, dilute 10 μl of cell-permeant red fluorescent nucleic acid stain, such as green fluorescent nucleic acid stain such as STYO 62, stock solution (1 mM) in 990 μl sterilized water and then slowly inject the diluted stain using a syringe into the flow cell chamber from the upstream three-way valve. Keep the flow cell stagnant and in the dark for 30 min, then resume the flow to wash out the unbound stain for 15 min.
Perform confocal imaging. Activate the 488 nm Argon laser for excitation and the emission collecting channels for GFP (500-535 nm) and nucleic acid stain (for green fluorescent nucleic acid stain, 650-750 nm). Adjust gains and offsets for both channels to have bright and clean images. Select xyz and simultaneous imaging mode. Use the z-control knob to identify the bottom and top of the biofilm in the field. Set the z-step to 0.5 μm for acquiring a 3-D image stack. (To ensure high image quality, use a line average of four for image acquisition.)
To map the spatial patterns of biofilm development within the flow cell, image biofilms at three or more longitudinal (x) distances along the flow cell inlet, and at three transverse (y) positions relative to the imposed nutritional gradient, as shown in Figure 1.
3. Characterizing Internal Solute Transport by Injections of Conservative Fluorescent Tracer
NOTE: A conservative fluorescent tracer, such as Cy5, can be used to characterize solute transport patterns within the biofilm.
Dissolve Cy5 (Mono-Reactive NHS Ester) in water to a final concentration of 10 mg/ml as a stock solution. Store the Cy5 stock solution in a -20 °C freezer. NOTE: As Cy5 is light-sensitive, store, dilute and inject Cy5 solutions in the dark.
Prior to the injections of the fluorescent tracer, take a 3-D image stack of the 3-day biofilm with confocal microscopy (with a 63X objective). (Wide regions of biofilm colonies are ideal for time-series observations of dye transport.) Also choose a z-plane with well-separated colonies for imaging (as shown in Figure 5A).
For each Cy5 injection experiment, dilute 2 μl of the Cy5 stock solution in 998 μl sterilized water to yield an injection solution having a Cy5 concentration of 20 μg/ml.
Stop the pump to pause the flow and inject the Cy5 solution into the upstream of the flow cell using a syringe via the 3-way valve. (It is important to prevent air bubbles from entering the flow path while injecting. Bubble traps should be kept open during the back injection.)
After injecting the Cy5 solution, close the bubble traps, adjust the 3-way valve, and restart the pump to deliver the injected Cy5 solution into the flow cell.
Switch confocal imaging mode to xyt. Activate Cy5 and GFP channels under simultaneous imaging mode. Adjust confocal settings on Cy5 intensity (laser intensity, gain and offset) to avoid saturating signals, which is critical for quantification. (High temporal resolution is preferred for visualizing dye penetration. However, fast scanning decreases image quality.) Choose proper scanning speed and line average to balance the time resolution of imaging and the image quality. For this protocol use a line average of four and a frame rate of 0.15 Hz.
Resume the flow to deliver Cy5 into the flow cell (still at a flow rate of 0.03 ml/min). Simultaneously start time-series confocal imaging.
- Quantify Cy5 penetration by radially averaging Cy5 intensity within a 2-D circular biofilm colony. To average, first identify the edge of a biofilm cluster, then generate a distance map for a 2-D section of the cluster, and finally average radial patterns of Cy5 intensities to generate a penetration curve (see Figure 6).
- To computationally realize step 3.8, use BioSPA (Biofilm Spatial Pattern Analysis) software package (unpublished, software package and manual available upon request) or other image analysis programs.
- To use BioSPA, first import an image set into BioSPA. Then select proper threshold for GFP and Cy5 channels to make binary images. In the analysis/calculation menu, select Advanced Analysis and then Diffusion Analysis. Use the GFP channel to define the edge of a cluster and use the polygon tool to select one cluster as the region of interest (ROI).
- Double click the selected biofilm cluster to perform diffusion analysis. Save the diffusion analysis results and calibrate Cy5 intensity to Cy5 concentration using a calibration curve.
- To generate Cy5 concentration calibration curve, measure Cy5 intensities over a Cy5 concentration gradient under confocal microscopy. (Cy5 intensity and concentration have a linear relationship.)
4. Characterizing the Surrounding Flow Field by Tracking Fluorescent Particles
NOTE: Fluorescent particles, such as fluorescent microbeads, can be used to characterize the flow field around biofilms. Flow field around biofilms can be calculated from the time-series observations of particle positions using particle tracking velocimetry software. The results shown here were obtained with the Streams 2.02 software package16 (software download and user’s guide available at http://www.civil.canterbury.ac.nz/streams.shtml).
Dilute the fluorescent microbeads (diameter ~1 μm) in sterilized water to a final solid concentration of 0.2% and a final volume of 0.5 ml. Vortex to make sure that the microbeads are well dispersed.
Inject and deliver the diluted fluorescent microbeads into the flow cell following procedures from steps 3.3 to 3.5. To allow an accurate tracking of the particle path, use a relatively low flow rate (0.01 ml/hr for the particle tracking results in this paper).
Switch confocal settings to xyt mode to track particle movement at one z-slice and take time-series images. (A frame rate of 1 Hz was used for the representative results shown in this paper.) Repeat particle injection and image at different z locations to generate 3-D flow field.
Pre-process the time-series confocal images by subtracting the background fluorescence signal (the signal in the first acquired image of the image set) using ImageJ (software download and manual available on http://imagej.nih.gov/ij/) or other programs.
In ImageJ, open the first image of an image set and then import the image set. Under Process / Image Calculator, subtract the first image from the image set. Save the pre-processed image set.
To calculate flow vectors, import time-series confocal images in Streams 2.02. Under “Open process view”, select and execute “Identify particles”. Use proper threshold to identify particles. Use 0.5 and 5 μm as minimum and maximum diameter thresholds for 1 μm particles.
Then under “Open process view”, select and execute “PTV analysis pipeline” to generate particle paths. Check the particle paths to see if they represent particle movement. Finally, select and execute “Create velocity field” to generate a flow vector map.
Representative Results
The double-inlet microfluidic flow cell allows observation of biofilm growth under a well-defined chemical gradient formed by mixing of two solutions within the flow chamber. The resulting chemical gradient was formerly observed by dye injection and characterized in detail by Song et al.14. Smooth concentration gradients were formed in the transverse direction, as shown in Figure 1. The concentration profile was steep near the inlet and got relaxed downstream due to diffusion (Figure 1). To observe biofilm development under a nutritional gradient, we used a defined minimal growth medium (FAB medium) with glucose added only to one inlet as the sole carbon source. This yielded a glucose gradient in the flow cell chamber while all other nutrients were homogeneously distributed. The growth of P. aeruginosa PAO1 biofilms was strongly correlated to the local delivery of glucose (Figure 2). As the transverse glucose concentration gradient was steep near the inlet, the biofilm biomass showed a dramatic decrease from high-glucose region to the low-glucose region. As the transverse glucose gradient relaxed downstream, the biofilm biomass became more homogeneous. We further demonstrated the use of this flow cell to study the interactions of P. aeruginosa and E. coli in biofilms under a glucose gradient (Figure 3). The results showed that these two species showed distinct spatial patterns in growth relative to the nutritional gradient, and therefore occupied distinct ecological niches: P. aeruginosa dominated biofilm biomass in regions with high glucose concentrations and E. coli dominated in regions with low glucose concentrations (Figure 3).
To understand the feedback between biofilm growth and the surrounding flow environment, we characterized the flow field around growing biofilms by fluorescent particle tracking velocimetry under confocal microscopy. The observed movement of the injected fluorescent microbeads is shown in Movie 1. Local flow vector information was extracted from an average of at least 4,200 discrete measurements of particle velocities using the Streams software package. Three-dimensional mapping of the flow field was obtained by tracking particles at multiple vertical positions (Figure 4). Biofilm growth significantly increased flow heterogeneity (Figure 4). Flow near biofilm base diverted around biofilm clusters, leading to increased heterogeneity and decreased velocity (Figure 4). Flow at biofilm top has higher velocity and is more homogeneous (Figure 4).
To understand the internal heterogeneity caused by limited solute transport within biofilms, we observed the transport of Cy5 within biofilms by confocal microscopy. Time-series penetration of Cy5 into a biofilm cluster is shown in Movie 2. The time-series Cy5 penetration curves is shown in Movie 3. The effective diffusion coefficient of Cy5 in biofilms was calculated by fitting a 1-D diffusion model to the Cy5 concentration profiles:
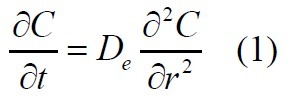
where C is the radially-averaged Cy5 concentration calculated from the fluorescence intensity, and is the distance into the biofilm17. Cy5 showed the highest concentration in the bulk flow and decreased steeply upon entering the biofilm (Figure 5).
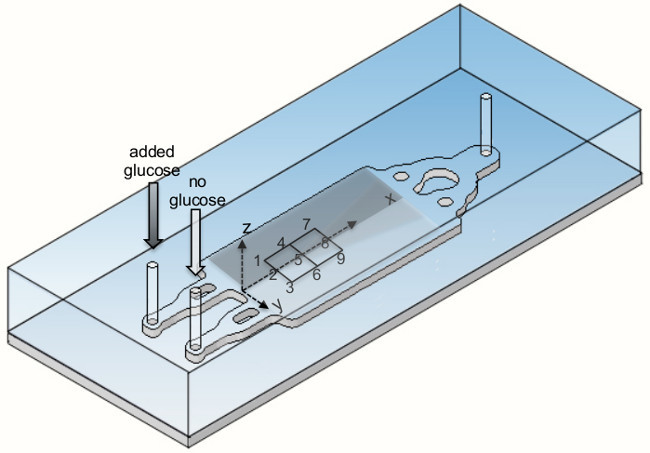 Figure 1. Double-inlet microfluidic flow cell. Smooth glucose gradients were created within the flow chamber by introducing FAB medium to the two inlets with a carbon source (glucose) provided only in one inlet. Resulting patterns of glucose within the flow cell are indicated by shading. Dark shading represents higher glucose concentrations. Confocal imaging was performed at nine locations in the flow cell. Results presented in Figures 2 and 3 refer to the locations numbered 1-9 in the figure. This figure is modified after Song et al. (2014), Fig. 1. Please click here to view a larger version of this figure.
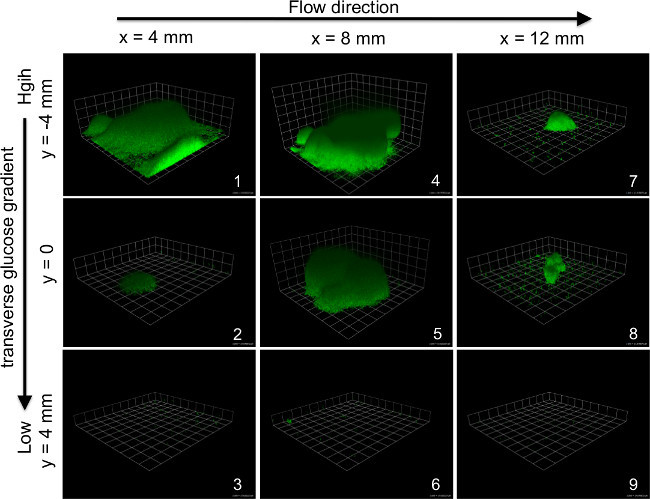 Figure 2. PAO1 biofilm growth under glucose gradients. 3-day PAO1 biofilms were imaged at the 9 locations shown in Figure 1. Grid spacing = 18 μm for image 1-8 and 24 μm for image 9. Please click here to view a larger version of this figure.
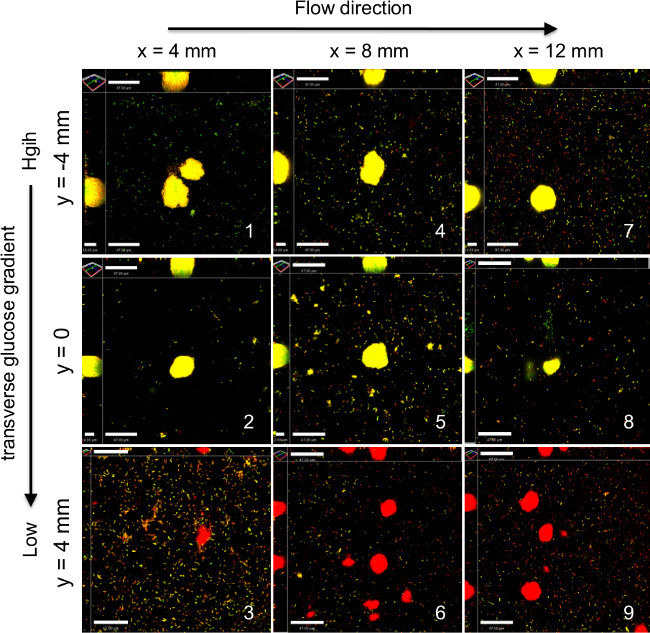 Figure 3. The development of P. aeruginosa and E. coli dual-species biofilms under glucose gradients.P. aeruginosa constitutively expresses GFP, and the biofilms were also counterstained by SYTO 62, which is a general nucleic acid stain. Images shown here are overlays of GFP (green) and SYTO 62 (red) channels. P. aeruginosa therefore appears green or yellow (green + red), and E. coli appears red. Scale bars = 47 μm. Please click here to view a larger version of this figure.
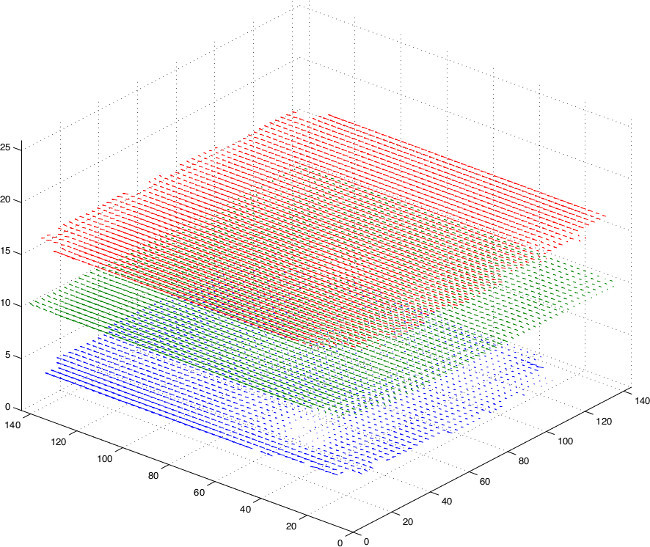 Figure 4. Flow velocity vector fields at z = 4, 10 and 16 μm around a biofilm cluster. The length of the arrow represents the magnitude of the velocity. Low flow velocity shows at biofilm base (z=4, blue arrows). Flow is more homogeneous near biofilm top (z=16, red arrows). Please click here to view a larger version of this figure.
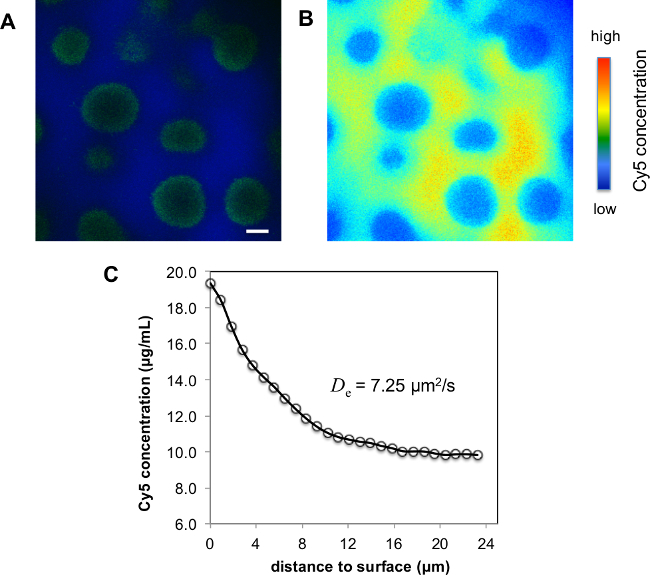 Figure 5. Cy5 penetration into biofilms. (A) Confocal micrograph at z = 18 μm showing partial penetration of Cy5 into biofilm clusters at t = 190 sec. Scale bars = 10 μm. (B) Resulting patterns of Cy5 concentration map. (C) Cy5 concentration profile in one biofilm cluster. Please click here to view a larger version of this figure.
 Figure 6. Procedures to generate a Cy5 penetration profile. Left: Selected ROI containing a 2-D biofilm cluster. Middle: Distance map of the biofilm cluster. Right: Radially-averaged Cy5 intensity profile. Please click here to view a larger version of the figure.
Movie 1: Motion of injected fluorescent particles around biofilm clusters (confocal video).
Movie 2: Propagation of Cy5 into biofilm clusters (confocal video).
Movie 3: Propagation of Cy5 into biofilm clusters (concentration profiles video).
Discussion
We demonstrated a suite of methods to characterize three important biofilm-environment interactions: biofilm response to chemical gradients, effects of biofilm growth on the surrounding flow microenvironment, and biofilm heterogeneity resulting from internal transport limitations.
We first showed the use of a novel microfluidic flow cell to impose a well-defined chemical gradient for biofilm development. To generate a well-defined chemical gradient within the flow cell, it is important to maintain the same flow rate for both inlets. Make sure that the peristaltic pump is well adjusted for both flow channels to deliver the grow medium at the same rate. Also make sure there is no clogging in the flow path during biofilm growth. Observations of the growth of dual-species biofilms in this flow cell show that chemical gradients greatly affected biofilm growth and inter-species interactions within biofilms. Chemical gradients are common in environments where biofilms grow, owing to a combination of transport limitations, chemical binding and reactions, and microbial uptake and metabolism18-20. This microfluidic flow cell enables investigations of diverse biofilm activities under a defined range of chemical conditions within a single device. For example, this flow cell has been demonstrated to be useful for the study of biofilm killing under an antimicrobial gradient14.
We then demonstrated the use of particle tracking velocimetry to observe the flow field around biofilm clusters. To ensure an accurate tracking of the injected fluorescent particles, the flow rate needs to be optimized. Usually, low flow rate allows the motion of particles to be captured in confocal field of view. Also the scanning frame rate needs to be optimized to balance image quality and time resolution. If the particles move too fast for capturing the movement, use lower line or frame average or increase scanning speed. We mapped the flow field at three vertical positions over a biofilm cluster, and found that biofilm growth increased the flow heterogeneity. Characterizing the flow field around biofilms allows key flow-biofilm interactions to be explored. For example, this can be used to evaluate mechanisms that regulate fluid drag and shear over the biofilm, and the resulting biofilm failure and detachment of cells from the surface1,21. These processes are important to understanding both the effects of biofilms on flow systems (e.g., biofouling) and regulation of biofilm morphology8. Flow conditions around biofilms also control mass transport, which is important to a wide range of biofilm processes. For example, the local fluid velocity at the biofilm surface influences the delivery of nutrients and substrates to biofilms through advection22.
Finally, we showed the use of injecting fluorescent tracers to analyze solute transport patterns within the biofilm. We used Cy5 here as a conservative tracer, and this fluor appears to often behave conservatively in biofilms23. Therefore the results should be representative of the transport patterns of non-reactive, neutral solutes in biofilms. The results showed a steep decrease of Cy5 concentration near the biofilm surface, yielding a Cy5 concentration in the interior of the biofilm only ~50% of the concentration in the bulk flow. Such steep concentration profiles are consistent with previously reported measurements of oxygen, nutrients and antimicrobials within biofilms2,24. Cy5 penetration curves provide information on solute diffusion in biofilm clusters. However, the method we present here is limited to analyze 2-D solute transport in horizontal (xy) planes in biofilms. With newer fast-imaging capability, for example spinning disk confocal microscopy, dye penetration can also be visualized in 3-D within biofilms, which will allow an investigation on vertical transport processes. Furthermore, fluorescent tracer and particles can be injected together to obtain information of external flow conditions and internal solute transport at the same time. Such information is useful to differentiate advective and diffusive solute transport among bulk flow and biofilms and to assess the effect of external flow on internal solute transport in biofilms.
Overall, we present detailed protocols of using a novel microfluidic flow cell that provides well-defined chemical gradients for the study of biofilm responses to chemical cues in the environment. To better characterize heterogeneity in biofilms and their surrounding microhabitat, we present here methods to characterize patterns in both the flow field surrounding biofilms and internal solute transport within biofilms. Each method provides distinctive information on biofilm properties and/or environmental conditions. Since these methods are integrated, multiple aspects of information can be obtained simultaneously. Combined information enables researchers to approach more complex problems. For example, by using these methods, we successfully analyzed biofilm development and interspecies interactions in biofilms under a nutrient gradient. These methods also provide experimental capability to increase the complexity in the microbial community and the chemical environment, which allows investigations on biofilm processes in a more realistic context. Potential applications of these methods cover diverse aspects of biofilm research, including biofilm life cycle, multispecies biofilms, biofilm heterogeneity, transport processes in biofilms, and biofilm-flow interplay.
Disclosures
The authors have nothing to disclose.
Acknowledgments
We thank Matt Parsek at the University of Washington (Seattle, WA) for providing P. aeruginosa and E. coli strains and Roger Nokes at the University of Canterbury (New Zealand) for providing access to Streams software. This work was supported by grant R01AI081983 from the National Institutes of Health, National Institute of Allergy and Infectious Diseases. Confocal imaging was performed at the Northwestern Biological Imaging Facility (BIF).
References
- Hall-Stoodley L, Costerton JW, Stoodley P. Bacterial biofilms: From the natural environment to infectious diseases. Nat Rev Microbiol. 2004;2(2):95–108. doi: 10.1038/nrmicro821. [DOI] [PubMed] [Google Scholar]
- Stewart PS, Franklin MJ. Physiological heterogeneity in biofilms. Nat Rev Microbiol. 2008;6(3):199–210. doi: 10.1038/nrmicro1838. [DOI] [PubMed] [Google Scholar]
- Xu KD, Stewart PS, Xia F, Huang CT, McFeters GA. Spatial physiological heterogeneity in Pseudomonas aeruginosa biofilm is determined by oxygen availability. Appl Environ Microb. 1998;64(10):4035–4039. doi: 10.1128/aem.64.10.4035-4039.1998. [DOI] [PMC free article] [PubMed] [Google Scholar]
- Costerton JW, et al. Bacterial Biofilms in Nature and Disease. Annu Rev Microbiol. 1987;41:435–464. doi: 10.1146/annurev.mi.41.100187.002251. [DOI] [PubMed] [Google Scholar]
- Battin TJ, Kaplan LA, Newbold JD, Hansen CME. Contributions of microbial biofilms to ecosystem processes in stream mesocosms. Nature. 2003;426(6965):439–442. doi: 10.1038/nature02152. [DOI] [PubMed] [Google Scholar]
- Costerton JW, Stewart PS, Greenberg EP. Bacterial biofilms: A common cause of persistent infections. Science. 1999;284(5418):1318–1322. doi: 10.1126/science.284.5418.1318. [DOI] [PubMed] [Google Scholar]
- Stoodley P, Dodds I, Boyle JD, Lappin-Scott HM. Influence of hydrodynamics and nutrients on biofilm structure. J Appl Microbiol. 1999;85(1):19S–28S. doi: 10.1111/j.1365-2672.1998.tb05279.x. [DOI] [PubMed] [Google Scholar]
- Stoodley P, Lewandowski Z, Boyle JD, Lappin-Scott HM. Structural deformation of bacterial biofilms caused by short-term fluctuations in fluid shear: An in situ investigation of biofilm rheology. Biotechnol Bioeng. 1999;65(1):83–92. [PubMed] [Google Scholar]
- Wasche S, Horn H, Hempel DC. Influence of growth conditions on biofilm development and mass transfer at the bulk/biofilm interface. Water Res. 2002;36(19):4775–4784. doi: 10.1016/s0043-1354(02)00215-4. [DOI] [PubMed] [Google Scholar]
- Stewart PS. Mini-review: Convection around biofilms. Biofouling: The Journal of Bioadhesion and Biofilm Research. 2012;28(2):187–198. doi: 10.1080/08927014.2012.662641. [DOI] [PubMed] [Google Scholar]
- Flemming HC. Sorption sites in biofilms. Water Sci Technol. 1995;32(8):27–33. [Google Scholar]
- Debeer D, Stoodley P, Lewandowski Z. Liquid Flow in Heterogeneous Biofilms. Biotechnol Bioeng. 1994;44(5):636–641. doi: 10.1002/bit.260440510. [DOI] [PubMed] [Google Scholar]
- Schultz MP, Swain GW. The effect of biofilms on turbulent boundary layers. J Fluid Eng-T Asme. 1999;121(1):44–51. [Google Scholar]
- Song JSL, Au KH, Huynh KT, Packman AI. Biofilm Responses to Smooth Flow Fields and Chemical Gradients in Novel Microfluidic Flow Cells. Biotechnol Bioeng. 2014;111(3):597–607. doi: 10.1002/bit.25107. [DOI] [PMC free article] [PubMed] [Google Scholar]
- Shrout JD, et al. The impact of quorum sensing and swarming motility on Pseudomonas aeruginosa biofilm formation is nutritionally conditional. Mol Microbiol. 2006;62(5):1264–1277. doi: 10.1111/j.1365-2958.2006.05421.x. [DOI] [PubMed] [Google Scholar]
- Maxworthy T, Nokes RI. Experiments on gravity currents propagating down slopes. Part 1. The release of a fixed volume of heavy fluid from an enclosed lock into an open channel. J Fluid Mech. 2007;584:433–453. [Google Scholar]
- Stewart PS. A review of experimental measurements of effective diffusive permeabilities and effective diffusion coefficients in biofilms. Biotechnol Bioeng. 1998;59(3):261–272. doi: 10.1002/(sici)1097-0290(19980805)59:3<261::aid-bit1>3.0.co;2-9. [DOI] [PubMed] [Google Scholar]
- Schramm A, De Beer D, Gieseke A, Amann R. Microenvironments and distribution of nitrifying bacteria in a membrane-bound biofilm. Environ Microbiol. 2000;2(6):680–686. doi: 10.1046/j.1462-2920.2000.00150.x. [DOI] [PubMed] [Google Scholar]
- Santegoeds CM, Schramm A, de Beer D. Microsensors as a tool to determine chemical microgradients and bacterial activity in wastewater biofilms and flocs. Biodegradation. 1998;9(3-4):159–168. doi: 10.1023/a:1008302622946. [DOI] [PubMed] [Google Scholar]
- Debeer D, Stoodley P, Roe F, Lewandowski Z. Effects of Biofilm Structures on Oxygen Distribution and Mass-Transport. Biotechnol Bioeng. 1994;43(11):1131–1138. doi: 10.1002/bit.260431118. [DOI] [PubMed] [Google Scholar]
- Liu Y, Tay JH. The essential role of hydrodynamic shear force in the formation of biofilm and granular sludge. Water Res. 2002;36(7):1653–1665. doi: 10.1016/s0043-1354(01)00379-7. [DOI] [PubMed] [Google Scholar]
- Zhang W, et al. A Novel Planar Flow Cell for Studies of Biofilm Heterogeneity and Flow-Biofilm Interactions. Biotechnol Bioeng. 2011;108(11):2571–2582. doi: 10.1002/bit.23234. [DOI] [PMC free article] [PubMed] [Google Scholar]
- Tseng BS, et al. The extracellular matrix protects Pseudomonas aeruginosa biofilms by limiting the penetration of tobramycin. Environ Microbiol. 2013;15(10):2865–2878. doi: 10.1111/1462-2920.12155. [DOI] [PMC free article] [PubMed] [Google Scholar]
- Debeer D, Srinivasan R, Stewart PS. Direct Measurement of Chlorine Penetration into Biofilms during Disinfection. Appl Environ Microb. 1994;60(12):4339–4344. doi: 10.1128/aem.60.12.4339-4344.1994. [DOI] [PMC free article] [PubMed] [Google Scholar]


