Abstract
Described in this report is a qRT-PCR assay for the analysis of seventeen human IFN subtypes in a 384-well plate format that incorporates highly specific locked nucleic acid (LNA) and molecular beacon (MB) probes, transcript standards, automated multichannel pipetting, and plate drying. Determining expression among the type I interferons (IFN), especially the twelve IFN-α subtypes, is limited by their shared sequence identity; likewise, the sequences of the type III IFN, especially IFN-λ2 and -λ3, are highly similar. This assay provides a reliable, reproducible, and relatively inexpensive means to analyze the expression of the seventeen interferon subtype transcripts.
Keywords: Immunology, Issue 97, Interferon, Innate Immunity, qRT-PCR Assay, Probes, Primers, Automated Pipetting
Introduction
Types I and III interferons (IFN) are critical in the immune response to viruses and other pathogenic stimuli and present in all vertebrates1. Immune and non-immune cells express and secrete, as well as respond to, IFN2. Innate immune sensors, such as toll-like receptors (TLR), STING, and RIG-I, induce type I and III IFN expression upon detection of pathogen associated molecular patterns (PAMP)3,4. In humans, type I IFN include IFN-β, -ω, -κ, and 12 subtypes of IFN-α, and bind to the IFNAR1/IFNAR2 receptor complex2,5. Type III IFN include IFN-λ1, -λ2, and -λ3 and bind to the IL10RB/IL28RA receptor complex2. Classically, types I and III IFN bind to their respective receptor complexes which then recruit STAT1/STAT2 heterodimers and initiate transcription of interferon stimulated genes (ISG)6. ISG are involved in a diverse range of functions, from antiviral and antiproliferative activity to activation of the adaptive immune response7.
The numerous mechanisms pathogens have evolved to evade, subvert, and hijack elements of the IFN signaling pathway demonstrate the importance of IFN in the innate immune response8. For example, vaccinia virus expresses a decoy receptor with IFNAR1 homology that sequesters type I IFN9 while a Yaba-like disease virus secretes a glycoprotein that inhibits type I and III IFN proteins10. In addition to their role in host defense, IFN are also implicated in cancer surveillance and a number of auto-inflammatory diseases: silencing of IFN expression in breast cancer cells restricts immunosurveillance11, overproduction of IFN-α is a mechanism in the development of systemic lupus erythematosus12, and errant activation of STING leads to systemic inflammation caused by excessive amounts of IFN in STING-associated vasculopathy13. Therapeutically, IFN are used to treat multiple sclerosis14, chronic viral infections such as HBV15 and HCV16,17, and cancers such as hairy cell leukemia18 and chronic myelogenous leukemia19. Questions about the relevance of IFN in a particular physiological process continuously reveal the ubiquitous nature of this cytokine family.
Type I IFN, especially the IFN-α subtypes, are often considered as one entity20-23, rather than as a group of closely related, but distinct, proteins. The existence and persistence of multiple IFN species including the IFN-α subtypes, throughout vertebrate evolution24 suggests that at least a subset of these subtypes have specific or unique functions. It is possible that defining patterns of IFN expression will decipher and help characterize the specific functions of one or more of the subtypes17. The challenge of studying the type I and III IFN subtypes is based on their shared sequence identity: the twelve IFN-α subtypes share >50%25 and the IFN-λ subtypes share 81-96%26 of their amino acid sequences. In the described qRT-PCR assay, molecular beacon (MB) and locked nucleic acid (LNA) fluorescent probes discriminate single base pair differences between the highly similar IFN subtype sequences and allow for the characterization of the IFN expression signature. The assay’s 384-well plate format includes both quantitative (transcript standards) and semi-quantitative (the housekeeping genes (HKG)) measures, allowing for analysis by transcript copy number and ∆Cq respectively. Batch assembly, facilitated by automated multichannel pipetting, and long term storage, possible through drying the primer/probe (Pr/Pb) sets on the plates, enhance the reproducibility, utility, and practicality of the assay.
This protocol describes the process for preparing 384-well qRT-PCR assay plates (Figure 1) with up to seventeen different Pr/Pb sets targeting human IFN subtypes (Table 1). Pr/Pb set working stock source plates (Figure 2) are used to prepare multiple 384-well assay plates in a process that can be automated using a robotic multichannel pipettor. While the initial focus was on creating a protocol for studying human IFN expression signatures, this method has been applied to rhesus macaques as well. Though the plate layouts are slightly different and the Pr/Pb sets (Table 2) are distinct, the overall preparation method for creating the human and rhesus plates is identical. With minimal modifications of the protocol, the method could be executed to allow for the development of assays to study other groups of closely related genes.
See Figures 1 and 2 Below
See Tables 1 and 2 Below
Protocol
1. Preparation of Standard Serial Dilutions (Figure 3A)
NOTE: Serial dilution series of linearized plasmids containing the sequences targeted by a Pr/Pb set are used as quantitative standards for the qRT-PCR assay. Each standard serial dilution set for the IFN subtypes contains enough volume to run 90 assay plates. The four points of the standard dilution curve used for the assay are selected to cover Ct values from a range of 20 to 32 (Table 3).
Thaw, vortex, and briefly centrifuge the standard (50 pM) and salmon sperm DNA (SSDNA, 10 mg/ml) stock solutions.
Prepare the SSDNA/water mix for the 17 standard dilution sets by mixing 51 µl of SSDNA with 20.3 ml of water.
Label one 8-tube PCR strip for a standard dilution set. NOTE: Preparation of the standard serial dilutions from the stock solutions will take 2-3 hr.
Dispense 190 µl of the SSDNA/water mix to the first tube in the strip and 180 µl of SSDNA/water mix to the five remaining tubes.
Perform a 1:20 dilution by transferring 10 µl from the 50 pM standard stock to the tube with 190 µl of the SSDNA/water, mix; vortex and quickly centrifuge the PCR strip.
Perform a 1:10 dilution by transferring 20 µl from the most recently diluted tube to the next tube in the series; vortex and quickly centrifuge the PCR strip.
Repeat step 1.6 until the last tube in the dilution series has received the standard.
Repeat steps 1.3-1.7 for each standard.
See Table 3 Below
2. Preparation of Primer/Probe (Pr/Pb) and No Template Control (NTC) Working Stock Mixes (Figure 3B)
NOTE: Each 1.7 ml Pr/Pb set working stock and 128.6 µl No Template Control (NTC) working stock mix will make 30 assay plates.
- Prepare the Pr/Pb set working stock mixes. NOTE: Preparation of the Pr/Pb set and NTC working stock mixes from the stock solutions will take 2-3 hr.
- Resuspend the primers and probes at 100 µM with ultra-pure water for preparation of stock solutions.
- Label up to seventeen 2 ml tubes; one for each Pr/Pb set included in the assay.
- Thaw, vortex, and briefly centrifuge the primers (100 µM), probes (100 µM), and SSDNA (10 mg/ml) stock solutions.
- Add 2 µl of SSDNA to every tube using the 12.5 µl electronic multichannel pipette. Add the appropriate forward primer, reverse primer, and probe to each Pr/Pb set working stock tube. See Table 1 for the Pr/Pb sets targeting human IFN subtypes and Table 2 for the rhesus macaque Pr/Pb sets. Add water to bring the volume of each Pr/Pb set working stock tube to 200 µl. NOTE: The volume of primers, probe, and water to add depends on the required final reaction concentration of a Pr/Pb set.
- Prepare the NTC working stock mixes.
- Label two 5-tube PCR strips for the NTC working stocks mixes.
- Transfer 14.3 µl of each Pr/Pb set to the appropriate NTC working stock mix tube. See Table 4 for the Pr/Pb set combinations for NTC wells. Add water to each of the NTC working stock mixes to bring the final volume to 128.6 µl.
- Vortex, briefly centrifuge, and place the tubes in the dark on ice or at -20 °C for long term storage.
See Table 4 Below
- Dilute the Pr/Pb set working stocks.
- Following the removal of an aliquot of the Pr/Pb sets required for the NTC working stock mixes, add 1.5 ml of water to bring the final volume of each Pr/Pb set working stock tube to 1.7 ml.
- Vortex, briefly centrifuge, and place the tubes in the dark on ice or at -20 °C for longer term storage.
3. Preparation of 384-well assay plates using the automated multichannel pipettor
- Prepare a 96-well source plate of the Pr/Pb sets and NTC mixes for aliquoting to 384-well assay plates. NOTE: Preparation of the source plate from the Pr/Pb workings stock mixes will take less than 1 hr. Each 96-well source plate is enough to make six 384-well assay plates (Figure 3C).
- Vortex and briefly centrifuge the Pr/Pb set working stocks and NTC working stock mixes.
- Place a new 96-well plate in a chilled 96-well cooling block and designate the wells for each Pr/Pb set or NTC mix the wells receive (see Figure 2).
- Add water to the 96-well plate using a 250 µl electronic multichannel pipette: Dispense 66 µl of water to every Pr/Pb set well (except the 4 wells for Target 17). Dispense 82.5 µl of water to the 4 Target 17 wells. Dispense 27.5 µl of water to every NTC mix well.
- Add the correct Pr/Pb set working stock to the designated wells of the 96-well plate: Dispense 54 µl of the correct Pr/Pb set working stock to the designated Pr/Pb set wells (except the 4 wells for Target 17). Dispense 67.5 µl of the Target 17 Pr/Pb set working stock to the designated Target 17 Pr/Pb set wells. Add 22.5 µl of the correct NTC working stock mix to the designated wells.
- Seal the 96-well plate with an adhesive plate seal and centrifuge for 1 min at 700 x g to ensure the contents are at the bottom of the wells.
- Place the 96-well plate in the vortex mixer using a 96-well plate adaptor and mix for 1 min at 1,000 rpm. Centrifuge the 96-well plate for 5 min at 700 x g.
- Store the 96-well source plate in the dark at 4 °C if using in the same day, otherwise store at -20 °C until use.
- Prepare the 384-well assay plates by adding the Pr/Pb sets using the automated multichannel pipettor. NOTE: Preparation of six assay plates from the 96-well source plate will take 3-4 hr.
- Prior to making plates, pre-chill the cooling nest to 4 °C and pre-heat the plate evaporator to 125 °C and the bottom heat block to 80 °C with airflow blowing between 20-25 liters per min (LPM).
- Switch on the automated multichannel pipettor and open the protocol for making IFN assay plates by double clicking the software icon.
- To setup the platform, place a completely full pipet tip box in platform position 1, the 96-well source plate in position 4, and a new 384-well plate in position 6. Begin the run by pressing the play button. NOTE: Upon completion of a run, each well will contain 5 µl of Pr/Pb mix. NOTE: The final amount of SSDNA added per well of the 384-well assay plate is 0.025 µg.
- Gently tap the 384-well assay plate on a flat surface to ensure fluids are at the bottom of the wells and apply an adhesive plate seal.
- Centrifuge the plate for 1 min at 700 x g. Remove the adhesive plate seal, place the 384-well assay plate into the plate dryer and position the 384-well manifold directly above the wells.
- When the 384-well assay plate’s contents dry, apply a new adhesive plate seal, wrap in foil, label, and store in the dark at 4 °C until use. NOTE: Plates can be stored at 4 °C for at least 6 months.
- Repeat steps 3.2.3-3.2.6 until 6 x 384-well assay plates are prepared or the liquid in the 96-well source plate is depleted.
- Turn off the cooling nest, close the software, and switch off the automated multichannel pipettor. Turn off the plate dryer.
4. Loading and Running a 384-well Assay Plate
- Prepare two housekeeping gene (HKG) well mixes, which consist of the Pr/Pb set for a HKG, SSDNA, PCR master mix, and water, to be added to a dried 384-well assay plate (Figure 3D). NOTE: Preparation of the mixes and loading the assay plate will take 1-2 hr. Running the assay plate will take less than 2 hr.
- Label a 1.5 ml tube for each HKG mix.
- Dilute 2 µl of SSDNA (10 mg/ml) with 84.9 µl water. Add 2 µl of the diluted SSDNA, 11.8 µl of water, 23 µl of master mix, and 9.2 µl of the correct 20x HKG Pr/Pr set to each tube, vortex, and briefly centrifuge.
- Use glyceraldehyde-3-phosphate dehydrogenase (GAPDH) and ubiquitin C (UBC) as the HKG for the human assay (see Materials Table). Use GAPDH and 18S ribosomal RNA as the HKG for the rhesus assay. NOTE: The HKG used to perform the assay are flexible and should reflect the genes appropriate for the cell type being tested. GAPDH, UBC, and 18S are examples of commonly used HKG; other HKG may be more appropriate.
- Prepare the sample and positive control well mixes, which consist of the sample or positive control cDNA, master mix, and water, to be added to a dried 384-well assay plate. Prepare the sample and the positive control mixes in enough quantity to dispense to 21 plate wells (Figure 3D).
- Prior to cDNA synthesis, follow the manufacturer’s instructions to prepare the RNA samples with a DNase digestion step.
- Prepare the samples and positive control in advance from the cDNA synthesis of at least 500 ng of RNA followed by treatment with RNase H (final volume of 24 µl for each sample) following the manufacturer’s instructions. Store the prepared cDNA at -20 °C until use. Thaw, vortex, and briefly centrifuge the sample cDNA.
- Add 78.8 µl of master mix and 54.8 µl of water to each 24 µl sample and positive control tube.
- Vortex and briefly centrifuge the tubes.
Prepare the standards and NTC well mixes, consisting of master mix and water, to be added to a dried 384-well assay plate (Figure 3D). For the standards well mix, add 165 µl of water to 275 µl of master mix in a 1.5 ml tube. For the NTC well mix, add 52.5 µl of water to 52.5 µl of master mix in a 1.5 ml tube. Vortex and briefly centrifuge the tubes.
- Prepare a dried 384-well assay plate for loading of the mixes and samples.
- Remove a dried 384-well assay plate from 4 °C and centrifuge for 1 min at 700 x g.
- Place the plate on a chilled 384-well cooling block, remove the adhesive plate seal and outline the wells of the plate to designate where the various mixes and samples will be pipetted (Figure 1).
- Load the 384-well assay plate with standard well mix, standards, NTC well mix, samples, positive control, and HKG mix (Figure 3E). Vortex and briefly centrifuge all solutions before dispensing to the plate.
- Dispense 6 µl of the standards well mix to each standard well with the 30 µl electronic multichannel pipette. Dispense 1.5 µl of the correct standard serial dilution to the designated well with the 12.5 µl electronic multichannel pipette.
- Dispense 7.5 µl of NTC well mix to each NTC well with the 30 µl electronic multichannel pipette. Dispense 7.5 µl of the sample to the designated wells with the 30 µl electronic multichannel pipette. Dispense 2.5 µl of the HKG Pr/Pb mixes to the designated wells with the 12.5 µl electronic multichannel pipette.
- Fill any empty wells with 7.5 µl of the leftover water and master mix mixture with the 30 µl electronic multichannel pipette; 7.5 µl of water alone will also work.
- Seal the 384-well assay plate with the optical adhesive film and centrifuge for 1 min at 700 x g. Vortex the sealed 384-well plate in the vortex mixer for 2 min at 2,600 rpm and centrifuge for 5 min at 700 x g.
- Place the sealed 384-well assay plate in the qRT-PCR machine, open the template for the assay layout and begin the run. NOTE: Results can be exported as a spreadsheet or as a text file for analysis.
- Use the following optimal thermal cycler reaction conditions for the assay: i) 50 °C for 2 min, ii) 95 °C for 10 min, iii) 95 °C for 25 s, iv) 59 °C for 1 min. Repeat steps iii and iv for 40 cycles.
- Export the raw data from the qRT-PCR platform into a spreadsheet application software. Plot each 4 point standard set as a standard curve to observe linearity. Perform analysis by calculating the ∆Cq or by copy number based on the four point standard curves27.
See Figure 3 Below
Representative Results
The qRT-PCR assay described can be implemented to analyze expression patterns of types I and III IFN in a variety of cell types and contexts. For example, human type I and III IFN expression signatures were analyzed in peripheral blood mononuclear cells (PBMC) from 6 donors stimulated with TLR ligands; poly I:C (25 μg/ml), LPS (10 ng/ml), imiquimod (10 μM), and CpG oligonucleotides (1 μM) (Figure 4). Data were analyzed using a spreadsheet application software and presented as radar charts with the IFN-α subtypes arranged clockwise according to the phylogenetic tree of their protein sequence27. The radar charts of human IFN expression are presented in a log scale calculated using the two different methods of analysis incorporated into the assay design: absolute Cq value normalized to HKG (ΔCq), and copy number of template per microgram (μg) of total RNA. Copy number values are calculated from the results of a transcript’s standard curve. The data shows that human IFN expression signatures elicited by TLR agonists are ligand specific.
See Figure 4 Below
As demonstrated for the human IFN expression signatures, expression signatures of types I and III IFN in rhesus macaques were also TLR ligand specific. PBMC from 3 donors were stimulated with poly I:C (50 μg/ml), LPS (10 μg/ml), and imiquimod (10 μg/ml) for 3 hr (Figure 5). IFN subtype expression in unstimulated cells at baseline was low. A limited number of IFN- subtypes were expressed in response to LPS and poly I:C. In contrast, IFN expression in response to imiquimod was high and the subtype expression was broad. Expression of IFN-β and IFN-λ1 was enhanced by all three TLR agonists28.
See Figure 5 Below
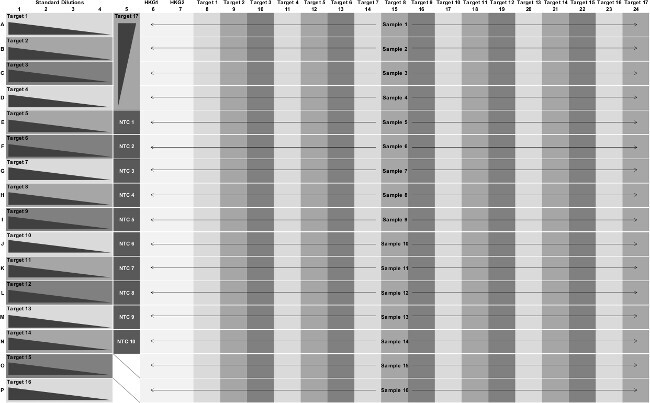 Figure 1: The layout for a 384-well assay plate with seventeen Pr/Pb sets. Target number refers to a Pr/Pb set. The four point standard curves (dark grey triangle) are added to columns 1-5. The HKG Pr/Pb sets (white background) are added to columns 6 and 7. The remaining columns, 8-24, are specific for one of the seventeen Pr/Pb sets. Samples are added to rows A-P, from columns 6-24 (black arrows). The two wells (O5, P5) at the bottom of column 5 receive only water and master mix. Please click here to view a larger version of this figure.
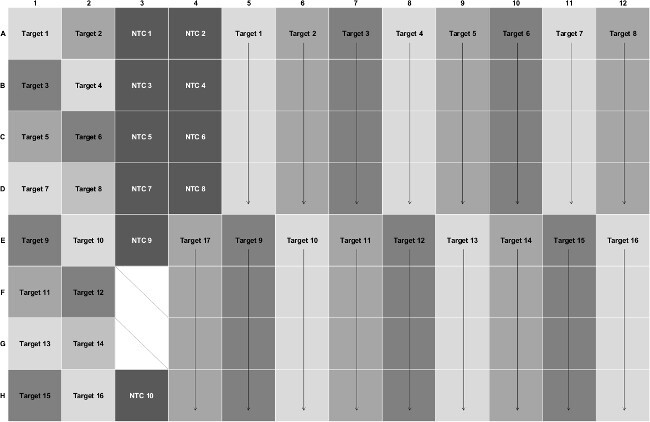 Figure 2: The layout for a 96-well source plate with seventeen Pr/Pb sets. Target number refers to a Pr/Pb set. Black arrows represent when a Pr/Pb set is added to multiple wells. NTC mixes are added to the designated wells (dark grey background). The two wells (F3, G3) with diagonal lines are unused. Please click here to view a larger version of this figure.
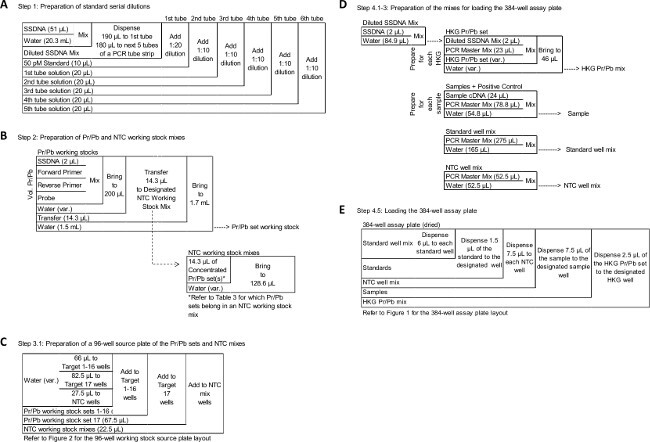 Figure 3: Schematic of specific steps in the qRT-PCR assay protocol. A-E diagram select portions of the protocol. (A) Step 1: Preparation of standard serial dilutions. (B) Step 2: Preparation of Pr/Pb and NTC working stock mixes. (C) Step 3.1: Preparation of a 96-well working stocks plate of the Pr/Pb sets and NTC mixes. (D) Step 4.1-3: Preparation of the mixes for loading the 384-well assay plate. (E) Step 4.5: Loading the 384-well assay plate. Diagrams are read from the top left to the bottom right corner. Reagents for the interferon (IFN) assay are stored at -20 oC and are listed in the left column; lines separate actions in the protocol. Please click here to view a larger version of this figure.
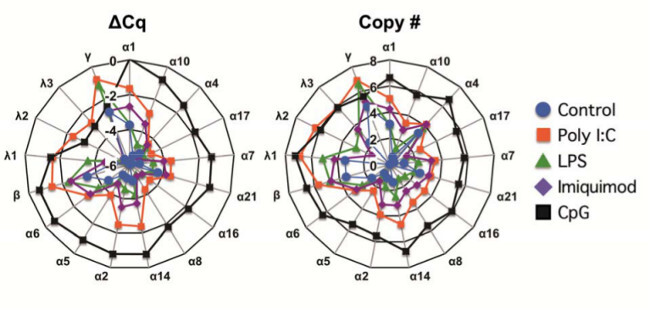 Figure 4: The human IFN expression signature in peripheral blood mononuclear cells (PBMC) differs in response to the TLR ligands used for stimulation. PBMC were stimulated with TLR ligands and RNA was harvested for qRT-PCR analysis. The geometric means of the peak responses to poly I:C (25 μg/ml) at 8 hr (red squares), LPS (10 ng/ml) at 4 hr (green triangles), imiquimod (10 μM) at 16 hr (purple diamonds), CpG (1 μM) at 16 hr (black circles), and unstimulated control at 16 hr (blue circles) from 6 donors are shown in log10 scale as a function of expression of the HKG UBC ΔCq (left) or as copy number per μg of RNA (right). IFN-α subtypes are ordered according to the phylogenetic plot of amino acid sequence similarity. This figure was originally published in Immunology and Cell Biology27.
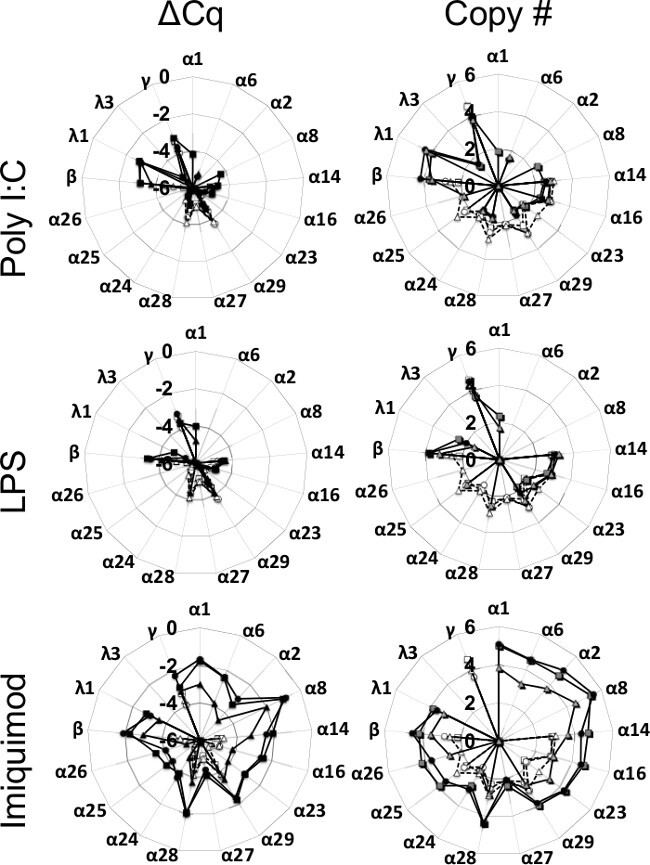 Figure 5: The rhesus macaque IFN expression signature in peripheral blood mononuclear cells (PBMC) differs in response to the TLR ligands used for stimulation. PBMC from three rhesus macaques (designated by the square, diamond, and triangle) were isolated from whole blood and stimulated with lipopolysaccharide (LPS) (10 μg/ml), poly I:C (50 μg/ml) or imiquimod (10 μg/ml). Cells were harvested at 0 hr (open shapes) or after 3 hr of TLR stimulation (closed shapes) for measurement of IFN expression. Transcript levels of type I, II, and III IFN are displayed in log10 scale as a function of expression of the HKG GAPDH ΔCq (left) or as copy number/μg RNA (right). This figure was originally published in the Journal of Interferon and Cytokine Research28.
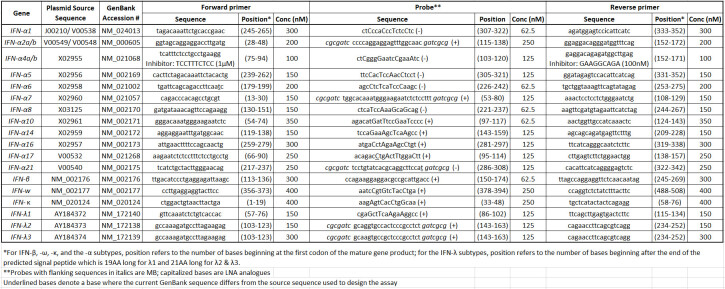 Table 1: Human IFN primer/probe set sequences and reaction information.
Please click here to view a larger version of this table.
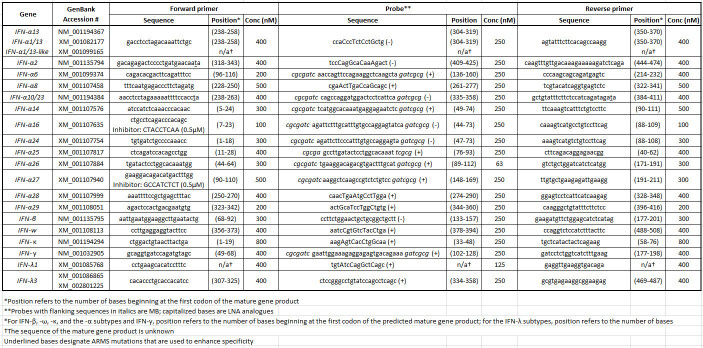 Table 2: Rhesus macaque IFN primer/probe set sequences and reaction information.
Please click here to view a larger version of this table.
| Plasmid concentration (fM) | ||||
| A | B | C | D | |
| IFN-α1 | 25 | 2.5 | 0.25 | 0.025 |
| IFN-α2 | 25 | 2.5 | 0.25 | 0.025 |
| IFN-α4 | 2500 | 250 | 25 | 2.5 |
| IFN-α5 | 25 | 2.5 | 0.25 | 0.025 |
| IFN-α6 | 250 | 25 | 2.5 | 0.25 |
| IFN-α7 | 250 | 25 | 2.5 | 0.25 |
| IFN-α8 | 250 | 25 | 2.5 | 0.25 |
| IFN-α10 | 25 | 2.5 | 0.25 | 0.025 |
| IFN-α14 | 25 | 2.5 | 0.25 | 0.025 |
| IFN-α16 | 250 | 25 | 2.5 | 0.25 |
| IFN-α17 | 25 | 2.5 | 0.25 | 0.025 |
| IFN-α21 | 25 | 2.5 | 0.25 | 0.025 |
| IFN-λ1 | 25 | 2.5 | 0.25 | 0.025 |
| IFN-λ2 | 25 | 2.5 | 0.25 | 0.025 |
| IFN-λ3 | 250 | 25 | 2.5 | 0.25 |
| IFN-β | 25 | 2.5 | 0.25 | 0.025 |
| IFN-ω | 250 | 25 | 2.5 | 0.25 |
Table 3: Standard dilution set concentration information.
| IFN Pr/Pb Sets added | Water volume added (ml) | |
| NTC 1 | IFN-β, -ω, -λ3 | 85.7 |
| NTC 2 | IFN-α1, -α5 | 100.0 |
| NTC 3 | IFN-α2 | 114.3 |
| NTC 4 | IFN-α4 | 114.3 |
| NTC 5 | IFN-α7 | 114.3 |
| NTC 6 | IFN-α6, -α8, -α10 | 85.7 |
| NTC 7 | IFN-α14, -α16 | 100.0 |
| NTC 8 | IFN-α17 | 114.3 |
| NTC 9 | IFN-α21, -λ1 | 100.0 |
| NTC 10 | IFN-λ2 | 114.3 |
Table 4: NTC working stock mixes information.
Discussion
This report describes design, batch production, and an approach towards analysis of an assay to measure transcription of a set of highly similar genes in a research laboratory setting. The high-throughput qRT-PCR assay reported here measures the IFN- and -λ subtypes with high specificity. This method involves two key aspects, the design of Pr/Pb sets that discriminate between members of a homologous gene family and the development of a production platform for the creation of reliable and consistent 384-well assay plates preloaded with the Pr/Pb sets. The qRT-PCR probes incorporate a structural (MB) or chemical (LNA) approach towards enhancing their specificity29. For two of the primer sets in the rhesus assay (Table 2), the amplification-refractory mutation system (ARMS) was incorporated into the primer sequences to further enhance specificity30. While it is generally best to target exon-exon junctions to enhance specificity of a qRT-PCR reaction, this was not possible because the type I IFN genes lack introns. Therefore, genomic DNA will be amplified in the PCR reaction, and must be degraded by DNase treatment after RNA extraction.
The target region for the Pr/Pb sets was restricted to the coding regions of the mature peptide for each IFN. Because of the high sequence similarity among the IFN-α subtypes, particularly the mature peptide region, it was sometimes necessary to compromise sensitivity to ensure specificity. This was particularly the case with IFN-α17, where the mature peptide transcript has only four unique bases when compared against the other IFN-α subtypes. Targeting IFN-α17 required primers that bind the transcripts of multiple subtypes, restricting specificity to the probe. As a consequence, the PCR reaction will amplify subtypes other than IFN-α17, thereby consuming a substantial percentage of the PCR reagents and lowering the amplitude of the fluorescence signal from the specific probe for IFN-α17. An additional challenge towards designing sensitive and specific Pr/Pb sets for highly similar genes such as the IFN is the possibility that the annotated sequences in the GenBank database may not be complete or comprehensive at time of design. Again, this was a challenge for IFN-α17, in which newly annotated sequences do not perfectly align with the version of the sequence in the database at the time of design. Therefore, when designing Pr/Pb sets for genes that have not been intensively studied, it is wise to periodically check the latest annotated sequence of a target gene. Finally, it is necessary to ensure that the Pr/Pb sets do not amplify pseudogenes that may be transcribed but not translated.
After designing the Pr/Pb sets, the next challenge is optimizing the PCR conditions of seventeen different Pr/Pb sets on one 384-well plate. Transcript standards are important in testing the specificity of a Pr/Pb set and become essential for harmonizing the qRT-PCR conditions of the numerous different PCR reactions. Testing a Pr/Pb set against the transcript standards establishes its efficiency and sensitivity; plasmids that express highly similar pseudogenes may be necessary to ensure that the Pr/Pb set selectively measures transcription of the functional gene. The transcript standards also provide a quantitative means of analysis (number of transcripts), in addition to the semi-quantitative analysis relative to a housekeeping gene (ΔCq).
Robotic multichannel pipetting from a 96-well source plate into multiple 384-well assay plates improves the precision and consistency of inter-plate results. Salmon sperm DNA (SSDNA) is used as a carrier that stabilizes and preserves the Pr/Pb sets for long term storage, as does drying the reagents dispensed into the plates. Drying the plates also decreases the volume of the reaction necessary for reproducible results, which in turn preserves precious samples and decreases the use of costly reagents. Through these steps, batches of plates are assembled that provide precision and consistency for more than six months.
Following plate preparation, quality control measures are critical to check the consistency of a batch of plates. For this purpose, an additional four sets of standards are run on a plate. The “5x standard” plate tracks performance and creates a data set to which an individual plate’s standards are compared. While ten 10-fold dilutions of each standard are used during assay design, space considerations require that four points are used for the standard curve on each assay plate, and for the 5x standard plate. Additionally, a positive control should be included on each plate to ensure the validity of the plate.
Typically, it takes 3-4 hr to prepare six assay plates from one Pr/Pb source plate; it is feasible to prepare twelve plates in a single day in a research laboratory. Since each human IFN subtype assay plate examines seventeen Pr/Pb sets and can accommodate fifteen experimental samples, one day of assembly produces a batch of plates with the capacity to generate up to 3,060 experimental data points. Raw data from the qRT-PCR platform can be processed and assembled using programming scripts in a spreadsheet application software to automatically fill a predesigned analysis template. This method minimizes hands-on data entry, thereby preventing copying errors and allows the investigator to focus on data analysis rather than data assembly. As described here, this high-throughput qRT-PCR assay can be applied to measure the expression of interferon subtypes in human or rhesus macaque samples and could be adapted to use for other species or homologous gene sets. The flexibility of the plate layout allows the user to change primer/probe sets to tailor the genes of interest toward a particular cell type or model system. This assay can be applied to measure IFN expression signatures in cell culture models studying pathogens or in patient samples in the context of disease models to elucidate the signaling mechanisms involved in immune response.
Disclosures
VPM and RLR are co-inventors of the technology to measure expression of IFN- and IFN- subtypes and derive royalty income from it. The remaining authors declare no conflict of interest.
Acknowledgments
This work was supported by CBER/FDA-NIAID/NIH Interagency Agreement YI-AI-6153-01, FDA/CBER intramural funds, and the FDA Medical Countermeasures Initiative. TCT, MNB, VPM, LMS, and KDK were supported by an appointment to the Research Participation Program at the Center for Biologics Evaluation and Research administered by the Oak Ridge Institute for Science Education through an Interagency agreement between the U.S. Departmen of Energy and the U.S. Food and Drug Administration.
References
- Yan N, Chen ZJ. Intrinsic antiviral immunity. Nature. 2012;13:214–222. doi: 10.1038/ni.2229. [DOI] [PMC free article] [PubMed] [Google Scholar]
- Pestka S, Krause CD, Walter MR. Interferons, interferon-like cytokines, and their receptors. Immunological reviews. 2004;202:8–32. doi: 10.1111/j.0105-2896.2004.00204.x. [DOI] [PubMed] [Google Scholar]
- Baum A, Garcia-Sastre A. Induction of type I interferon by RNA viruses: cellular receptors and their substrates. Amino acids. 2010;38:1283–1299. doi: 10.1007/s00726-009-0374-0. [DOI] [PMC free article] [PubMed] [Google Scholar]
- Kotenko SV, et al. IFN-lambdas mediate antiviral protection through a distinct class II cytokine receptor complex. Nature. 2003;4:69–77. doi: 10.1038/ni875. [DOI] [PubMed] [Google Scholar]
- Hardy MP, Owczarek CM, Jermiin LS, Ejdeback M, Hertzog PJ. Characterization of the type I interferon locus and identification of novel genes. Genomics. 2004;84:331–345. doi: 10.1016/j.ygeno.2004.03.003. [DOI] [PubMed] [Google Scholar]
- Cheon H, et al. IFNbeta-dependent increases in STAT1, STAT2, and IRF9 mediate resistance to viruses and DNA damage. The EMBO journal. 2013;32:2751–2763. doi: 10.1038/emboj.2013.203. [DOI] [PMC free article] [PubMed] [Google Scholar]
- Schneider WM, Chevillotte MD, Rice CM. Interferon-stimulated genes: a complex web of host defenses. Annual review of immunology. 2014;32:513–545. doi: 10.1146/annurev-immunol-032713-120231. [DOI] [PMC free article] [PubMed] [Google Scholar]
- Hiscott J, Nguyen TL, Arguello M, Nakhaei P, Paz S. Manipulation of the nuclear factor-kappaB pathway and the innate immune response by viruses. Oncogene. 2006;25:6844–6867. doi: 10.1038/sj.onc.1209941. [DOI] [PMC free article] [PubMed] [Google Scholar]
- Alcami A, Symons JA, Smith GL. The vaccinia virus soluble alpha/beta interferon (IFN) receptor binds to the cell surface and protects cells from the antiviral effects of IFN. Journal of virology. 2000;74:11230–11239. doi: 10.1128/jvi.74.23.11230-11239.2000. [DOI] [PMC free article] [PubMed] [Google Scholar]
- Huang J, et al. Inhibition of type I and type III interferons by a secreted glycoprotein from Yaba-like disease virus. Proceedings of the National Academy of Sciences of the United States of America. 2007;104:9822–9827. doi: 10.1073/pnas.0610352104. [DOI] [PMC free article] [PubMed] [Google Scholar]
- Bidwell BN, et al. Silencing of Irf7 pathways in breast cancer cells promotes bone metastasis through immune escape. Nature medicine. 2012;18:1224–1231. doi: 10.1038/nm.2830. [DOI] [PubMed] [Google Scholar]
- Di Domizio J, Cao W. Fueling autoimmunity: type I interferon in autoimmune diseases. Expert review of clinical immunology. 2013;9:201–210. doi: 10.1586/eci.12.106. [DOI] [PMC free article] [PubMed] [Google Scholar]
- Crow YJ, Casanova JL. STING-Associated Vasculopathy with Onset in Infancy - A New Interferonopathy. The New England journal of medicine. 2014. [DOI] [PubMed]
- Bermel RA, Rudick RA. Interferon-beta treatment for multiple sclerosis. Neurotherapeutics : the journal of the American Society for Experimental NeuroTherapeutics. 2007;4:633–646. doi: 10.1016/j.nurt.2007.07.001. [DOI] [PMC free article] [PubMed] [Google Scholar]
- Kingham JG, et al. Treatment of HBsAg-positive chronic active hepatitis with human fibroblast interferon. Gut. 1978;19:91–94. doi: 10.1136/gut.19.2.91. [DOI] [PMC free article] [PubMed] [Google Scholar]
- Heathcote J, Main J. Treatment of hepatitis C. Journal of viral hepatitis. 2005;12:223–235. doi: 10.1111/j.1365-2893.2005.00600.x. [DOI] [PubMed] [Google Scholar]
- Donnelly RP, Dickensheets H, O'Brien TR. Interferon-lambda and therapy for chronic hepatitis C virus infection. Trends in immunology. 2011;32:443–450. doi: 10.1016/j.it.2011.07.002. [DOI] [PMC free article] [PubMed] [Google Scholar]
- Castaigne S, et al. Interferon alpha in the treatment of hairy cell leukemia. Cancer. 1986;57:1681–1684. doi: 10.1002/1097-0142(19860415)57:8+<1681::aid-cncr2820571309>3.0.co;2-n. [DOI] [PubMed] [Google Scholar]
- Kumar L, Basade M, Gulati SC. Role of interferon-alpha in chronic myeloid leukemia. The Journal of the Association of Physicians of India. 1995;3:26–32. [PubMed] [Google Scholar]
- Dai C, et al. Interferon alpha on NZM2328.Lc1R27: Enhancing autoimmunity and immune complex-mediated glomerulonephritis without end stage renal failure. Clinical immunology (Orlando, Fla.) 2014;154:66–71. doi: 10.1016/j.clim.2014.06.008. [DOI] [PMC free article] [PubMed] [Google Scholar]
- Maeda S, et al. Interferon-alpha Acts on the S/G2/M Phases to Induce Apoptosis in the G1 Phase of an IFNAR2-Expressing Hepatocellular Carcinoma Cell Line. The Journal of biological chemistry. 2014. [DOI] [PMC free article] [PubMed]
- Xia CQ, et al. Increased IFN-alpha-Producing Plasmacytoid Dendritic Cells (pDCs) in Human Th1-Mediated Type 1 Diabetes: pDCs Augment Th1 Responses through IFN-alpha Production. Journal of immunology. 2014;193:1024–1034. doi: 10.4049/jimmunol.1303230. [DOI] [PMC free article] [PubMed] [Google Scholar]
- Hervas-Stubbs S, et al. Conventional but not plasmacytoid dendritic cells foster the systemic virus-induced type I IFN response needed for efficient CD8 T cell priming. Journal of immunology. 2014;193:1151–1161. doi: 10.4049/jimmunol.1301440. [DOI] [PMC free article] [PubMed] [Google Scholar]
- Manry J, et al. Evolutionary genetic dissection of human interferons. The Journal of experimental medicine. 2011;208:2747–2759. doi: 10.1084/jem.20111680. [DOI] [PMC free article] [PubMed] [Google Scholar]
- Chen J, Baig E, Fish EN. Diversity and relatedness among the type I interferons. Journal of interferon & cytokine research : the official journal of the International Society for Interferon and Cytokine Research. 2004;24:687–698. doi: 10.1089/jir.2004.24.687. [DOI] [PubMed] [Google Scholar]
- Fox BA, Sheppard PO, O'Hara PJ. The role of genomic data in the discovery, annotation and evolutionary interpretation of the interferon-lambda family. PloS one. 2009;4:e4933. doi: 10.1371/journal.pone.0004933. [DOI] [PMC free article] [PubMed] [Google Scholar]
- Hillyer P, et al. Expression profiles of human interferon-alpha and interferon-lambda subtypes are ligand- and cell-dependent. Immunology and cell biology. 2012;90:774–783. doi: 10.1038/icb.2011.109. [DOI] [PMC free article] [PubMed] [Google Scholar]
- Schramm LM, et al. High-throughput quantitative real-time polymerase chain reaction array for absolute and relative quantification of rhesus macaque types I, II, and III interferon and their subtypes. Journal of interferon & cytokine research : the official journal of the International Society for Interferon and Cytokine Research. 2012;32:407–415. doi: 10.1089/jir.2012.0015. [DOI] [PMC free article] [PubMed] [Google Scholar]
- Wang Q, Chen L, Long Y, Tian H, Wu J. Molecular beacons of xeno-nucleic acid for detecting nucleic acid. Theranostics. 2013;3:395–408. doi: 10.7150/thno.5935. [DOI] [PMC free article] [PubMed] [Google Scholar]
- Little S, et al. Amplification-refractory mutation system (ARMS) analysis of point mutations. Current protocols in human genetics / editorial board, Jonathan L. Haines ... [et al.] 2001;9(Unit 9 8) doi: 10.1002/0471142905.hg0908s07. [DOI] [PubMed] [Google Scholar]


