Abstract
Liver inflammation as a response to injury is a highly dynamic process involving the infiltration of distinct subtypes of leukocytes including monocytes, neutrophils, T cell subsets, B cells, natural killer (NK) and NKT cells. Intravital microscopy of the liver for monitoring immune cell migration is particularly challenging due to the high requirements regarding sample preparation and fixation, optical resolution and long-term animal survival. Yet, the dynamics of inflammatory processes as well as cellular interaction studies could provide critical information to better understand the initiation, progression and regression of inflammatory liver disease. Therefore, a highly sensitive and reliable method was established to study migration and cell-cell-interactions of different immune cells in mouse liver over long periods (about 6 hr) by intravital two-photon laser scanning microscopy (TPLSM) in combination with intensive care monitoring.
The method provided includes a gentle preparation and stable fixation of the liver with minimal perturbation of the organ; long term intravital imaging using multicolor multiphoton microscopy with virtually no photobleaching or phototoxic effects over a time period of up to 6 hr, allowing tracking of specific leukocyte subsets; and stable imaging conditions due to extensive monitoring of mouse vital parameters and stabilization of circulation, temperature and gas exchange.
To investigate lymphocyte migration upon liver inflammation CXCR6.gfp knock-in mice were subjected to intravital liver imaging under baseline conditions and after acute and chronic liver damage induced by intraperitoneal injection(s) of carbon tetrachloride (CCl4).
CXCR6 is a chemokine receptor expressed on lymphocytes, mainly on Natural Killer T (NKT)-, Natural Killer (NK)- and subsets of T lymphocytes such as CD4 T cells but also mucosal associated invariant (MAIT) T cells1. Following the migratory pattern and positioning of CXCR6.gfp+ immune cells allowed a detailed insight into their altered behavior upon liver injury and therefore their potential involvement in disease progression.
Keywords: Immunology, Issue 97, intravital imaging, TPLSM, two-photon microscopy, liver, migration, microscopy, leukocyte traffic, inflammation
Introduction
The visualization of cells and cellular functions in whole organs or even whole organisms has been of great interest for more than 50 years, including virtually all parts of the body2. Therefore, some early studies already employed intravital imaging of the liver3,4. However, several limitations exist up to date regarding long term stable high-resolution imaging of liver tissue.
Due to the anatomical position of the liver in close contact with the diaphragm and the gastrointestinal tract5, the most common problem for microscopic intravital imaging is movement due to respiration and, to a lesser extent, peristaltic of the intestinal tract6. In comparison to other solid organs, liver surgery is particularly challenging. Due to the dense microvascular structure, surgical manipulation can lead to massive hemorrhagic lesions, impaired microcirculation7 and also activation of resident immune cells such as Kupffer cells8. Therefore, mechanical fixation of the tissue as published elsewhere6,9 is likely to interfere with the intravital microscopy imaging.
In a healthy liver, 10-15% of the total blood volume resides within the liver vasculature, and the organ receives around 25% of the overall cardiac output10, rendering the organ highly susceptible to changes in the circulation (e.g., blood pressure fluctuations). Therefore, disruptions in the hepatic blood flow due to e.g., shear stress, displacement, injury by excessive tissue handling or centralized circulation will lead to artificial alterations in leukocyte migratory behavior, impaired liver oxygenation and therefore further liver damage, affecting liver immune responses as well as organ preservation and overall life time of the animal.
Early microscopic studies were based on intravital epifluorescence microscopy, but several technical constraints such as photo bleaching and low penetration depth limit the use of this technique for long term liver imaging4,11,12. With the development of multiphoton microscopy in the 1990s, the limitations of photo bleaching or penetration depth were mainly solved, as this new method was technically capable to perform imaging studies in virtually all organs under real life situations13-15. However, the main remaining challenges with respect to liver imaging were: breath movements, autofluorescence of liver tissue, securing unaltered blood flow in the hepatic sinusoids, and especially stable imaging for longer periods of several hr16.
Although several studies addressed the function and migration of various leukocytes in the liver17, e.g., NKT-cells18-20, T cells21,22, liver macrophages23,24 or neutrophils25, long term multiphoton microscopy imaging had not yet been successfully established, a task even more challenging in animals with acute or chronic liver disease due to the existing damage and therefore higher susceptibility to further damage26. However, monitoring migratory behavior and cellular function of leukocytes in the liver in real time allows novel insights in their particular role in liver homeostasis and disease27.
The chemokine receptor CXCR6 is expressed on several lymphocyte subsets, including natural killer (NK) cells, NKT cells and some T cell populations18,28. Prior studies in mice have indicated that CXCR6 and its cognate ligand CXCL16 may control the patrolling of NKT cells on liver sinusoids during homeostasis. Consequently, the use of CXCR6.gfp mice (carrying a knock-in of green fluorescent protein [gfp] in the CXCR6 locus) has been described to investigate the migration of lymphocytes in various organs such as brain29 and also liver18,20, showing increased infiltration of CXCR6.gfp cells upon inflammation.
With the method provided in this study it was possible to follow these processes over a long period of time under stabilized conditions. The intravital multiphoton based procedure allowed imaging that was highly reproducible with minimal perturbation of the animal and the organ; optimized for long-term animal survival by extensive monitoring followed by close control of respiration and circulation; and highly flexible and easy to adopt also to other parenchymal organs such as kidney or spleen.
Protocol
NOTE: The experiments were performed in accordance with the German legislation governing animal studies following the ‘Guide for the care and use of Laboratory Animals’ (NIH publication, 8th edition, 2011) and the Directive 2010/63/EU on the protection of animals used for scientific purposes (Official Journal of the European Union, 2010). Official permission was granted from the governmental animal care and use office (LANUV Nordrhein-Westfalen, Recklinghausen, Germany).
NOTE: Steps that can be omitted for short term imaging (e.g. snap shots, 3-D stacks or also short duration time-lapse microscopy) are marked with asterisks (*) to reduce preparation time and simplify the surgical protocol. Imaging can also be performed without extensive monitoring and circulation control if necessary, however, survival time will be markedly reduced.
1. Microscope Setup and Pre-surgery Preparation (5-10 min)
Switch system on (microscope, power Lab, laser, heating pad, climate chamber, web cam, syringe pump device, respirator).
- Connect O2 supply to Isoflurane Vapor and set Isoflurane level to 1.5 Vol% (v/v), connect to a small animal respirator.
- For short term imaging, maintain the anesthesia using isoflurane only after the initial i.p. anesthesia induction (see step 2.2). Then use 2 Vol% (v/v) Isoflurane, and keep the imaging time below 2 hr to guarantee stable liver microcirculation.
Set respiration to 120-140 respiratory cycles/min with a volume of 150-200 µl.
Set up mouse agarose stage. Prepare 100 ml of 3% (w/v) agarose, pouring it into a dish (approximately 10 cm x 15 cm base) in an angle of 40°.
Set up surgical work area collecting the required instrumentation. To prevent microbial infection, disinfect instruments using a 1% solution of Sekusept Forte S (9.9% w/v), Glutaral 9.8% w/v, Formaldehyde for 5 min before the experiment (Figure 1A).
Obtain remaining components: skin disinfectant (e.g., 10% povidone iodine solution ), liver stage (stacks & bridge), agarose solution (3% (w/v) in PBS), syringe pump with 5% (w/v) glucose solution (G-5), syringe pump with anesthetic solution I (Ketamine 0.1 mg/ml, Xylazine 0.5 mg/ml, Fentanyl 5 µg/ml), cotton swabs, n-Butyl-2-Cyanoacrylat, and 1x PBS. Put agarose stage dish into incubation chamber for preheating.
2. Tracheotomy (10-15 min)
Use C57BL/6 mice from in house breeding weighing 25-28 g. House the mice under specific pathogen-free conditions in accordance with the FELASA guidelines, in a temperature- and humidity-controlled environment with a 12 hr light/12 hr dark cycle. Allow animals free access to standard mice diet (Sniff Standard Rodent Diet) and water ad libitum.
- Anesthetize the mouse by initial intraperitoneal (i.p.) injection of 250 µl of anesthetic solution II (Ketamine 0.1 mg/ml, Xylazine 1 mg/ml, Buprenorphine 10 µg/ml).
- * For upkeep during intravital imaging, continuously administer anesthetic solution I by continuous i.p. injection (Ketamine 0.1 mg/ml, Xylazine 0.5 mg/ml, Fentanyl 5 µg/ml) using a syringe pump device with a flow rate of 0.2 ml/hr in combination with inhalative isoflurane 0.5 Vol% (v/v).
- Check reflexes after 5 min (e.g. pinch foot pad with forceps), disinfect skin for tracheotomy, start preparation if mouse is in surgical tolerant anesthesia state.
- Apply eye protective cream (e.g., Dexpanthenol 50 mg/g) to prevent cornea from drying out (Figure 1B).
- Fixate mouse on preparation table exposing ventral side using adhesive tape for the extremities; gently overstretch neck, fixate in this position, e.g., by using a rubber band hooked to the incisors.
- Disinfect skin and fur using povidone iodine solution, by applying disinfectant with a cotton swab.
- Perform initial skin cut (0.5-1 cm length) directly below chin (Figure 1C)
- Carefully dissect connective tissue between salivary glands (Figure 1D).
- Carefully tear open muscular tube surrounding trachea (Figure 1E,F).
- Place surgical thread underneath the trachea for later ventilation tube fixation (Figure 1G).
- Open trachea with micro-scissors between cartilage rings performing a T-shaped incision (Figure 1H)
Place ventilation tube into trachea through the incision (~0.5 cm). To push the tube forward, grab caudal end with small anatomical forceps and gently advance the tube into the trachea (Figure 1I)
Fixate tube with surgical thread (e.g., 5-0) with thread placed in Step 2.5 tying a knot around tube inside trachea; perform second cranial fixation of the tube at the skin to avoid accidental depositioning (Figure 1J,K).
Seal cut with tissue glue (e.g., n-Butyl-2-Cyanoacrylat) (Figure 1L).
Fixate tube at the head using adhesive tape .
3. Laparatomy (15-20 min)
Place mouse on heating pad to prevent hypothermia. Shave abdomen, carefully remove hair from the skin. Disinfect shaved skin and fur by using povidone iodine solution.
Perform a small skin cut below the sternum using surgical scissors (Figure 2A). Extend the cut laterally below the ribs to both sides, cauterizing all visible blood vessels to prevent bleeding.
Carefully perform a small cut at the linea alba below the sternum, opening the peritoneum (Figure 2B). Extend the cut to both sides using cauterization to prevent bleeding (Figure 2C, D).
Place mouse into agarose stage dish (Figure 2E). Place stacks of appropriate height on both sides of the mouse (usually 12-14 cover slips) (Figure 2F).
Place respiratory trigger sensor underneath upper back to synchronize the microscope with the respiration. Activate trigger unit (Figure 2G).
Place surgical thread (5-0) through the sternum to retract ribs (Figure 2I).
Carefully cut ligament connecting liver and diaphragm (falciform ligament) as well as liver and gastrointestinal tract using curved surgical scissors. Cut the falciform ligament down to the aorta (Figure 2J).
4. Sample Setup (10-15 min)
Place mouse on the right side with an angle of 45° for easy access to large liver lobe.
Add staging bridge below the ribs, covering the abdominal cavity. Manufacture a bridge by using a standard cover slip with adhesive tape coating to cover sharp edges (Figure 2K).
Place large liver lobe on stage. Carefully slip double ball stylus probe or a padded spatula below the liver and hold the top of the organ using a wet cotton swab or wet tissue. Lift lobe onto the slide and apply gentle drag. Lobe can be bent or folded. Provide extra care to only gentle manipulation of the liver (Figure 2L).
Place lateral supporting stakes, e.g., piles of small cover slips (20 mm x 20 mm), of approximately the same height of the liver lobe next to it to support cover slip.
Place large cover slip (24 mm x 50 mm) on the liver lobe. Ensure that cover slip is oriented as horizontal as possible (Figure 2M). NOTE: The cover slip should be in contact with the tissue without squeezing it. Check for visible signs of impaired blood flow (white tissue). If microcirculation is disrupted, add further supporting stakes.
* Place two independent intraperitoneal catheters (Figure 2N) for long term anesthesia and G-5 application. Install catheters laterally in the lower abdomen next to the hind limbs. NOTE: The intraperitoneal catheters can be self-made by connecting 27 G needles with flexible silicone tubing (Figure 3).
* Fixate needle with a loop of 5-0 surgical thread to the skin to avoid accidental displacement.
* Attach syringe pump with anesthesia solution I to catheter 1, set flow rate to 0.2 ml/hr; attach syringe pump with G-5 to catheter 2, set flow rate to 0.1 ml/hr.
5. Mouse Monitoring
* Place ECG electrodes into front and hind extremities (Figure 4A).
* Attach expiration tubing to CO2 level sensor.
Add external temperature sensor connected to heat pad (Figure 4C).
6. Embedding and Tissue Fixation (5-10 min)
Prepare 100 ml of 3% (w/v) agarose in 1X PBS. Embed liver when temperature is at 41 °C using a 5 ml syringe and an 18 G needle (Figure 5A).
Pour remaining agarose on coverslip and around the mouse (Figure 5B, C). Wait until agarose is fully gelatinized.
Remove excess agarose using the Heidemann spatula, preparing a viewfield large enough to scan the prepared liver lobe (Figure 5D, E).
7. Imaging
Transfer the mouse into microscope climate chamber.
Add 50-100 ml of 1x PBS (preheated on 37 °C).
Cover sample dish to prevent evaporation (Figure 5F).
* Decrease inhalative isoflurane to 0.5 Vol% (v/v).
* Start monitoring software, recording ECG, heart rate and expiratory CO2.
Start imaging: open laser shutters, identify view fields of interest, define upper and lower boundary for Z-stacks, and start time lapse recording. Readjust Z-stacks if necessary to correct Z-drift (e.g. due to changes in blood pressure or temperature fluctuation, Figure (5G). NOTE: After completion of the imaging period or if the circulation or anesthesia of the animals becomes unstable, sacrifice mice by cervical dislocation (without awakening from the anesthesia).
Representative Results
To validate our intravital TPLSM approach, we subjected CXCR6gfp/+ mice to intravital TPLSM imaging. Mice were either left untreated as baseline controls or subjected to a single intraperitoneal injection of carbon tetrachloride (CCl4) to induce acute liver damage20.
Video sequences were taken over a time period of 2-5 hr, and cells were traced over time due to their green fluorescence. To show general cellular motility, all tracks that were detected during the procedure were plotted as a superimposed image (Figure 6A). While cells under baseline conditions showed long distance migration along the liver sinusoids towards the central vein, 18 hr after CCl4 treatment the CXCR6+/gfp cells showed already partially impaired movement patterns. Although some fast moving cells were still present in the liver sinusoids, several focal areas were visible with cells that had changed from random migration to local scanning, indicating a chemotactic response recruiting the cells to the area of injury. The effect was even more pronounced after 36 hr, showing an almost complete arrest of CXCR6+ cells with virtually no active migration. While under baseline conditions most migrating cells had variable migration speeds with random directional changes, CCl4 treated animals showed cells that were only slowly crawling as well as some freely motile cells patrolling the sinusoids after 18 hr but not after 36 hr. Using color-coded migration tracks, cell speed could be visualized directly to assess the effect of the CCl4 treatment. The impaired migration was also visible in the normalized track diagram (Figure 6B), showing that 18 hr after CCl4 the amount of long distance tracks as well as the average track length was markedly reduced, while after 36 hr no motile cells were detectable any more. In line with these findings, the cellular displacement, which describes the ability of a cell to freely patrol the vasculature, decreased over time, indicating a trapping of the cells 36 hr after CCl4 treatment at the site of hepatocellular damage (Figure 6C).
To follow the migratory behavior of CXCR6+/gfp cells in liver in more detail, the migration speed of representative individual cells was plotted to visualize their level of motility over time. We and others previously described several distinct motion patterns of CXCR6+/gfp cells: Active random crawling with a sticking rolling pattern, showing phases of cellular motility and temporal quiescent states; directed cellular recruitment with cells scanning an area of interest but still capable of active crawling; total cellular arrest accompanied by immune cell activation18,20. While mice without treatment mainly showed cells that were freely motile with speeds up to 15 µm/sec, CXCR6+/gfp cells in mice treated with CCl4 displayed markedly reduced cell migration speed and partial arrest already after 18 hr and full migratory arrest after 36 hr (Figure 7A). In line with the single cell analysis, the statistical data of all cells within a sequence revealed decreasing overall migration speed after CCl4 treatment (Figure 7B), which was also resembled by average track speeds (Figure 7C) and track maximum migration speeds (Figure 7D), showing that the approach was suitable to describe differences in cell migration and positioning in developing liver disease.
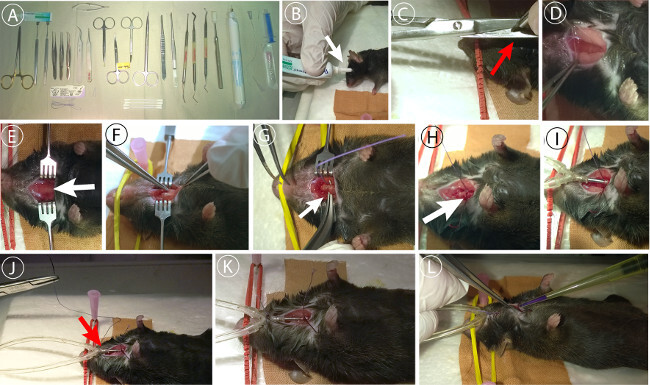 Figure 1: Tracheotomy of the mouse. (A) Surgical equipment used for preparation. 1x standard pattern forceps, 1x Semken forceps, 1x Dumont No.7 forceps, Graefe forceps (serrated, 2x straight / 1x curved), 2x Blair retractors (4 pronged (blunt)), double ball stylus probe (e.g., Amalgam burnisher 3PL), Heidemann spatula HD2, needle holder (Mathieu or Halsey), 1x small surgical scissors (sharp/blunt, 1xcurved, 1x straight), micro-scissors (e.g., Vannas Spring Scissors), 1x small animal cauter, cotton swabs, eye protective salve, surgical thread, n-Butyl-2-Cyanoacrylatglue. (B) eyes are protected using an eye protective ointment. (C) Initial skin cut for trachea preparation. (D) Dissection of connective tissue between submaxillary salivary glands. (E) Exposition of the trachea. (F) Dissection of the muscular tissue surrounding trachea. (G) Placement of surgical thread underneath trachea for fixation of tube. (H) Tracheal incision using microscissors between upper cartilage rings. (I) Insertion of ventilation tube into trachea. (J) Placement of cranial surgical thread to fix tube to the skin. (K) Double fixation of the tube. (I) Sealing surgical incision using n-Butyl-2-Cyanoacrylat. Please click here to view a larger version of this figure.
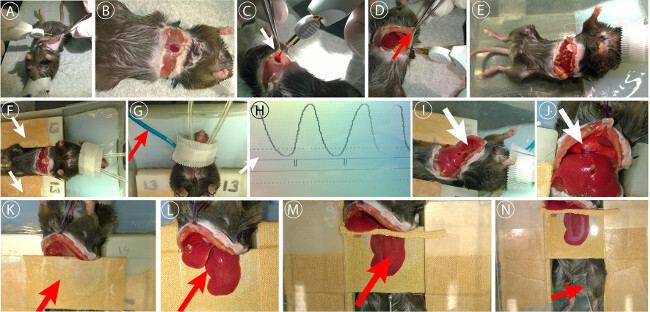 Figure 2: Laparatomy and liver preparation. (A) Initial skin incision, blood vessels were cauterized to prevent excessive bleeding. (B) Opening of the peritoneum underneath the sternum. (C) Extension of the peritoneal cut using cautery unit. (D) Sealing of epigastric vessels. (E) Further extension of the peritoneal incision below ribs. (F) Placement of animal into agarose stage dish. (F) Placement of support stacks. (G) Placement of respiratory trigger sensor. (H) Setup of trigger threshold for respiration synchronized imaging. (I) Sternum fixation to retract ribs using surgical thread. (J) Disconnection of the gall bladder from the diaphragm and dissection of the falciform ligament. (K) Placement of staging cover slip. (L) Placement of liver lobe on stage. (M) Placement of coverslip on liver lobe. (N) Placement of i.p. catheter for long term anesthesia. Please click here to view a larger version of this figure.
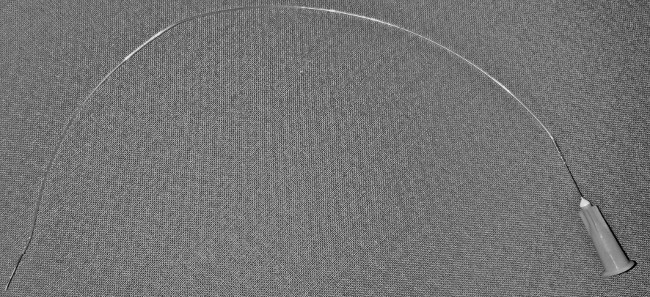 Figure 3: Intraperitoneal catheter. 27 G needles connected with flexible silicone tubing.
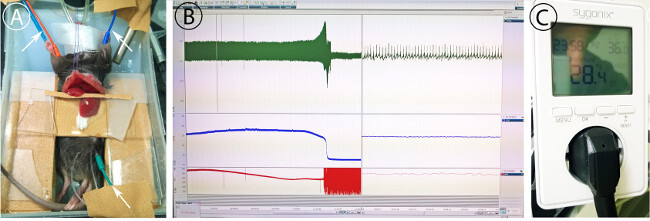 Figure 4: Monitoring of the mouse. (A) Placement of ECG electrodes (green, red, blue cables). Needles for ECG detection are placed subcutaneously as shown. (B) Monitoring of ECG (red), expiratory CO2 (blue) and heart rate (red) showing long term progression (left) and actual measurement (right). (C) Temperature controlled power unit for heat pad control. Temperature is set to 36 °C. Please click here to view a larger version of this figure.
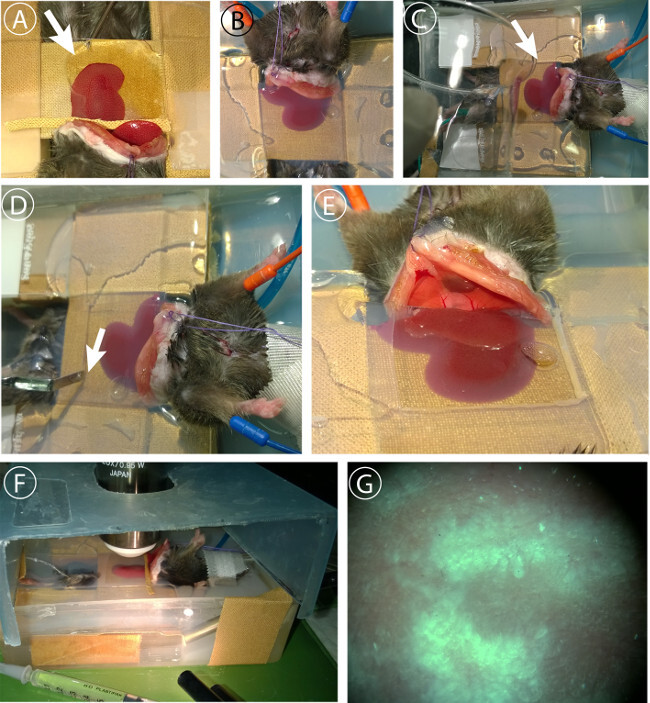 Figure 5: Liver embedding and imaging. (A) Embedding of liver lobe. 3% agarose in PBS is injected at 41 °C under the cover slip using a 2 ml syringe with an 18G needle. (B) Liver lobe is fully embedded in agarose to minimize movement artifacts. (C) Sealing of peritoneum with remaining agarose to prevent dehydration. (D) Removal of agarose covering microscope field of view after full gelatinization. (E) Preparation of viewfield. F Adjustment of Z-level and evaluation of sample blood flow using light microscopy. (D) Cover dish to prevent excessive evaporation. Cover is lifted in the picture to show setup. Please click here to view a larger version of this figure.
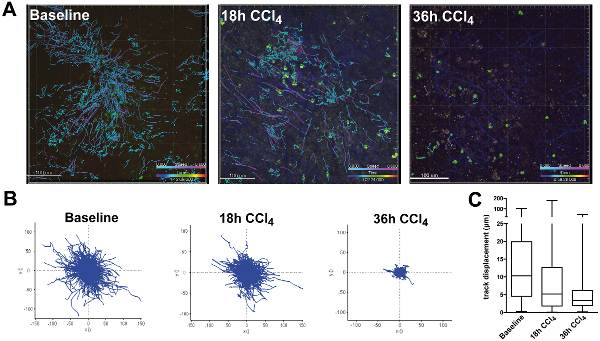 Figure 6: Tracking of CXCR6gfp/+ cells in chronic liver damage after CCl4 injection. Mice were injected i.p. with 0.6 ml/kg CCl4 dissolved in sunflower oil 18 hr or 36 hr before imaging. On the day of the experiment, mice were subjected to intravital TPLSM as described. (A) Still images of cell tracking. Tracks from all time points were superimposed to show cellular motility and displacement. Images were taken using a single beam Titan Saphire Laser at 840 nm and a TPLSM microscope. Areas were scanned taking 3-5 Z-stacks with a penetration depth of 70µm with a sampling rate of approximately 30 seconds per scan cycle. Tracks were color coded to show migration speed (light blue: slow moving or sessile cells; purple: motile cells). Scale bars: 100 µm. (B) XY-diagrams of paths normalized for their origin showing track directionality and track length (µm). (C) Total displacement of cells from their origin. Please click here to view a larger version of this figure.
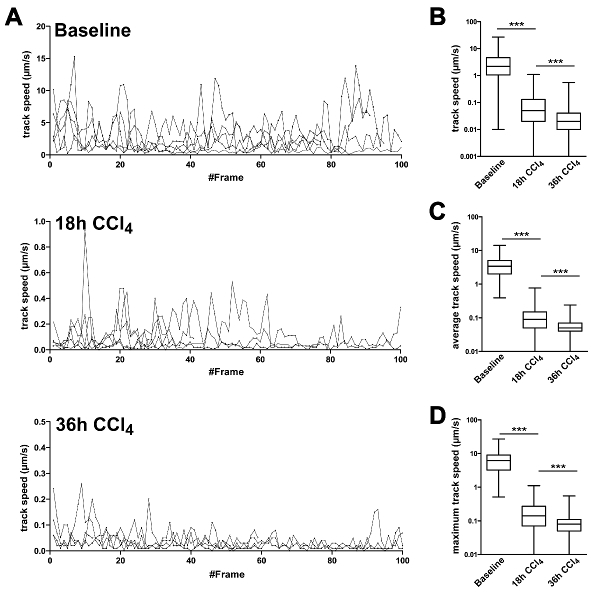 Figure 7: Migration statistics of CXCR6gfp/+ cells followed by intravital TPLSM in liver tissue in baseline and CCl4 treated mice. Cells were analyzed for their migration speed patrolling the liver. (A) Representative speed of single cells followed over time. Speed was measured at each time point and plotted for each frame individually. Lines represent individual cells. Y-axes are scaled according to maximum migration speed. (B) Statistical analysis of A. Frame specific speeds from all cells were grouped and analyzed in baseline and CCl4 treated mice. (C) Average track speed was calculated per track and data from all tracks were grouped for analysis. (D) Maximum speed of each track was plotted and analyzed. All experiments were performed in groups of 3 animals and results were confirmed in two independent experiments. ***P <0.001 (two-tailed unpaired Student t-test). Please click here to view a larger version of this figure.
Discussion
The aim of our study was to develop a highly standardized, stable and reproducible method for intravital TPLSM imaging of the liver. Intravital imaging in general has given valuable insights into cellular behavior under real life conditions following homing and interaction of different leukocyte populations in development, homeostasis and disease. However, the somewhat challenging anatomical position of the liver, due to which respiratory and peristaltic intestinal movement directly are transmitted to the liver as well as their high fragility compared to other solid organs imposed several challenges for stable long term intravital imaging. Over recent years, many experimental studies in mice have revealed the highly dynamic nature of immune cell infiltration in injured liver28, with major contributions from resident or infiltrating monocytes/macrophages30-32, neutrophils33 or various lymphocyte subsets34,35. However, most of these data were derived from end-point analyses (e.g., multicolor flow cytometry after sacrificing the animals). Up to now only few studies exist describing the dynamics of cellular traffic during liver inflammation using multicolor intravital imaging. Using inverted microscopes circumvents the necessity for fixation and moisturizing of the liver due to the firm adhesion of the tissue to the glass bottom24. However, since many multiphoton microscopes are built as upright imaging systems, more elaborate preparation and fixation methods are needed to stabilize the tissue for the time of imaging. Commonly, custom made staging systems have been described for tissue fixation6, 36,37, however with these it is crucial to validate the liver microcirculation, since even minimal pressure on the tissue affects sinusoidal blood flow with even more severe effects on diseased liver38.
Therefore, the following points were addressed in the setup of this method to optimize the results obtained by in vivo TPLSM imaging: Enhancing the quality of the preparation by minimized sample perturbation and disruption of the microcirculation due to handling issues and increased animal survival; intensive care monitoring and subsequent adaptation of anesthesia, respiration and stabilization of the circulation further enhanced animal survival and minimized physiological artifacts, e.g., caused by imbalances in blood pH. Controlled respiration in combination with triggered imaging was essential to eliminate movement artifacts due to synchronization of the microscope with the respiratory cycles. The embedding of the organ in agarose containing physiological salt concentrations was beneficial to gently fixate the organ after preparation without any further mechanical manipulation and prevented also dehydration of the sample. Most protocols used for liver microscopy provide only insufficient methods for stable, long term anesthesia. However, the survival of the animals could be significantly enhanced with the anesthesia protocol provided here and in combination with the monitoring was sufficient to guarantee survival up to 8 hr. Alternative methods are generally suitable to visualize processes within a time period of up to 3 hours such as neutrophil invasion39, but lack the possibility to image longer lasting processes such as monocyte or lymphocyte invasion22 or even cell proliferation6. Understanding the dynamics of recruitment, infiltration and cellular interaction during acute and chronic liver inflammation can provide more detailed insight into the development and progression of liver disease. By using this enhanced understanding of the immunopathology it will be possible to design therapies much more refined in terms of addressing the target cells of interest rather than using e.g. non-selective immunosuppressive approaches.
To address the positioning, transmigration and interaction of leukocytes, high quality images are needed for accurate 4D tracking of the cells within the liver vasculature and liver tissue18,20,40.
The method we provide here can be applied using common laboratory reagents and equipment, making it both easy to handle and cost efficient with minimal perturbation of the sample. To maintain the physiological conditions of the mouse for as long as possible, it is necessary to fine-adjust the respiratory volume and frequency to control oxygenation and blood CO2 levels. Although due to the continuous infusion of liquids into the peritoneum there is at least a tentative supply to stabilize the circulation, ECG and heart frequency measurements only allow a partial control regarding stabilization of the circulation. By implementing direct blood pressure control and central venous liquid application it is likely that the vital parameters can be stabilized even more, leading to further enhancement of stability and survival.
Even under highly controlled conditions, imaging of animals which have been subjected to liver damage models commonly used in mice such as acetaminophen induced liver damage, CCl4 induced liver damage or dietary induced fatty liver disease remains challenging. Due to the essential function of the liver in metabolic state control and its central position in the circulation, alterations of the liver functionality or microcirculation directly impacts long-term survival of the animals, therefore limiting the possibility to obtain long TPLSM video-sequences of heavily damaged organs, e.g. with severe hemorrhages or destroyed microvasculature. Also, in severely altered liver microanatomy as in models with extensive necroses, it remains difficult to study cell-cell-interactions and local compartmentalization of inflammatory cell aggregates, because no standardized “counter-staining” for anatomical structures (such as hematoxylin-staining in conventional microscopy or DAPI staining in immunofluorescence) is available for intravital TPLSM.The quality of the data obtained by the imaging process further depends on the labeling intensity of the cells and the microscopic setup.
Several approaches exist to visualize GFP+ cells in liver. The highest fluorescence with very low background fluorescence is obtained between 900 and 920 nm excitation wavelength. The almost complete loss of liver background fluorescence does not allow investigating the positioning of the cells within the liver, when not using additional vessel trackers such as Dextran or Lectin. Therefore, we decided to image the migrating leukocytes at a wavelength of 840 nm, giving the best ratio between the GFP signal and detailed but not too bright liver background fluorescence.
Taken together, the intravital TPLSM imaging system introduced in this study can be applied to a broad variety of liver specific intravital microscopy questions. With this approach, TPLSM imaging in other solid organs such as kidney, liver, bladder, gut or pancreas is feasible with only minor modifications of the surgical procedures and tissue staging, therefore providing a highly flexible approach to investigate long term migratory processes of cells in vivo.
Disclosures
The authors disclose no conflict of interests.
Acknowledgments
The authors thank the Central Animal facility of the University Hospital Aachen for technical support. This work was supported by the German Research Foundation (DFG Ta434/2-1, DFG SFB/TRR 57) and by the Interdisciplinary Center for Clinical Research (IZKF) Aachen. This work was further supported by the Core Facility ”Two-Photon Imaging”, a Core Facility of the Interdisciplinary Center for Clinical Research (IZKF) Aachen within the Faculty of Medicine at RWTH Aachen University.
References
- Dusseaux M, et al. Human MAIT cells are xenobiotic-resistant, tissue-targeted, CD161hi IL-17-secreting T cells. Blood. 2011;117(4):1250–1259. doi: 10.1182/blood-2010-08-303339. [DOI] [PubMed] [Google Scholar]
- Reese AJ. The effect of hypoxia on liver secretion studied by intravital fluorescence microscopy. Br J Exp Pathol. 1960;41:527–535. [PMC free article] [PubMed] [Google Scholar]
- Bhathal PS, Christie GS. Intravital fluorescence microscopy study of bile ductule proliferation in guinea pigs. Gut. 1969;10(11):955. [PubMed] [Google Scholar]
- Stefenelli N. Terminal vascular system and microcirculation of the rat liver in intravital microscopy. Wien Klin Wochenschr. 1970;82(33):575–578. [PubMed] [Google Scholar]
- Hori T, et al. Simple and sure methodology for massive hepatectomy in the mouse. Ann Gastroenterol. 2011;24(4):307–318. [PMC free article] [PubMed] [Google Scholar]
- Tanaka K, et al. Intravital dual-colored visualization of colorectal liver metastasis in living mice using two photon laser scanning microscopy. Microsc Res Tech. 2011;75(3):307–315. doi: 10.1002/jemt.21059. [DOI] [PubMed] [Google Scholar]
- Schemmer P, Bunzendahl H, Klar E, Thurman RG. Reperfusion injury is dramatically increased by gentle liver manipulation during harvest. Transpl Int. 2000;13(1):S525–S527. doi: 10.1007/s001470050394. [DOI] [PubMed] [Google Scholar]
- Schemmer P, et al. Activated Kupffer cells cause a hypermetabolic state after gentle in situ manipulation of liver in rats. Am J Physiol Gastrointest Liver Physiol. 2001;280(6):G1076–G1082. doi: 10.1152/ajpgi.2001.280.6.G1076. [DOI] [PubMed] [Google Scholar]
- Toiyama Y, et al. Intravital imaging of DSS-induced cecal mucosal damage in GFP-transgenic mice using two-photon microscopy. J Gastroenterol. 2010;45(5):544–553. doi: 10.1007/s00535-009-0187-7. [DOI] [PubMed] [Google Scholar]
- Zimmon DS. The hepatic vasculature and its response to hepatic injury: a working hypothesis. Yale J Biol Med. 1977;50(5):497–506. [PMC free article] [PubMed] [Google Scholar]
- Wong J, et al. A minimal role for selectins in the recruitment of leukocytes into the inflamed liver microvasculature. J Clin Invest. 1997;99(11):2782–2790. doi: 10.1172/JCI119468. [DOI] [PMC free article] [PubMed] [Google Scholar]
- Bonder CS, et al. Essential role for neutrophil recruitment to the liver in concanavalin A-induced hepatitis. J Immunol. 2004;172(1):45–53. doi: 10.4049/jimmunol.172.1.45. [DOI] [PubMed] [Google Scholar]
- Xu C, Zipfel W, Shear JB, Williams RM, Webb WW. Multiphoton fluorescence excitation: new spectral windows for biological nonlinear microscopy. Proc Natl Acad Sci U S A. 1996;93(20):10763–10768. doi: 10.1073/pnas.93.20.10763. [DOI] [PMC free article] [PubMed] [Google Scholar]
- Centonze VE, White JG. Multiphoton excitation provides optical sections from deeper within scattering specimens than confocal imaging. Biophys J. 1998;75(4):2015–2024. doi: 10.1016/S0006-3495(98)77643-X. [DOI] [PMC free article] [PubMed] [Google Scholar]
- Amore JD, et al. In vivo multiphoton imaging of a transgenic mouse model of Alzheimer disease reveals marked thioflavine-S-associated alterations in neurite trajectories. J Neuropathol Exp Neurol. 2003;62(2):137–145. doi: 10.1093/jnen/62.2.137. [DOI] [PubMed] [Google Scholar]
- Hickey MJ, Westhorpe CLV. Imaging inflammatory leukocyte recruitment in kidney, lung and liver--challenges to the multi-step paradigm. Immunol Cell Biol. 2013;91(4):281–289. doi: 10.1038/icb.2012.83. [DOI] [PubMed] [Google Scholar]
- McLellan ME, Kajdasz ST, Hyman BT, Bacskai BJ. In vivo imaging of reactive oxygen species specifically associated with thioflavine S-positive amyloid plaques by multiphoton microscopy. J Neurosci. 2003;23(6):2212–2217. doi: 10.1523/JNEUROSCI.23-06-02212.2003. [DOI] [PMC free article] [PubMed] [Google Scholar]
- Geissmann F, et al. Intravascular Immune Surveillance by CXCR6+ NKT Cells Patrolling Liver Sinusoids. PLoS Biology. 2005;3(4) doi: 10.1371/journal.pbio.0030113. [DOI] [PMC free article] [PubMed] [Google Scholar]
- Velázquez P, et al. Cutting edge: activation by innate cytokines or microbial antigens can cause arrest of natural killer T cell patrolling of liver sinusoids. J Immunol. 2008;180(4):2024–2028. doi: 10.4049/jimmunol.180.4.2024. [DOI] [PubMed] [Google Scholar]
- Wehr A, et al. Chemokine receptor CXCR6-dependent hepatic NK T Cell accumulation promotes inflammation and liver fibrosis. J Immunol. 2013;190(10):5226–5236. doi: 10.4049/jimmunol.1202909. [DOI] [PubMed] [Google Scholar]
- Khandoga A, Hanschen M, Kessler JS, Krombach F. CD4+ T cells contribute to postischemic liver injury in mice by interacting with sinusoidal endothelium and platelets. Hepatology. 2006;43(2):306–315. doi: 10.1002/hep.21017. [DOI] [PubMed] [Google Scholar]
- Egen JG, et al. Macrophage and T cell dynamics during the development and disintegration of mycobacterial granulomas. Immunity. 2008;28(2):271–284. doi: 10.1016/j.immuni.2007.12.010. [DOI] [PMC free article] [PubMed] [Google Scholar]
- Beattie L, et al. Leishmania donovani-induced expression of signal regulatory protein alpha on Kupffer cells enhances hepatic invariant NKT-cell activation. Eur J Immunol. 2010;40(1):117–123. doi: 10.1002/eji.200939863. [DOI] [PMC free article] [PubMed] [Google Scholar]
- Beattie L, et al. Dynamic imaging of experimental Leishmania donovani-induced hepatic granulomas detects Kupffer cell-restricted antigen presentation to antigen-specific CD8 T cells. PLoS Pathog. 2010;6(3):e1000805. doi: 10.1371/journal.ppat.1000805. [DOI] [PMC free article] [PubMed] [Google Scholar]
- McDonald B, et al. Intravascular danger signals guide neutrophils to sites of sterile inflammation. Science. 2010;330(6002):362–366. doi: 10.1126/science.1195491. [DOI] [PubMed] [Google Scholar]
- Vanheule E, et al. An intravital microscopic study of the hepatic microcirculation in cirrhotic mice models: relationship between fibrosis and angiogenesis. Int J Exp Pathol. 2008;89(6):419–432. doi: 10.1111/j.1365-2613.2008.00608.x. [DOI] [PMC free article] [PubMed] [Google Scholar]
- Jenne CN, Kubes P. Immune surveillance by the liver. Nat Immunol. 2013;14(10):996–1006. doi: 10.1038/ni.2691. [DOI] [PubMed] [Google Scholar]
- Zimmermann HW, Tacke F. Modification of chemokine pathways and immune cell infiltration as a novel therapeutic approach in liver inflammation and fibrosis. Inflamm Allergy Drug Targets. 2011;10(6):509–536. doi: 10.2174/187152811798104890. [DOI] [PubMed] [Google Scholar]
- Kim JV, et al. Two-photon laser scanning microscopy imaging of intact spinal cord and cerebral cortex reveals requirement for CXCR6 and neuroinflammation in immune cell infiltration of cortical injury sites. J Immunol Methods. 2010;352(1-2):89–100. doi: 10.1016/j.jim.2009.09.007. [DOI] [PMC free article] [PubMed] [Google Scholar]
- Karlmark KR, et al. Hepatic recruitment of the inflammatory Gr1+ monocyte subset upon liver injury promotes hepatic fibrosis. Hepatology. 2009;50(1):261–274. doi: 10.1002/hep.22950. [DOI] [PubMed] [Google Scholar]
- Heymann F, et al. Hepatic macrophage migration and differentiation critical for liver fibrosis is mediated by the chemokine receptor C-C motif chemokine receptor 8 in mice. Hepatology. 2012;55(3):898–909. doi: 10.1002/hep.24764. [DOI] [PMC free article] [PubMed] [Google Scholar]
- Ramachandran P, et al. Differential Ly-6C expression identifies the recruited macrophage phenotype, which orchestrates the regression of murine liver fibrosis. Proc Natl Acad Sci U S A. 2012;109(46):E3186–E3195. doi: 10.1073/pnas.1119964109. [DOI] [PMC free article] [PubMed] [Google Scholar]
- Moles A, et al. A TLR2/S100A9/CXCL-2 signaling network is necessary for neutrophil recruitment in acute and chronic liver injury in the mouse. J Hepatol. 2014;60(4):782–791. doi: 10.1016/j.jhep.2013.12.005. [DOI] [PMC free article] [PubMed] [Google Scholar]
- Hammerich L, et al. Chemokine receptor CCR6-dependent accumulation of γδ T cells in injured liver restricts hepatic inflammation and fibrosis. Hepatology. 2014;59(2):630–642. doi: 10.1002/hep.26697. [DOI] [PMC free article] [PubMed] [Google Scholar]
- Syn W-K, et al. NKT-associated hedgehog and osteopontin drive fibrogenesis in non-alcoholic fatty liver disease. Gut. 2012;61(9):1323–1329. doi: 10.1136/gutjnl-2011-301857. [DOI] [PMC free article] [PubMed] [Google Scholar]
- McDonald B, et al. Interaction of CD44 and hyaluronan is the dominant mechanism for neutrophil sequestration in inflamed liver sinusoids. J Exp Med. 2008;205(4):915–927. doi: 10.1084/jem.20071765. [DOI] [PMC free article] [PubMed] [Google Scholar]
- Egen JG, et al. Intravital imaging reveals limited antigen presentation and T cell effector function in mycobacterial granulomas. Immunity. 2011;34(5):807–819. doi: 10.1016/j.immuni.2011.03.022. [DOI] [PMC free article] [PubMed] [Google Scholar]
- Singer G, Stokes KY, Granger DN. Hepatic microcirculation in murine sepsis: role of lymphocytes. Pediatr Surg Int. 2008;24(1):13–20. doi: 10.1007/s00383-007-2037-0. [DOI] [PubMed] [Google Scholar]
- Phillipson M, Kubes P. The neutrophil in vascular inflammation. Nat Med. 2011;17(11):1381–1390. doi: 10.1038/nm.2514. [DOI] [PMC free article] [PubMed] [Google Scholar]
- Khandoga AG, et al. In vivo imaging and quantitative analysis of leukocyte directional migration and polarization in inflamed tissue. PLoS One. 2009;4(3):e4693. doi: 10.1371/journal.pone.0004693. [DOI] [PMC free article] [PubMed] [Google Scholar]


