Abstract
The cell tropism of human noroviruses and the development of an in vitro infection model remain elusive. Although susceptibility to individual human norovirus strains correlates with an individual’s histo-blood group antigen (HBGA) profile, the biological basis of this restriction is unknown. We demonstrate that human and mouse noroviruses infected B cells in vitro and likely in vivo. Human norovirus infection of B cells required the presence of HBGA-expressing enteric bacteria. Furthermore, mouse norovirus replication was reduced in vivo when the intestinal microbiota was depleted by means of oral antibiotic administration. Thus, we have identified B cells as a cellular target of noroviruses and enteric bacteria as a stimulatory factor for norovirus infection, leading to the development of an in vitro infection model for human noroviruses.
Noroviruses (NoVs) are nonenveloped plusstrand RNA viruses that are the leading cause of epidemic and sporadic gastroenteritis (1–5). The cellular tropism of human NoVs (HuNoVs), and thus the development of a cultivation system for their in vitro propagation, has long eluded the NoV research community (6–11). Several pieces of data led us to ask whether NoVs can infect B cells. First, interferondeficient and interleukin 10–deficientmice infected with a mouse NoV (MuNoV) contained viruspositive cells in the B cell zones of Peyer’s patches (12, 13). Second, MuNoV-infected Rag1−/− mice (which lack B and T cells) and B cell–deficient mice had reduced virus titers compared with those of wild-type mice, suggesting the absence of a target cell (14). Last, chimpanzees infected with a HuNoV contained capsid protein–positive duodenal B cells (15). Thus, in this study we probed whether NoVs infect B cells.
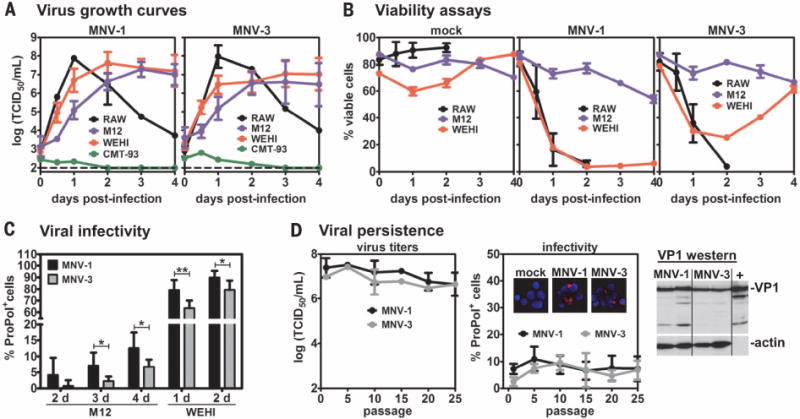
To investigate whether MuNoVs infect B cells in culture, M12 and WEHI-231 mouse B cell lines were infected with either MNV-1 or MNV-3. These two MuNoV strains were selected because they display numerous pathogenic distinctions. Specifically, MNV-1 establishes an acute infection, whereas MNV-3 establishes persistence (16–18); MNV-3 is attenuated compared with MNV-1 (19); and MNV-3 elicits more robust protective immunity than does MNV-1 (14). Both MuNoV strains replicated efficiently in the B cell lines, although peak titers were reached ~1 day later than in mouse RAW264.7 macrophages, a cell line known to be permissive to MuNoVs (Fig. 1A) (20). The mouse intestinal epithelial CMT-93 cell line was nonpermissive. Synthesis of viral proteins—as measured by means of Western blot analysis of the viral RNA-dependent RNA polymerase (RdRp), the VP1 capsid protein, and the VP2 minor structural protein—also reflected the slower replication of MuNoVs in B cells as compared with macrophages (fig. S1). MuNoV infection of M12 cells did not result in visible cytopathic effect (CPE), a finding that was confirmed by using propidium iodide staining (Fig. 1B) and trypan blue exclusion. In contrast, MuNoV infection of WEHI-231 cells resulted in visible CPE and loss of cell viability. This difference in infection outcome may relate to the distinct nature of the B cell lines considering that WEHI-231 cells are immature B cells, whereas M12 cells are mature B cells. Whereas MNV-1 infection resulted in complete loss of viability in WEHI-231 cells, MNV-3 infection resulted in a transient loss of ~60% of cells followed by recovery of the culture. Consistent with this, at 2 to 4 days post infection (dpi) actin was undetectable in MNV-1–infected, but not MNV-3–infected, WEHI-231 cells (fig. S1).
Fig. 1. MuNoVs infect B cells in culture.

(A) The indicated mouse cell lines were infected with MNV-1 (left) or MNV-3 (right) at multiplicity of infection (MOI) 5 and virus growth curves determined by using standard TCID50 assay. The limit of detection is indicated by a dashed line. (B) The indicated cell lines were mock-inoculated (left) or infected with MNV-1 (middle) or MNV-3 (right) at MOI 5, and cell viability was determined at various times after infection by using propidium iodide staining. (C) M12 or WEHI-231 cells were infected with MNV-1 (black bars) or MNV-3 (gray bars) at MOI 20 for M12 cells or MOI 5 for WEHI-231 cells. At the indicated dpi on the x axis, cells were stained with antibody to ProPol and 4′,6-diamidino-2-phenylindole (DAPI) and imaged on a fluorescent microscope. The percentage of virally infected cells in each cell line was then quantified as the average ratio of ProPol+ cells per total cells. (D) Duplicate wells of M12 cells were infected with MNV-1 (black line) or MNV-3 (gray line) at MOI 5 and passaged every 2 days. At the first passage and every fifth passage, the virus titers in the supernatants were determined by using a standard TCID50 assay (left). A portion of these cultures were analyzed by means of immunofluorescence assay for infectivity rates (middle). (Inset) Representative images merging the viral ProPol signal (red) and the DAPI staining of nuclei (blue) are shown from passage 10 (P10) cultures. A representative Western blot of cell lysates from persistently MNV-1– or MNV-3– infected M12 cultures (two independent cultures per virus strain) generated at passage 23 (P23) is shown. The MNV-1 virus stock used for initial infections was also tested (labeled as “+”). The blot was probed with antibody to VP1 and reprobed for actin as a loading control. For all, n = 3 to 5 experimental repeats. Error bars denote mean ± SD; Student’s t test in (C), *P < 0.05, **P < 0.01, ***P < 0.001.
To determine percent infectivity, cells were stained for the MuNoV protease-RdRp (ProPol) nonstructural proteins. Although 80 to 90% of RAW264.7 and WEHI-231 cells were productively infected, only 5 to 15% of M12 cells were productively infected (Fig. 1C and fig. S2). To determine whether M12 cultures cleared this low-level infection or instead became persistently infected, we measured virus titers in supernatant fluid after repeated passaging of infected cultures. We consistently detected 106 to 107 median tissure culture infectious dose (TCID50)/mL of each virus in the supernatant through 25 culture passages, which correlated with consistent low infection frequency and positive staining for the viral VP1 protein (Fig. 1D). Similarly, MNV-3 established persistent infection in WEHI-231 cells after the initial drop in cell viability. Thus, MuNoVs can persistently infect B cells in culture.
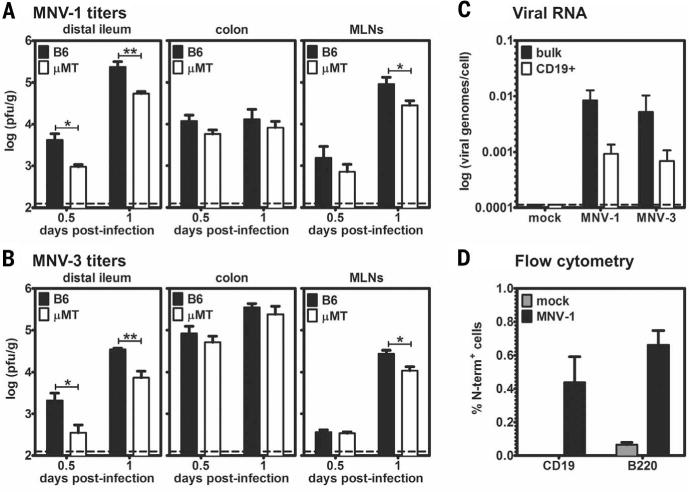
We used several complementary approaches to confirm that B cells are bona fide NoV targets in vivo. First, MNV-1 and MNV-3 titers were significantly reduced in the distal ileum and mesenteric lymph nodes (MLNs) of B cell–deficient mice (μMT mice) as compared with B6 mice (Fig. 2, A and B). To test whether the reduced virus titers in μMT mice reflected decreased viral replication or increased clearance of input virus, we infected mice with light-sensitive MNV-1 to allow differentiation between input and newly replicated virus [this assay, along with complete methods, are described in (21)]. No significant differences in the ratio of light-insensitive (newly replicated) to total virus titers were observed between B6 and μMT mice (fig. S3A), demonstrating that B cells are required for optimal viral replication in vivo. Further supporting in vivo B cell infection, B cells purified from Peyer’s patches of wild-type B6 mice contained viral genomes (Fig. 2C). Although MuNoV nonstructural protein expression has not been demonstrable in any cell type from in vivo samples of wild-type animals, we did observe viral nonstructural protein in B cells from Peyer’s patches of Stat1−/− mice, in which MuNoVs achieve higher titers (Fig. 2D). Together, these findings suggest that B cells are infected in vivo during NoV infections.
Fig. 2. MuNoVs target Peyer’s patch B cells.

(A and B) Groups (n = 5 mice) of B6 mice (black bars) and μMT mice (white bars) were infected with 107 TCID50 units (A) MNV-1 or (B) MNV-3 and harvested at 0.5 or 1 dpi. Virus titers were determined by performing plaque assay on homogenates of the indicated tissues. The data are presented as plaque-forming units (PFU) per gram of tissue on a logarithmic scale, and data for all mice in each group were averaged (n = 2 experiments). Limits of detection are indicated by dashed lines. Error bars denote mean ± SD; Student’s t test, *P < 0.05, **P < 0.01, ***P < 0.001. (C) Groups of B6 mice (n = 8 mice) were inoculated with either mock inoculum or 107 TCID50 units MNV-1 or MNV-3. At 1 dpi, Peyer’s patches were harvested, and quantitative reverse transcription polymerase chain reaction (RT-PCR) was performed on bulk cells (black bars) and purified CD19+ cells (white bars) by using virus ORF1-specific primers (n = 5 experiments). Data are reported as viral genomes per cell on a logarithmic scale. The limit of detection is indicated by a dashed line. (D) Stat1−/− mice (n = 2 mice) were inoculated with mock inoculum (gray bars) or 107 TCID50 units MNV-1 (black bars). Intracellular staining for the MNV-1 nonstructural N-term protein was performed on B cells isolated from Peyer’s patches. CD19 or B220 are markers of B cells. Portions of cells were stained with preimmune sera in place of antibody to N-term as a background control. Data are presented as the percentage of B cells stained by N-term subtracted by the percentage of B cells stained by preimmune sera (n = 3 experiments).
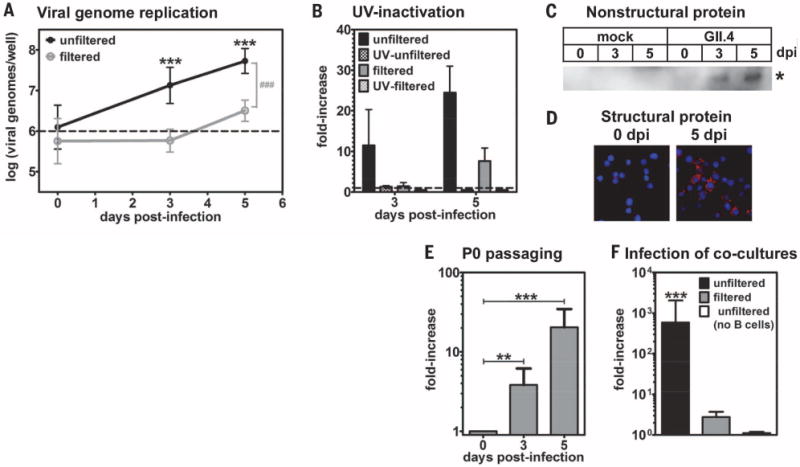
On the basis of our observations with MuNoVs, we asked whether HuNoVs infect B cells. The currently dominant HuNoV strain circulating worldwide is a genogroup II, genotype 4 (GII.4) strain called GII.4-Sydney (22, 23). When a GII.4-Sydney HuNoV-positive stool sample was inoculated onto the BJAB human B cell line, there was a significant 10-fold and 25-fold increase in viral genome copy number at 3 and 5 dpi, respectively, compared with input levels (Fig. 3, A and B, and fig. S4). Genome replication was not observed when the stool sample was ultraviolet (UV)–inactivated before inoculation. Filtration of the HuNoV-positive stool sample over a 0.2- μm membrane decreased genome replication, suggesting the presence of a filterable cofactor (Fig. 3, A and B). Viral nonstructural and structural proteins were detected in cells inoculated with unfiltered stool inoculum by using Western blotting and immunofluorescence assay, respectively (Fig. 3, C and D), although BJAB cultures were not persistently infected (figs. S5 and S6). To determine whether viral genome replication and protein synthesis in BJAB cells were indicative of productive infection, lysates from BJAB cultures at 3 dpi were passaged onto naïve BJAB cells (fig. S5). HuNoV genomes increased fourfold and 20-fold at 3 and 5 dpi, respectively, after inoculation with passage 0 (P0) virus (Fig. 3E), indicating that primary BJAB infection results in the production of new infectious virus particles.
Fig. 3. HuNoVs productively infect B cells in culture.

(A) A GII.4-Sydney HuNoV-positive stool sample was inoculated onto human BJAB B cells (black line) or filtered through a 0.2- μm filter before application (gray line). The inoculum contained 1 × 10⁶ genome copy numbers, indicated by a dashed line. Viral genome copy numbers per well were determined by means of genogroup II-specific quantitative RT-PCR (n = 12 experiments). The 3- and 5-dpi genome copy numbers were compared with 0 dpi under each condition for statistical purposes, indicated by asterisks. The unfiltered and filtered data sets were statistically different from each other at 3 and 5 dpi, as indicated by the gray pound sign, but not at 0 dpi. (B) 1 × 10⁶ genome copy numbers of unfiltered (black bars) or filtered (gray bars) stool inoculum was untreated (solid bars) or UV-treated (hatched bars) before inoculation onto B cells. Samples were analyzed as described above, and data were reported as the fold-increase in viral genome copy numbers from 0 to 3 or 5 dpi (n = 3 experiments). (C and D) Mock inoculum or 5 × 10⁵ genome copy numbers of unfiltered GII.4-Sydney HuNoV-positive stool was applied to BJAB cells, and the cells were washed after 2 hours. (C) Cell lysates were tested in Western blotting by using a polyclonal antibody to NS6. The asterisk indicates a band of the expected size for the HuNoV NS5-NS6 processing intermediate (35 kD) that was only observed in infected cells at 3 to 5 dpi. No mature NS6 protein was detected, which is consistent with a report demonstrating that the NS5-NS6 cleavage site of a HuNoV is processed very inefficiently by the viral protease (33). (D) Cells were stained with antibody to VP1 (red) and DAPI (blue) and imaged on a fluorescent microscope. No VP1 signal was detected in mock-inoculated cells at 5 dpi, nor infected cells stained with an isotype control antibody. (E) 5 × 10⁵ genome copy numbers of a P0 inoculum was passaged onto naïve BJABs. At 0, 3, and 5 dpi, wells were collected and analyzed by means of genogroup II-specific quantitative RT-PCR (n = 4 experiments). The data are presented as the fold-increase in genomes from 0 to 3 or 5 dpi. The genome copy numbers detected at each time point were compared with 0 dpi for statistical purposes, indicated by black asterisks. (F) 1 × 10⁶ genome equivalents of the unfiltered (black bars) or filtered (gray bars) GII.4-Sydney HuNoV-positive stool sample were applied to the apical side of a transwell with polarized HT-29 IECs grown on the membrane and BJAB B cells cultured in the basal compartment. At 0 and 3 dpi, the basal compartment was collected for viral genome analysis by means of quantitative RT-PCR (n = 5 experiments). The data are presented as the fold-increase in genomes from 0 to 3 dpi. In two experiments, unfiltered stool was applied to a coculture with no cells in the basal chamber as a control (white bars). The 3-dpi genome copy numbers were compared with 0 dpi under each condition for statistical purposes, indicated by black asterisks. Similar coculture results were obtained by using another GII.4-Sydney HuNoV-positive stool sample. For all, error bars denote mean ± SD; Student’s t test, *P < 0.05, **P < 0.01, ***P < 0.001.
Because NoVs must breach the intestinal epithelium in order to access target B cells, we also tested HuNoV infection in a coculture system with polarized HT-29 intestinal epithelial cells (IECs). GII.4-Sydney HuNoV-positive stool was applied into the apical supernatant fluid of HT-29 IECs grown on a transwell with BJAB B cells in the basal chamber. A nearly 600-fold increase in viral genome copy number was detected in the B cell fraction of infected cultures at 3 dpi when unfiltered inoculum was tested (Fig. 3F). No increase was detected in the basal chamber in the absence of B cells. Moreover, filtration of the stool sample ablated B cell–associated viral genome replication, which is consistent with results in direct B cell infections.
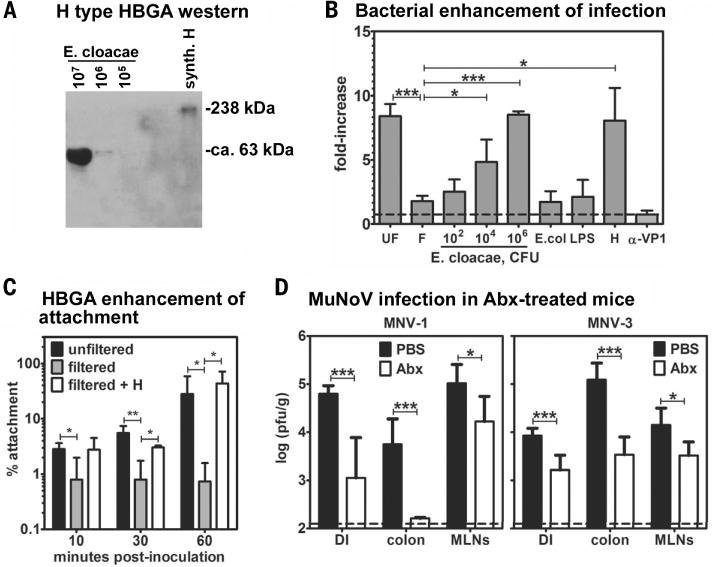
On the basis of the reduced B cell infectivity we observed in filtered stool samples, we tested whether enteric bacteria could serve as a cofactor to facilitate HuNoV infection of B cells. HuNoVs are well known to bind histo-blood group antigens (HBGAs) (24, 25), which are expressed by the host as well as by certain bacteria (26–28). We first tested Enterobacter cloacae because it expresses H type HBGA (Fig. 4A) that the GII.4-Sydney HuNoV strain can bind (29). Filtered stool containing GII.4-Sydney virus displayed a dose-dependent restoration of infectivity when incubated with E. cloacae before inoculation of BJAB B cells (Fig. 4B). Neither Escherichia coli (which did not express H antigen) nor lipopolysaccharide (LPS, a component of the outer membrane of Gram-negative bacteria) rescued infectivity, whereas synthetic H antigen restored infectivity of filtered stool comparably with E. cloacae. Antibody to VP1 neutralized infectivity of the unfiltered stool, as expected. Providing insight into the mechanism of H antigen–mediated stimulation, filtration of GII.4-Sydney HuNoV-positive stool inoculum ablated virus attachment to B cells, and synthetic H antigen was sufficient to restore attachment (Fig. 4C). Overall, these results demonstrate that HuNoV interactions with enteric bacteria, likely through binding to bacterially expressed HBGAs, facilitate productive attachment to, and infection of, B cells.
Fig. 4. Intestinal bacteria facilitate NoV infections.

(A) Lysates were prepared from the indicated colony-forming units (CFU) of heat-killed E. cloacae for the purpose of Western blotting. Membranes were probed with antibody to H antigen. Synthetic H-type HBGA (synth. H) was tested as a positive control. No H-type HBGA was detected in E. coli lysates or BJAB cell lysates. (B) Filtered GII.4-Sydney HuNoV-positive stool inoculum was incubated with the indicated dose of heat-killed E. cloacae, 106 CFU heat-killed E. coli, 1 mg/mL E. coli LPS, or 500 ng/mL synthetic H-type HBGA before inoculation onto B cells. To test for antibody-mediated neutralization of virus infectivity, unfiltered stool inoculum was incubated with 10 μg/mL antibody to VP1 before B cell inoculation. Viral genome copy numbers were determined at 0 and 3 dpi under each condition (n = 3 to 4 experiments). Data are reported as the fold-increase in copy numbers over time. Each condition was compared with the untreated filtered inoculum data set for statistical purposes. (C) Unfiltered stool (black bars), filtered stool (gray bars), or filtered stool preincubated with 500 ng/mL H antigen (white bars) was inoculated onto BJAB cells for the indicated times at 4°C (n = 4 experiments). Viral genome copy numbers were quantified from unwashed cells to determine the amount of input virus and from washed cells to determine the amount of cell-attached virus. Data are reported as the percent of viral genomes remaining cell-associated compared with input. (D) Groups of phosphate-buffered saline (PBS)–treated (black bars) and Abx-treated (white bars) B6 mice (n = 3 to 4 mice) were infected with 107 TCID50 units MNV-1 (left) or MNV-3 (right). At 1 dpi, virus was titered from the distal ileum (DI), colon, and mesenteric lymph nodes (MLNs) by using a standard virus plaque assay (n = 3 experiments). PBS-treated and Abx-treated groups under each condition were compared for statistical purposes. For all, error bars denote mean ± SD; Student’s t test, *P < 0.05, **P < 0.01, ***P < 0.001.
To examine whether intestinal bacteria contribute to NoV infection in vivo, we depleted the intestinal microbiota of wild-type B6 mice before MuNoV infection (fig. S7). Indeed, antibiotic depletion of normal intestinal flora resulted in a significant reduction in MuNoV titers (Fig. 4D), demonstrating a biologically substantial role for enteric bacteria during NoV infection. These reduced titers reflected decreased viral replication because the ratio of replicated to input virus was similar between antibiotic-treated and control mice (fig. S3B). These collective data are consistent with recent studies of other viruses that have been shown to exploit commensal bacteria for optimal infection, and in particular with the ability of bacterial LPS to stimulate poliovirus attachment to permissive cells (30–32).
We have developed a cell culture system for a HuNoV by revealing that the current globally dominant GII.4-Sydney HuNoV strain infects human B cells. This infection is substantially enhanced by free HBGA or by HBGA-expressing bacteria. It is thus likely that previous attempts to culture HuNoVs failed because of the nature of the cell type tested and the absence of stimulatory carbohydrate molecules. Animal studies of the related MuNoVs validate that intestinal B cells are in vivo targets of NoVs and that enteric bacteria are required for efficient infection of susceptible hosts.
Supplementary Material
Acknowledgments
We thank R. Condit, G. McFadden, and H. Virgin for critical discussions and reading of the manuscript. We thank R. Renne and F. Zhu for providing cell lines and J. Pfeiffer for mouse antibiotic depletion protocols. The data presented in this manuscript are tabulated in the main paper and in the supplementary materials. The findings and conclusions in this article are those of the authors and do not necessarily represent the official position of the Centers for Disease Control and Prevention. This work was funded by NIH R01 AI080611 and R21 AI103961 for C.E.W; and National Institute of Food and Agriculture 2011-68003-30395 for J.V. C.L.G. was supported in part by NIH/National Institute of Dental and Craniofacial Research T90 DE021990-02 (Burne). A patent application pertinent to this work has been filed (U.S. patent application no. 61/992,040: Methods and Compositions for Caliciviridae, M.J. and S.K. as inventors).
Footnotes
REFERENCE AND NOTES
- 1.Payne DC, et al. N Engl J Med. 2013;368:1121–1130. doi: 10.1056/NEJMsa1206589. [DOI] [PMC free article] [PubMed] [Google Scholar]
- 2.Koo HL, Ajami N, Atmar RL, DuPont HL. Discov Med. 2010;10:61–70. [PMC free article] [PubMed] [Google Scholar]
- 3.Patel MM, et al. Emerg Infect Dis. 2008;14:1224–1231. doi: 10.3201/eid1408.071114. [DOI] [PMC free article] [PubMed] [Google Scholar]
- 4.Glass RI, Parashar UD, Estes MK. N Engl J Med. 2009;361:1776–1785. doi: 10.1056/NEJMra0804575. [DOI] [PMC free article] [PubMed] [Google Scholar]
- 5.Siebenga JJ, et al. J Infect Dis. 2009;200:802–812. doi: 10.1086/605127. [DOI] [PubMed] [Google Scholar]
- 6.Duizer E, et al. J Gen Virol. 2004;85:79–87. doi: 10.1099/vir.0.19478-0. [DOI] [PubMed] [Google Scholar]
- 7.Lay MK, et al. Virology. 2010;406:1–11. doi: 10.1016/j.virol.2010.07.001. [DOI] [PMC free article] [PubMed] [Google Scholar]
- 8.Papafragkou E, Hewitt J, Park GW, Greening G, Vinjé J. PLOS ONE. 2013;8:e63485. doi: 10.1371/journal.pone.0063485. [DOI] [PMC free article] [PubMed] [Google Scholar]
- 9.Herbst-Kralovetz MM, et al. Emerg Infect Dis. 2013;19:431–438. doi: 10.3201/eid1903.121029. [DOI] [PMC free article] [PubMed] [Google Scholar]
- 10.Straub TM, et al. Emerg Infect Dis. 2007;13:396–403. doi: 10.3201/eid1303.060549. [DOI] [PMC free article] [PubMed] [Google Scholar]
- 11.Takanashi S, et al. Arch Virol. 2014;159:257–266. doi: 10.1007/s00705-013-1806-4. [DOI] [PMC free article] [PubMed] [Google Scholar]
- 12.Mumphrey SM, et al. J Virol. 2007;81:3251–3263. doi: 10.1128/JVI.02096-06. [DOI] [PMC free article] [PubMed] [Google Scholar]
- 13.Basic M, et al. Inflamm Bowel Dis. 2014;20:431–443. doi: 10.1097/01.MIB.0000441346.86827.ed. [DOI] [PubMed] [Google Scholar]
- 14.Zhu S, et al. PLOS Pathog. 2013;9:e1003592. doi: 10.1371/journal.ppat.1003592. [DOI] [PMC free article] [PubMed] [Google Scholar]
- 15.Bok K, et al. Proc Natl Acad Sci USA. 2011;108:325–330. doi: 10.1073/pnas.1014577107. [DOI] [PMC free article] [PubMed] [Google Scholar]
- 16.Thackray LB, et al. J Virol. 2007;81:b10460–10473. [Google Scholar]
- 17.Arias A, Bailey D, Chaudhry Y, Goodfellow I. J Gen Virol. 2012;93:1432–1441. doi: 10.1099/vir.0.042176-0. [DOI] [PMC free article] [PubMed] [Google Scholar]
- 18.Hsu CC, Riley LK, Wills HM, Livingston RS. Comp Med. 2006;56:247–251. [PubMed] [Google Scholar]
- 19.Kahan SM, et al. Virology. 2011;421:202–210. doi: 10.1016/j.virol.2011.09.030. [DOI] [PMC free article] [PubMed] [Google Scholar]
- 20.Wobus CE, et al. PLOS Biol. 2004;2:e432. doi: 10.1371/journal.pbio.0020432. [DOI] [PMC free article] [PubMed] [Google Scholar]
- 21.Materials and methods are available as supplementary materials on Science Online.
- 22.van Beek J, et al. Eurosurveillance. 2013 available at www.eurosurveillance.org/ViewArticle.aspx?ArticleId=20345.
- 23.Eden JS, Tanaka MM, Boni MF, Rawlinson WD, White PA. J Virol. 2013;87:6270–6282. doi: 10.1128/JVI.03464-12. [DOI] [PMC free article] [PubMed] [Google Scholar]
- 24.Marionneau S, et al. Gastroenterology. 2002;122:1967–1977. doi: 10.1053/gast.2002.33661. [DOI] [PMC free article] [PubMed] [Google Scholar]
- 25.Huang P, et al. J Infect Dis. 2003;188:19–31. doi: 10.1086/375742. [DOI] [PubMed] [Google Scholar]
- 26.Springer GF, Williamson P, Brandes WC. J Exp Med. 1961;113:1077–1093. doi: 10.1084/jem.113.6.1077. [DOI] [PMC free article] [PubMed] [Google Scholar]
- 27.Rasko DA, Wang G, Monteiro MA, Palcic MM, Taylor DE. Eur J Biochem. 2000;267:6059–6066. doi: 10.1046/j.1432-1327.2000.01683.x. [DOI] [PubMed] [Google Scholar]
- 28.Yi W, et al. J Am Chem Soc. 2005;127:2040–2041. doi: 10.1021/ja045021y. [DOI] [PubMed] [Google Scholar]
- 29.Miura T, et al. J Virol. 2013 doi: 10.1128/JVI.01060-13. [DOI] [Google Scholar]
- 30.Kuss SK, et al. Science. 2011;334:249–252. doi: 10.1126/science.1211057. [DOI] [PMC free article] [PubMed] [Google Scholar]
- 31.Kane M, et al. Science. 2011;334:245–249. doi: 10.1126/science.1210718. [DOI] [PMC free article] [PubMed] [Google Scholar]
- 32.Robinson CM, Jesudhasan PR, Pfeiffer JK. Cell Host Microbe. 2014;15:36–46. doi: 10.1016/j.chom.2013.12.004. [DOI] [PMC free article] [PubMed] [Google Scholar]
- 33.May J, Korba B, Medvedev A, Viswanathan P. Virology. 2013;444:218–224. doi: 10.1016/j.virol.2013.06.013. [DOI] [PubMed] [Google Scholar]
Associated Data
This section collects any data citations, data availability statements, or supplementary materials included in this article.


