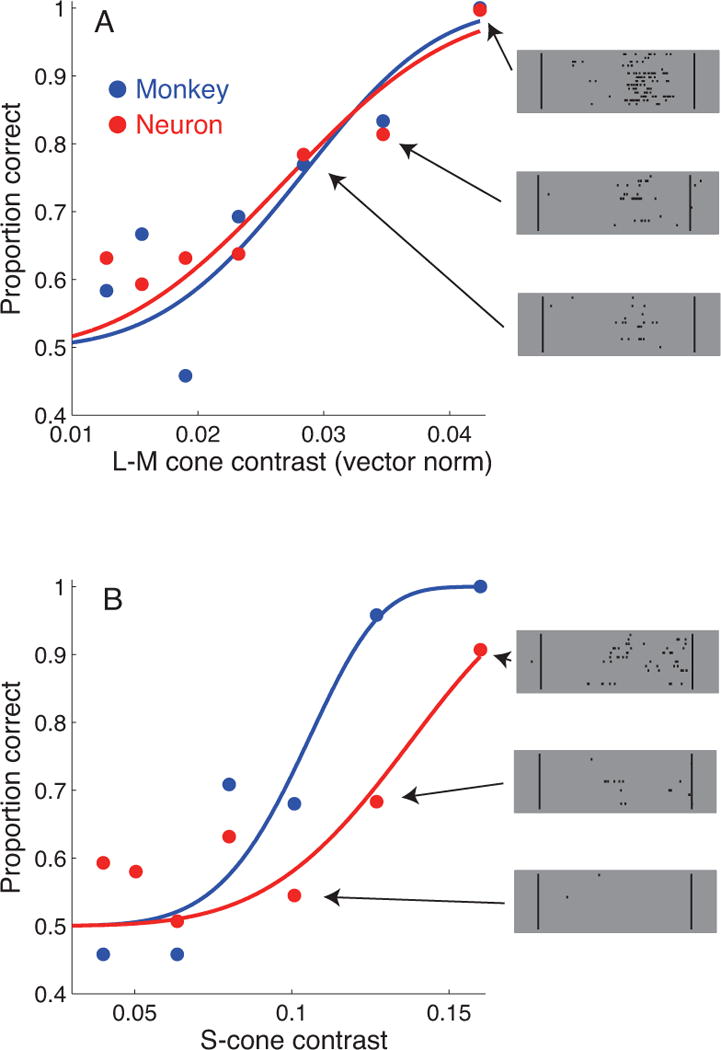
Figure 1.

Chromatic detection functions for a single V1 neuron (red) and the macaque (blue). See (Hass and Horwitz 2013) for methodological details. In randomly interleaved trials, stimulus modulations were antiphase modulations of the L- and M-cones (A) or modulations of the S-cones alone (B). Neurometric sensitivity was quantified by an ideal observer analysis on the measured spike counts. Example rasters for the three highest contrast stimuli are shown (right).
