
Figure 3.
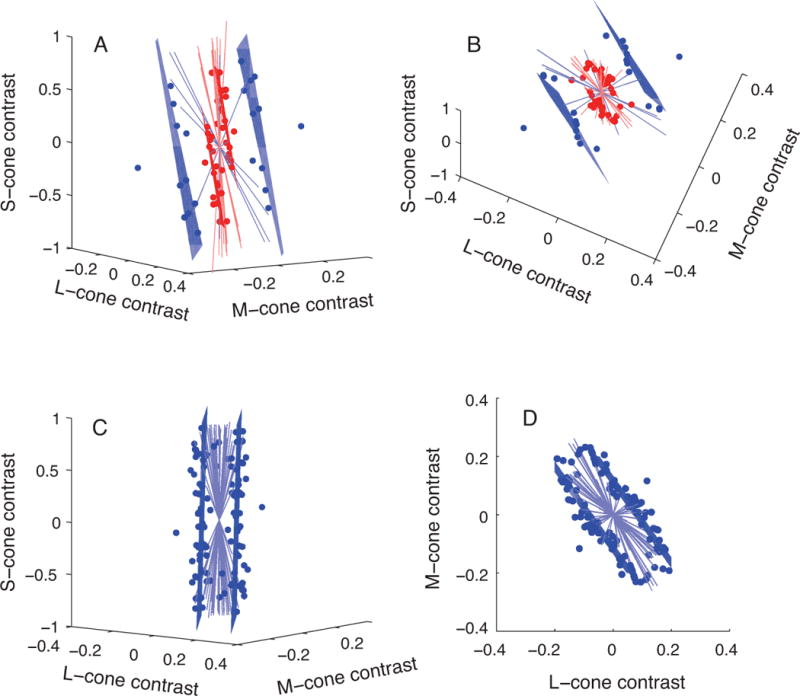
Isodetectability planes for a macaque (A & B) and a human (C & D). Blue points represent stimuli at the observer’s detection threshold, blue lines are color directions in which detection thresholds could not be measured, and planes are fits to these data. Red points and planes are redrawn from Figure 2B to illustrate the similarity in orientation between neuronal isoresponse planes and macaque isodetectability planes. Data in A & B are identical but are shown from different viewing angles (and similarly, C & D). The stimulus used in the psychophysical experiments modulated at 25 Hz for the macaque and at 15 Hz for the human.