Abstract
Thirst is the basic instinct to drink water. Previously, it was shown that neurons in several circumventricular organs (CVO) of the hypothalamus are activated by thirst-inducing conditions 1. Here, we identify two distinct, genetically-separable neural populations in the subfornical organ (SFO) that trigger or suppress thirst. We show that optogenetic activation of SFO excitatory neurons, marked by the expression of the transcription factor ETV-1, evokes intense drinking behavior, and does so even in fully water-satiated animals. The light-induced response is highly specific for water, immediate, and strictly locked to the laser stimulus. In contrast, activation of a second population of SFO neurons, marked by expression of the vesicular GABA transporter VGAT, drastically suppressed drinking, even in water-craving thirsty animals. These results reveal an innate brain circuit that can turn on and off an animal’s water-drinking behavior, and likely functions as a center for thirst control in the mammalian brain.
Body fluid homeostasis regulates the internal salt and water balance; as this balance shifts, the brain senses these changes and triggers specific goal-oriented intake behaviors 2,3. For instance, salt-deprived animals may actively consume salty solutions, even though such high levels of salt are normally strongly aversive 4,5,6. Similarly, dehydrated animals are strongly motivated to consume water 7,8. Previous studies have shown that various regions in the circumventricular organs (CVO) of the hypothalamus are activated in response to dehydration 1. In addition, intracranial injection of angiotensin, a vasoactive hormone that stimulates drinking, has been shown to activate CVO neurons in several species 9–11, and electrical stimulation of CVO nuclei increased fluid consumption in rodents 12,13.
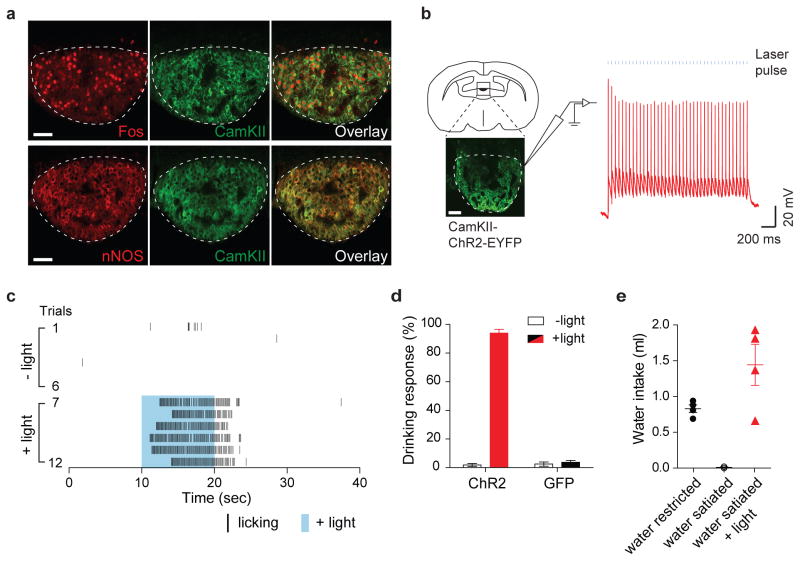
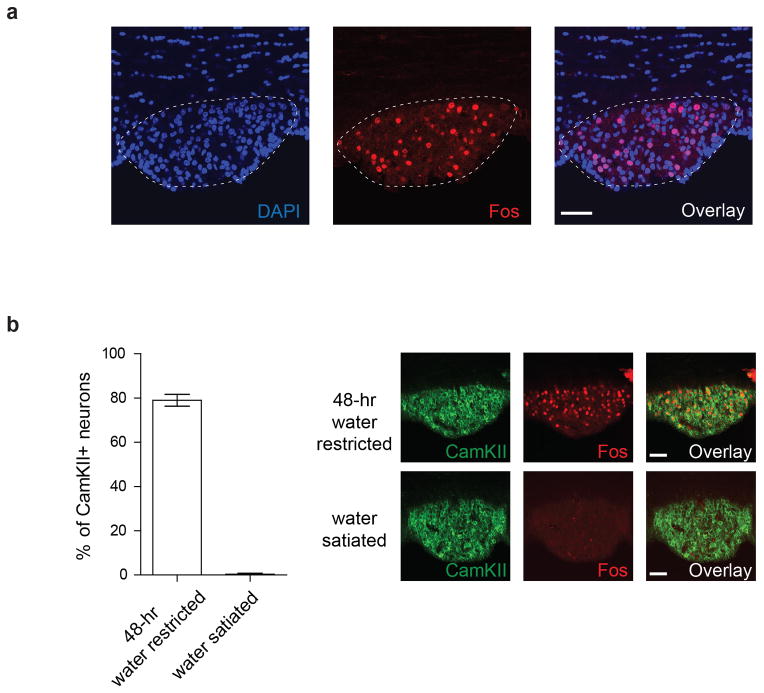
The subfornical organ (SFO) is one of several CVO nuclei activated by thirst-inducing stimuli (e.g. water-deprivation) 1,9. This nucleus lacks the normal blood brain barrier, and has been proposed to function as an osmolality sensor in the brain 1,14,15. We reasoned that if we could identify a selective population of neurons in the SFO that respond to dehydration, they might provide a genetic handle to explore the neural control of thirst and water-drinking behavior. Using Fos as a marker for neuronal activation, we found that approximately 30% of the SFO neurons are strongly labeled with Fos after a 48-hr water restriction regime (no Fos expression was observed under water-satiated conditions, Extended Data Figure 1b). Notably, essentially all of the Fos-labeled cells co-expressed Ca2+/calmodulin-dependent kinase II (CamKII; Figure 1a upper panel), a known marker of excitatory neurons (see Extended Data Figure 2), as well as neuronal nitric oxide synthase (nNOS; Figure 1a lower panel). If these SFO neurons function as key cellular switches in the circuit that drives water consumption, then their activation should trigger water-drinking responses.
Figure 1. Activation of excitatory neurons in the subfornical organs (SFO) triggers immediate drinking behavior.
(a) Water-deprivation activates CamKII/nNOS-positive neurons in the SFO. Robust Fos expression was induced in the SFO after water restriction for 48-hr. Shown are double immunolabeling for Fos and CamKII. Most Fos positive neurons co-expressed CamKII (95.9 ± 0.3%, n=3); also shown is the co-expression of CamKII with nNOS. These neurons are excitatory as they are marked by a VGlut2 trasgenic reporter 24 (Extatended Data Fig 2). (b) Whole-cell patch-clamp recording from SFO CamKII-positive neurons in acute hypothalamic slices demonstrating light-induced activation of the ChR2-expressing neurons. Shown are traces of a representative neuron subjected to 40 pulses of ChR2 excitation (20 Hz; 2 ms pulses); blue bars denote the time and duration of the light stimulus. Scale bars, 50 μm. (c) Photostimulation of CamKII-positive neurons in the SFO (trials 7–12; blue shading) triggered intense drinking; each black bar indicates an individual licking event. In the absence of light stimulation the same water-satiated animal exhibits very sparse events of drinking (trials 1–6). (d) Success of inducing drinking by photostimulation of the SFO. The Drinking Response (%) was calculated by determining the number of trials with >5 licks over the total number of trials; animals were tested for >10 trials each (see Methods for details). The panel shows animals infected with AAV-CamKIIa-ChR2-EYFP (n=10; red bar), and control mice infected with AAV-CamKIIa-GFP (n=4; black bar); white bars indicate the responses in the absence of photostimulation (Mann-Whitney test P < 0.0003). (e) Quantitation of the volume of water consumed within 15 min by 3 groups of animals: water-restricted for 48-hr, water-satiated, and water-satiated but photostimulated during the test; light (20 Hz) was delivered with a regime of 30 s ON and 30 s OFF for the entire 15 min session (n=4, Mann-Whitney test, P < 0.03 for water-satiated ± light). Values are means ± s.e.m.
To directly test this hypothesis, we utilized an optogenetic approach 16,17. We introduced ChR2 into the SFO by stereotaxic injection of an AAV-ChR2-EYFP construct under the control of the CamkIIa-promoter (Extended Data Figure 4), and examined the effect of photostimulation in awake behaving animals (Figures 1b–e). Remarkably, photoactivation of the SFO CamKII-positive neurons in vivo triggered immediate water seeking behavior followed by intensive drinking (Supplementary Video 1 and Figure 1c). This response was tightly time-locked to the onset of laser stimulation, seen as long as the light stimulus was present, and could be reliably induced in over 90% of the trials (Figure 1d). Upon termination of photostimulation the behavior quickly ceased within a few seconds; light activation of the SFO in the absence of water had no effect on future drinking responses, even if the water was delivered just seconds after the light was switched off (Extended Data Figure 5). Importantly, the light-induced drive to consume water was independent of the internal state of the animal as it was reliably evoked in fully water-satiated mice (Supplementary Video 2). Indeed, during a prolonged regime of laser stimulation water-satiated mice continue to avidly consume water, and may drink nearly 8% of their body weight within 15 min; this is similar to the water consumption seen in the unstimulated animals after 48-hr water restriction (Figure 1e). We note that light stimulation of the SFO did not induce feeding (Supplementary Video 3)
Next, we asked whether the light-induced “thirst” is selective for water. Therefore, we assessed light-dependent fluid intake using a range of test solutions. Our results (Figures 2a) show that the effect is highly specific for water, with no responses to other fluids such as mineral oil, glycerol, PEG, or even honey. Notably, light-stimulated animals refused to drink water if it contained either a bitter compound or high concentrations of salt, demonstrating that photoactivation of these SFO neurons does not bypass the natural taste-mediated functions that prevent ingestion of toxic, noxious chemicals 17,18 (Figure 2b).
Figure 2. CamKII-positive SFO neurons mediate thirst.
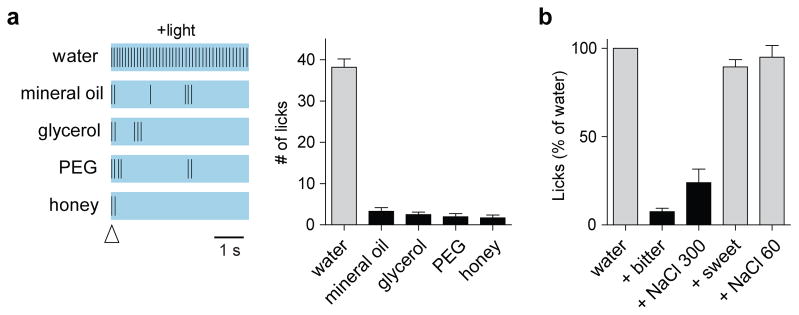
Activation of CamKII-positive neurons in the SFO drives selective drinking of water. (a) Representative raster plots illustrating licking events during a 5 s window in the presence of photostimulation; the open arrowhead indicates the first lick in each trial. The right panel shows quantification of similar data for multiple animals (n=6 for honey, and 7 for others; Mann Whitney P < 0.002); all animals were water-satiated. (b) Photostimulated animals did not drink water in the presence of a bitter compound (3 μM cycloheximide; paired t test, P < 0.0001), or high concentration of salt (300 mM; paired t test, P < 0.001), but did so in the presence of a sweet compound (30 mM sucrose), or low salt (60 mM); data were normalized to the number of licks to water alone. Values are means ± s.e.m (n=5 animals)
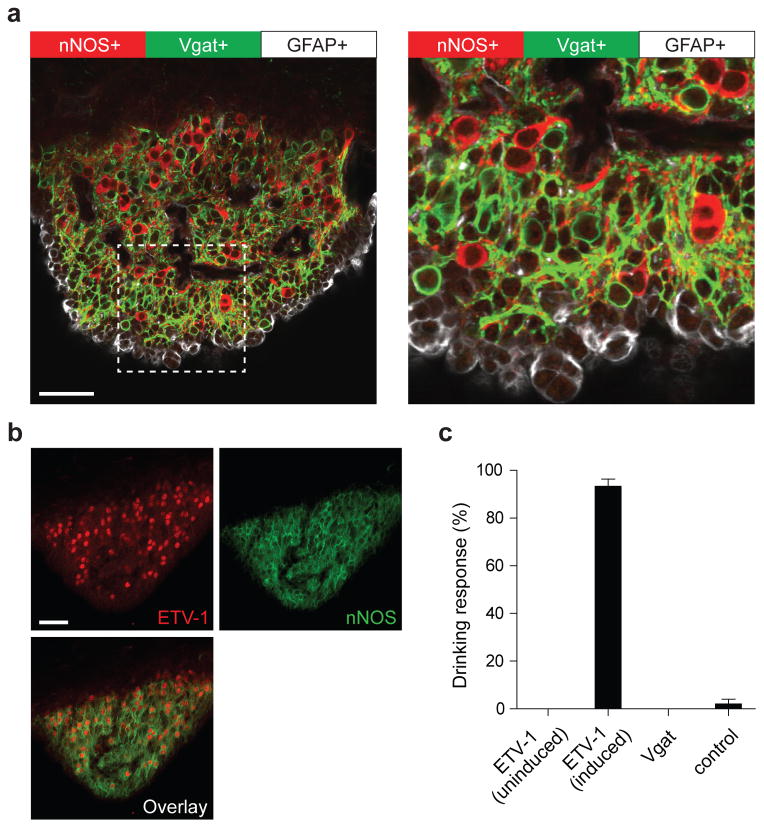
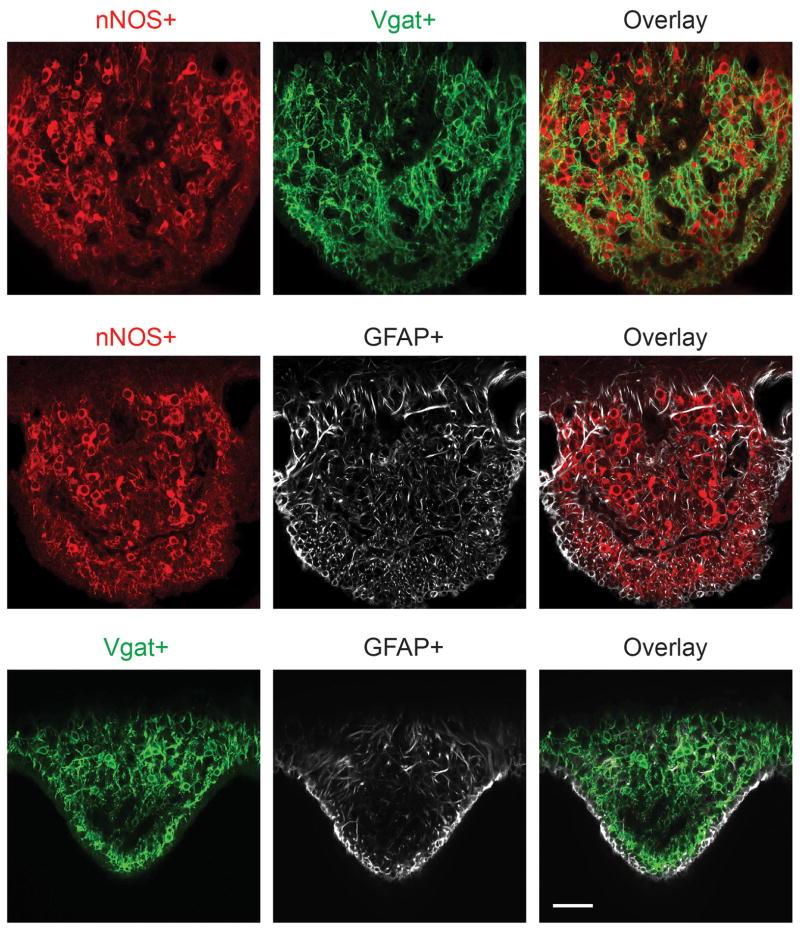
We identified three genetically separable, non-overlapping populations in the SFO (Figures 3a-b and Extended Data Figure 6): an excitatory one defined by expression of CamKII/nNOS (see Extended Data Figure 2), and overlapping with expression of the transcription factor ETV-1, a second one defined by the expression of the vesicular GABA transporter (Vgat), and a third expressing the glial fibrillary acidic protein (GFAP, Figure 3a). As expected, optogenetic stimulation of the ETV-1-positive neurons mimics the effect of activating the CamKII-positive neurons and robustly triggered drinking behavior in water-satiated animals (Figure 3c). The Etv1-Cre mouse line18 used in these experiments is tamoxifen inducible19 (Cre-ER), and correspondingly, the behavior is fully dependent on tamoxifen induction. Photostimulation of the other two populations, did not stimulate drinking (Figure 3c and data not shown).
Figure 3. Three distinct cell populations in the SFO.
(a) Tissue staining of the SFO from a transgenic animal expressing ChR2-EYFP in Vgat neurons (labeled with anti-GFP antibody, green) and co-labeled with anti-nNOS (red) and anti-GFAP antibodies (white); the right panel shows a magnified view illustrating the non-overlap between the three populations. (b) ETV-1 (red) and nNOS (green) are co-expressed in most of the same neurons (>90% overlap, n=3). Scale bars 50 μm. (c) Photostimulation of ChR2 in ETV-1-positive neurons triggers robust drinking responses in tamoxifen-induced (n=6), but not uninduced animals (n=4). In contrast, stimulation of ChR2 in Vgat (n=8) neurons or GFAP+ glial cells (data not shown) had no effect on drinking behavior. Control wild type mice infected with AAV-flex-ChR2-EYFP showed no responses to light stimulation (n=5). Values are means ± s.e.m
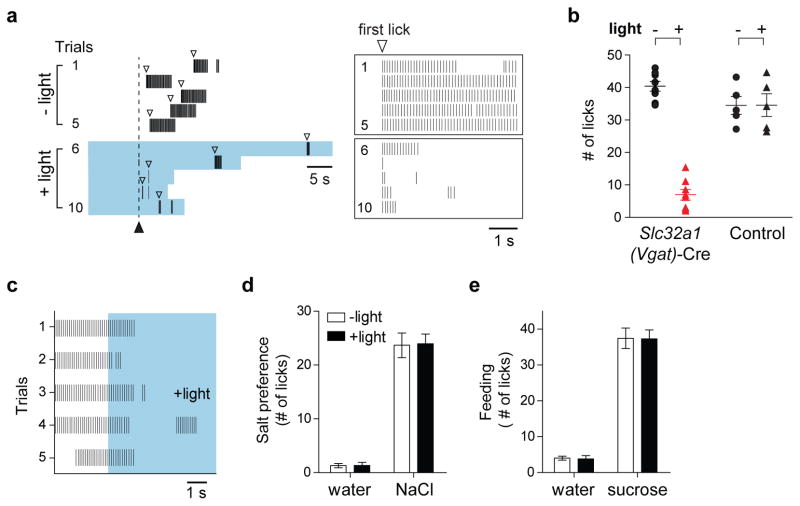
Given that the CamKII/ETV1-positive neurons provide a “thirst-ON” signal, we wondered whether one of the other cell classes might encode a “thirst-OFF” signal. Indeed, activation of the Vgat-positive neurons significantly suppressed water intake in thirsty animals (>80% lick suppression); the effect was time-locked to the laser stimulation, and observed in all Vgat ChR2-expressing animals tested (Figures 4a and b). Significantly, the suppression was as effective in thirsty animals that were actively drinking water, as it was in thirsty animals that have not yet sampled water (compare Figures 4a and 4c)
Figure 4. Activation of Vgat-positive neurons in the SFO suppresses thirst.
(a) Drinking behavior of a 24-hr water-deprived animal expressing ChR2 in Vgat-positive neurons. Trials were performed in the absence (trials1–5) or presence of photostimulation (trial 6–10). The solid arrowhead indicates the time of water presentation, and the open arrowheads mark the first lick; animals were allowed to lick for 5 s following the first lick in each trial. Light stimulation (blue shading) was started 10 s prior to water presentation, and maintained until the end of the 5 s licking window. The boxes on the right show an enlargement of these 10 trials, each aligned to the first lick. Note the strong suppression during photostimulation. (b) Graph quantifying the degree of suppression animals expressing AAV-flex-ChR2-EYFP in Vgat-positive neurons of the SFO (Slc32a1-Cre24) with or without light stimulation (Mann-Whitney test, P< 0.002; n=8). Also shown are wild type control mice infected with the same AAV-flex-ChR2-EYFP construct (n=5). Animals were tested for >5 trials each, and the total number of licks was averaged across trials. Photostimulation of the GFAP-positive population had no effect on drinking (data not shown). (c) Activation of Vgat-positive neurons suppresses drinking behavior even if animals were actively drinking. The plot illustrates the drinking response of a thirsty animal in 5 tests, before and during photostimulation (blue shading); the trials were aligned 3 s before photostimulation. (de) Photostimulation of Vgat-positive neurons did not suppress salt appetite in salt- depleted animals (150 mM NaCl), or sugar intake in hungry animals (300 mM sucrose); values are means ± s.e.m (n=7).
If activation of Vgat-positive neurons “quenches” thirst, then the effect should be highly specific for the motivation or drive to drink water. Thus, we examined the effect of photostimulation on salt appetite in salt-craving animals, and in sugar-intake in hungry animals (Figures 4d and e, see also Methods). As hypothesized, activation of Vgat-positive neurons specifically extinguished the craving to consume water, but did not affect food or salt appetite. Taken together, these results substantiate Vgat-positive neurons as mediators of the “thirst-OFF” signal, and demonstrate that the SFO contains selective populations of neurons mediating physiologically opposite responses to thirst.
Thirst is a fundamental physiological state representing a basic and innate response to dehydration. Earlier studies using micro-electrical stimulation and hormonal injections implicated the SFO in fluid homeostasis 9,12,13, and possibly salt appetite 20,21. Here we showed that the craving for water could be controlled with cell-type specific precision in the SFO of the hypothalamus.
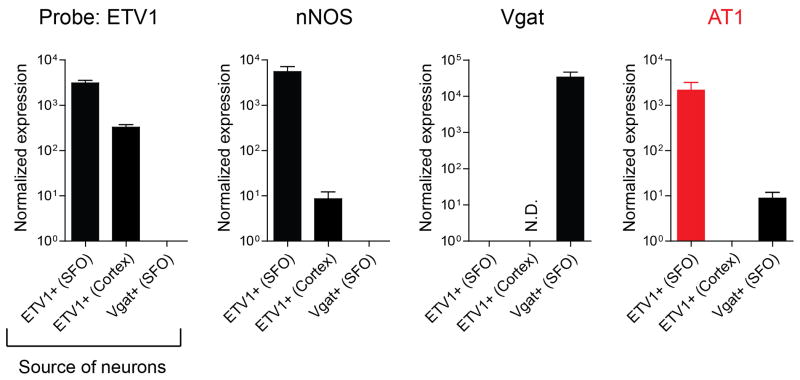
We used a combination of genetic and optogenetic tools in awake, behaving animals to demonstrate that the ETV-1- and Vgat-positive neurons of the SFO evoke or suppress the motivation to drink, respectively. We showed that activation of either population instantly triggered the behavior, be it water-seeking and drinking in normal or water-satiated animals, or strong suppression of drinking in thirsty animals; these responses are selective to water-drinking, with no effect on feeding or salt appetite. Significantly, most of the neurons in the SFO are either ETV-1 positive or VGAT-positive (Figure 3), strongly arguing that the SFO is a dedicated brain system for thirst, functioning possibly at the interface between the physiological/internal state of the organism and the motivation to drink water. Interestingly, the ETV-1 neuronal population selectively expresses the angiotensin receptor AT1 (Extended Data Figure 3), identifying them as a possible target of angiotensin-mediated drinking responses9–11.
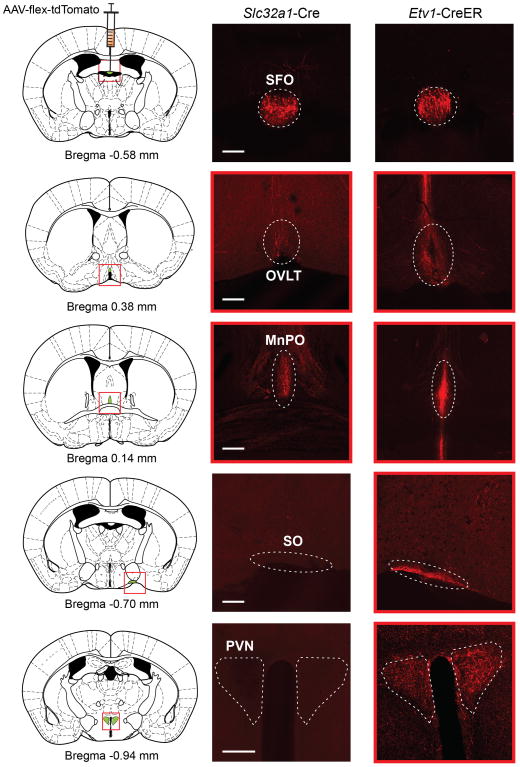
In addition to the SFO, dehydration activates several other brain regions 8,15, including the organum vasculosum of the lamina terminalis1 (OVLT), another hypothalamic nucleus lacking the blood brain barrier. Notably, this nucleus has direct connections to the SFO 22,23. Indeed, as an entry to further dissect the circuit for thirst, we have surveyed the axonal projections from the ETV-1 and Vgat-expressing neurons in the SFO. Our results (Extended Data Figure 7) show that both classes of SFO neurons project to the OVLT and the median preoptic nucleus (MnPO). Interestingly, the glutamatergic neurons (i.e. excitatory), unlike the GABAergic neurons, also project to the supraioptic nucleus (SO) and the paravenrtricular hypothalamic nucleus (PVN). Future physiological and behavioral studies should help reveal the role of these nodes in the neural circuitry mediating thirst, and their association with brain centers involved in other motivational states.
Methods
Animals
All procedures were carried out in accordance with the US National Institutes of Health (NIH) guidelines for the care and use of laboratory animals, and were approved by the Columbia University Animal Care and Use Committee. Reported data were obtained from mice ranging from 1.5–4 months of age and from both genders; randomization and blinding methods were not used. C57BL/6J and transgenic animals were acquired from the Jackson Laboratory (Etv1-CreER; stock# 013048, Gfap-Cre; stock# 012886, Slc32a1 (Vgat)-Cre; stock# 016962, Ai9; stock# 007909, and Slc17a6 (Vglut2)-Cre; stock# 016963). The Etv1-CreER line was originally developed by Taniguchi et al., 2011 (ref 18); Gfap-Cre line was originally developed by Garcia et al., 2004 (ref 25); Slc32a1/Slc17a6-Cre lines were originally developed by Vong et al., 2011 (ref 24), Ai9 (Rosa-flex-tdTomato, ref 26). Animals were housed in temperature-controlled environment with a 12-h light and 12-h dark cycle. Mice had ad libitum access to food and water except during behavioral tests. Sample sizes were chosen to allow robust statistical analysis of data, no statistical method was used to determine sample size. Representative data were chosen based on at least 3 independent experiments.
Viral Constructs
AAV viruses were prepared by the University of Pennsylvania Vector Core (AAV9.EF1α.DIO.ChR2-EYFP.WPRE, 1.07–1.6 × 10¹³ genomic copies per mL; AAV9.CamKIIa.ChR2-EYFP.WPRE, 1.06–1.98 × 10¹³ genomic copies per mL; AAV9.CamKIIa.GFP.WPRE, 1.71 × 10¹³ genomic copies per mL; AAV9.CB7Cl.mCherry.WPRE, 9.22 × 10¹² genomic copies per mL; AAV9.CAG.flex.tdTomato.WPRE.bGH, 8.88 × 10¹² genomic copies per mL).
Surgery
Adult 1.5- to 4-month-old mice were anesthetized with ketamine and xylazine (100 mg/kg and 10 mg/kg, intraperitoneal) and placed under a stereotaxic apparatus (Narishige). During surgery, body temperature was monitored and controlled using a closed-loop heating system (FHC Inc.). Procedures for surgery and virus injection were similar to those described previously 27–29. A small craniotomy with a diameter of <1 mm was performed at approximately bregma −0.55 (anterior-posterior), 0 (medial-dorsal). AAV (<40 nL total volume) was injected into the SFO by pressure injection (Nanoliter 2000, World Precision Instruments) using a pulled glass capillary at approximately 10 nL/min. The coordinates for injection into the SFO were Bregma −0.55 (anterior-posterior), 0 (medial-dorsal), and 3.0 (dorsal-ventral; The Mouse Brain atlas, Academic Press, 2001). After injection, a 200-μm fiber bundle (ThorLabs) attached to a custom-modified ferrule (Precision Fiber Products) was placed at <300 μm dorsal to the injection site, and permanently fixed on the skull with dental cement (Lang Dental Manufacturing Co.). Cannulated animals were allowed to recover for at least 8 days after surgery. In Etv1-CreER mice18, Cre-mediated ChR2 expression was induced by the injection of tamoxifen (80 mg/kg body weight for 2–3 times) after the recovery period. For tracing experiments, Etv1-CreER and Slc32a1-Cre mice were injected with AAV-flex-tdTomato-WPRE.bGH (<10 nL total volume). To minimize the likelihood of “spill-over” infection in Slc32a1-Cre mice, we diluted AAV by a factor of 10 before injection.
Behavioral assays
Brief water access test: Animals were tested in a custom gustometer as described previously6,30. Individual trials were either 40 s (stimulation of drinking), or 60 s (suppression of drinking) duration with a minimum intertrial intervals of 40 sec. Trials automatically terminated 5 seconds after the first lick, and the number of licks in this 5-s licking window was used to quantitate responses. All experiments with 24-hr water restriction were performed in their home cage before testing. For experiments that extended for 48-hr, animals were provided with 1 mL of water after 24-hr. For salt-attraction assays (Figure 4d), mice were injected with furosemide6 (50 mg/kg) and were kept for 24-hr with salt-deficient food (Harlan). For feeding assays (Figure 4e), animals were food-restricted for 24-hr. Data was statistically analyzed using Mann-Whitney U or two-tailed paired t-tests. After behavioral assays, animals were perfused with 4% PFA and the SFO was examined to confirm viral expression. Animals that showed no detectable viral expression in the SFO were excluded from analysis.
ChR2-mediated stimulation of drinking: 473 nm laser pulses (20 ms) at 20 Hz were delivered through an optic fiber bundle using a laser pulse generator (Shanghei Laser & Optics Century Co.). The laser output was maintained at 10 mW as measured at the tip of the fiber. In each 40 s trial, animals were photostimulated for up to 20 s (10–30 s window); stimulation was terminated when the trial ended. Photostimulation was triggered manually in each trial. Animals were tested for 3–20 trials for each condition, and the number of licks was averaged across trials. Because the spout shutter automatically closes 5 sec after the first lick, we excluded trials where the animals made the first lick before the experiment (photostimulation) started (0–10 s window). To analyze the efficacy of photostimulation in inducing drinking responses (Figures 1d and 3c), we determined the number of trials with >5 licks over the total number of trials. In essence, animals were photostimulated for 20 s, and we measured the number of licks during the first 5-s after they reach the spout (these are freely moving animals). If the animals exhibited >5 licks within the 5-s window, the trial was considered positive (shown as Drinking Response %). In Figure 1c, animals were photostimulated for 10 s with water available for the full 40-s trial. In Figure 1e, animals were placed in a gustometer and photostimulation was delivered with a regime of 30 s ON and 30 s OFF for the entire 15 min session. We measured total amount of consumed water by weighing the water bottle before and after the session.
ChR2-mediated drinking suppression: Animals were subjected to water restriction (Figure 4a–c), salt-deprivation (Figure 4d) or food-deprivation (Figure 4e) for 24-hr prior to behavioral experiments. In each 60 s trial, 473 nm laser pulses (20 ms; 10mW at fiber tip) at 20 Hz was started 10 s prior to water presentation, and maintained until the end of the trial. The number of licks in a 5 s window following the first lick was analyzed. Animals were tested for 3–10 trials each, and the number of licks was averaged across trials.
Histology
Animals were sacrificed with ketamine and xylazine, and perfused with 10 ml of PBS followed by 10 ml of 4% PFA in PBS (pH 7.4). Brains were dissected and post-fixed overnight in 4% PFA in PBS. 100 μm coronal brain sections were prepared using a vibratome (VT-1000S, Leica). After blocking with 10% FBS/0.2% Triton X-100 in PBS in the presence of 0.2% Triton X-100 for 1 hr, sections were incubated with primary antibodies overnight at 4C. The primary antibodies (1:500 dilution) used in these studies were: rabbit anti-CamKII (Abcam, ab5683), goat anti-c-Fos (Santa Cruz, SC-52G), goat anti-GFAP (Abcam, ab53554), rabbit anti-nNOS (Santa Cruz, sc-648), goat anti-nNOS (abcam ab72428), rabbit anti-ETV-1 (Abcam, ab81086), and chicken anti-GFP (Abcam, ab13970). Sections were washed twice with PBS, followed by a >3 hr incubation with fluorophore-conjugated secondary antibodies (1:500 dilution, Jackson Immuno Research). Fluorescent images were acquired and processed using a confocal microscope (FV1000, Olympus). In some experiments, brain sections were counterstained with DAPI (Sigma Aldrich).
Electrophysiological recordings from the SFO neurons in acute slice preparation
Procedures for preparing acute brain slices and whole-cell recordings with optogenetic stimulations were similar to those described previously29. Coronal slices containing the SFO (250 μm thick) were sectioned using a vibratome (VT-1000S, Leica) in ice-cold sucrose-based solution (in mM: 213 sucrose, 26 NaHCO3, 10 dextrose, 2.5 KCl, 2.0 MgSO4, 2.0 CaCl2, and 1.23 NaH2PO4, aerated with 95% O2/5% CO2). Slices were transferred to oxygenated artificial cerebrospinal fluid (ACSF; composition in mM: 126 NaCl, 26 NaHCO3, 2.5 KCl, 2 MgSO4, 2 CaCl2, 1.25 NaH2PO4 and 25 dextrose, 315 mOsm, adjusted to pH 7.4) and incubated at 32°C for at least 40 minutes. SFO neurons infected with AAV-CamKII-ChR2-EYFP in vivo were visualized by differential interference contrast. Whole-cell current clamp recordings were performed at 32°C with an Axopatch 200B amplifier and a Digidata 1440A (Molecular Devices). The patch electrode (4–6 MΩ) was filled with intracellular solution (in mM: 140 KGluconate, 3 KCl, 2 MgCl2, 10 HEPES, 0.2 EGTA, and 2 Na2ATP, 290 mOsm, adjusted to pH 7.2). Data were filtered at 5 kHz, sampled at 20 kHz, and analyzed with pClamp10 software (Molecular Devices). Photostimulation was by means of an X-Cite XLED1 (Lumen Dynamics; 470 nm, 2 ms pulses at 20 Hz).
qPCR
The SFO from Etv1-CreER/Ai9 or Slc32a1-Cre/Ai9 mice were dissected under a fluorescence microscope, ensuring minimal addition of adjoining tissue. The SFO was dissociated into single cells using Papain Dissociation System (Worthington), labeled with DAPI, and thw tdTomato+ neurons sorted using a flow cytometer (MoFlo Astrios, Beckman Coulter). RNA was extracted using the PicoPure RNA isolation kit (Applied Biosystems), and cDNA prepared using the Ovation RNA-seq V2 kit (Nugen). Quantitative real-time PCR was performed using the following sets of primers; ETV-1 (5′ primer: CAAACATCCCCTTCCCACCA; 3′ primer: ATAGAACTGCCTGGGACCCT), nNOS (5′ primer: CGGGAATCAGGAGTTGCAGT; 3′ primer: CAGAGCCGTGTTCCTTTCCT), Vgat (5′ primer: TCATCGAGCTGGTGATGACG; 3′ primer: CTTGGACACGGCCTTGAGAT), AT1 (5′ primer: CAACTGCCTGAACCCTCTGT; 3′ primer: TCCACCTCAGAACAAGACGC), GAPDH (5′ primer: GGTTGTCTCCTGCGACTTCA; 3′ primer: TAGGGCCTCTCTTGCTCAGT). Data were normalized to GAPDH.
Extended Data
Extended Data Figure 1. Fos induction by water-deprivation in the SFO.
(a) Approximately 30% of cells in the SFO (visualized with DAPI staining, blue) of a water restricted animal (48-hr) are Fos-positive (red, 26 ± 1.9%, n=3). (b) No significant Fos labeling was detected under water-satiated condition (lower panel). Scale bar, 50 μm. The graph shows quantification of Fos-positive cells among CamKII+ neurons, both under water-restricted and satiated conditions. Values are means ± s.e.m (n=3)
Extended Data Figure 2. nNOS-positive neurons in the SFO co-express Vglut2, an excitatory neuronal marker.
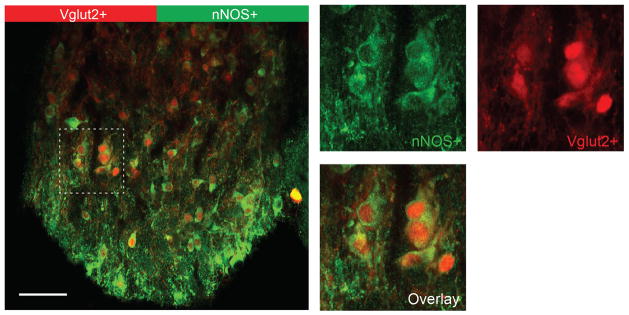
nNOS antibody staining (green) of the SFO from a Slc17a6-Cre/Ai9 transgenic animal expressing tdTomato in Vglut2-positive neurons (red); the right panel shows a magnified view illustrating the overlap between tdTomato- and nNOS-positive signals. Scale bar, 50 μm.
Extended Data Figure 3. Angiotensin receptor AT1 is enriched in ETV-1+ neurons in the SFO.
Quantitative PCR analysis of gene expression in three groups of neurons: ETV-1+ neurons from the SFO, ETV-1+ from the cerebral cortex31, and Vgat+ neurons from the SFO. Individual data points were normalized to the levels of GAPDH. Shown are the qPCR results for ETV1, nNOS, Vgat and AT1 in the three different samples; data is presented for each gene as its relative abundance compared to the tissue with the lowest level of expression (for example nNOS is expressed 10x more abundantly in ETV1-positive neurons from the cortex than in Vgat neurons from the SFO, and 1000x more abundantly in ETV-1 positive neurons from the SFO than the cortex). Note, that AT1 is highly enriched in ETV-1+ SFO neurons. N.D.: not detected. Values are means ± s.e.m (n=3 technical replicates)
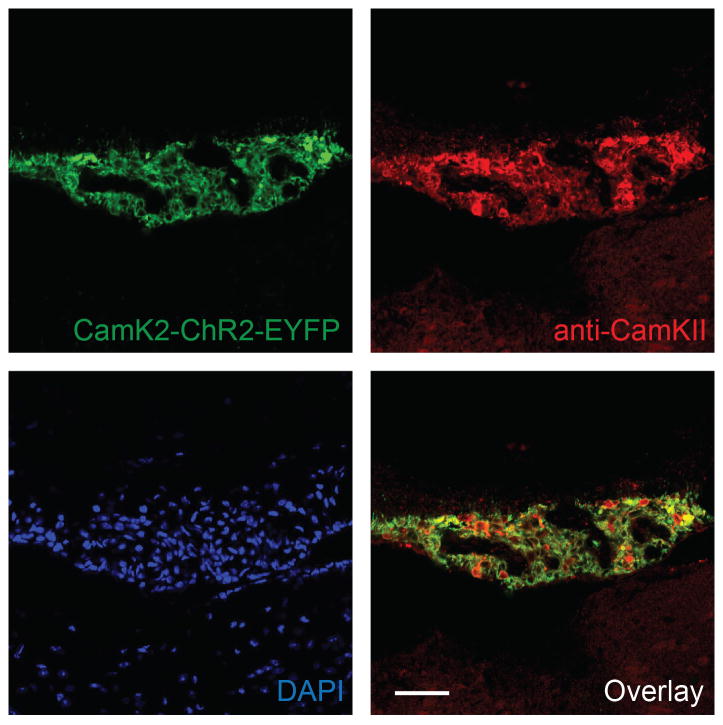
Extended Data Figure 4. Virally-expressed ChR2-EYFP under the control of CamKII promoter co-localized with endogenous CamKII.
Tissue staining of the SFO in a wild type animal infected with AAV-CamKIIa-ChR2-EYFP. Expression of ChR2-EYFP (labeled with anti-GFP antibody) overlapped endogenous CamKII expression (anti-CamKII antibody, upper right). Lower left panel shows DAPI staining (blue). Scale bar, 50 μm.
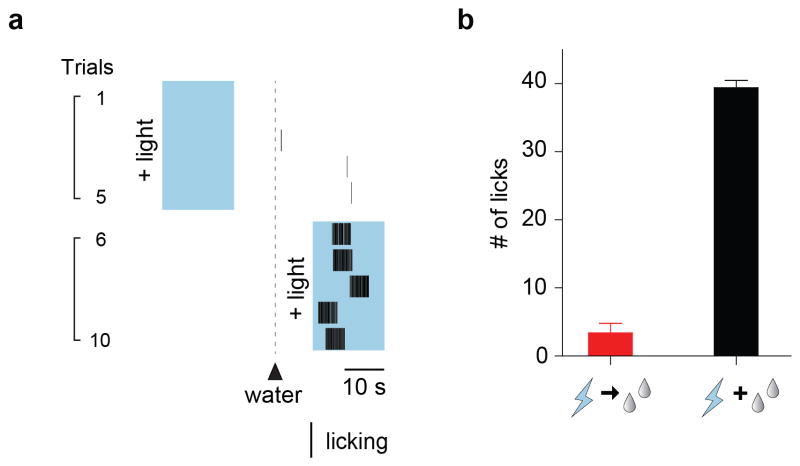
Extended Data Figure 5. ChR2-dependent drinking requires activation of SFO CamKII positive neurons concurrently with water presentation.
(a) Representative raster plots illustrating drinking behavior in a wild type animal expressing ChR2-EYFP under the control of CamKII promoter. Trials were performed with photostimulation (blue shadings) delivered before (trials 1–5) or during (trials 6–10) water presentation. The solid arrowhead indicates the first lick in each trial. Each black bar denotes an individual licking event. Note that photostimulation in the absence of water does not lead to drinking after stimulation, even if water is presented a few seconds after the termination of the light stimulation. (b) Quantification of drinking responses in 6 animals expressing AAV-flex-ChR2-EYFP in CamKII-positive neurons before (red bar) and during (black bar) water presentation (Mann-Whitney test, P< 0.003). Animals were tested for 5 trials each, and the total number of licks was averaged across trials. Values are means ± s.e.m.
Extended Data Figure 6. Three distinct cell populations in the SFO.
Using a combination of data from the Allen Brain Atlas (http://mouse.brain-map.org)32 and a candidate gene approach we identified three genetically separable, non-overlapping populations in the SFO. One population is defined by the expression of nNOS (red); also overlapping with CamKII- and ETV-1-positive cells (see Figures 3a and b). A second one is Vgat-expressing population visualized in a transgenic animal expressing ChR2-EYFP in Vgat-positive neurons (labeled with anti-GFP antibody, green). A third one is characterized by the expression of GFAP (white). Shown are double immunohistochemical staining of nNOS and Vgat-positive neurons (top panel), nNOS and GFAP (middle panel), and GFAP and Vgat-positive neurons (bottom panel). Scale bar, 50 μm.
Extended Data Figure 7. Neural projections from Vgat- and Etv-1-positive SFO neurons.
Slc32a1-Cre (Vgat-cre; left panel) and Etv1-CreER (right panel) mice were independently injected with AAV-flex-tdTomato in the SFO, and the axon-projections of Vgat-positive and ETV1-positive neurons examined using tdTomato reporter expression (red). Shown are the injection sites (top panels) and representative images of four brain regions receiving input from the SFO: OVLT, the organum vasculosum of the lamina terminalis; MnPO, the median preoptic nucleus; SO, the supraoptic nucleus; PVN, the paraventricular hypothalamic nucleus. Although we cannot preclude additional sites, these four areas exhibited the most prominently labeled projections from the SFO neurons. Scale bars, 200 μm.
Supplementary Material
Acknowledgments
We thank Nadia Propp for help with mouse husbandry. We also thank Hershy Fishman for valuable suggestions, Zeynep Turan, Nick Ryba and Ted Usdin for technical support, and Nick Ryba and members of the Zuker lab for helpful comments. We acknowledge Bradford Lowell and Michael Krashes for advice. C.S.Z. is an investigator of the Howard Hughes Medical Institute.
Footnotes
Author Contributions
Y.O. conceived the research program, designed the study, carried out the experiments, and analyzed data; M.Y. performed all slice patch clamp recordings; C.S.Z. analyzed data, designed experiments and together with Y.O. wrote the paper.
References
- 1.McKinley MJ, et al. The sensory circumventricular organs of the mammalian brain. Advances in anatomy, embryology, and cell biology. 2003;172:1–122. doi: 10.1007/978-3-642-55532-9. [DOI] [PubMed] [Google Scholar]
- 2.Young JK. Hunger, Thirst, Sex, and Sleep: How the Brain Controls Our Passions. Rowman & Littlefield Publishers, Inc; 2012. [Google Scholar]
- 3.Sternson SM. Hypothalamic survival circuits: blueprints for purposive behaviors. Neuron. 2013;77:810–824. doi: 10.1016/j.neuron.2013.02.018. [DOI] [PMC free article] [PubMed] [Google Scholar]
- 4.Daniels D, Fluharty SJ. Salt appetite: a neurohormonal viewpoint. Physiology & behavior. 2004;81:319–337. doi: 10.1016/j.physbeh.2004.02.013. [DOI] [PubMed] [Google Scholar]
- 5.Geerling JC, Loewy AD. Central regulation of sodium appetite. Experimental physiology. 2008;93:177–209. doi: 10.1113/expphysiol.2007.039891. [DOI] [PubMed] [Google Scholar]
- 6.Oka Y, Butnaru M, von Buchholtz L, Ryba NJ, Zuker CS. High salt recruits aversive taste pathways. Nature. 2013;494:472–475. doi: 10.1038/nature11905. [DOI] [PMC free article] [PubMed] [Google Scholar]
- 7.Stricker EM, Sved AF. Thirst. Nutrition. 2000;16:821–826. doi: 10.1016/s0899-9007(00)00412-3. [DOI] [PubMed] [Google Scholar]
- 8.McKinley MJ, Johnson AK. The physiological regulation of thirst and fluid intake. News in physiological sciences. 2004;19:1–6. doi: 10.1152/nips.01470.2003. [DOI] [PubMed] [Google Scholar]
- 9.Fitzsimons JT. Angiotensin, thirst, and sodium appetite. Physiological reviews. 1998;78:583–686. doi: 10.1152/physrev.1998.78.3.583. [DOI] [PubMed] [Google Scholar]
- 10.Epstein AN, Fitzsimons JT, Simons BJ. Drinking caused by the intracranial injection of angiotensin into the rat. The Journal of physiology. 1969;200:98–100. [PubMed] [Google Scholar]
- 11.Sturgeon RD, Brophy PD, Levitt RA. Drinking elicited by intracranial microinjection of angiotensin in the cat. Pharmacology, biochemistry, and behavior. 1973;1:353–355. doi: 10.1016/0091-3057(73)90128-7. [DOI] [PubMed] [Google Scholar]
- 12.Robertson A, Kucharczyk J, Mogenson GJ. Drinking behavior following electrical stimulation of the subfornical organ in the rat. Brain research. 1983;274:197–200. doi: 10.1016/0006-8993(83)90541-3. [DOI] [PubMed] [Google Scholar]
- 13.Smith PM, Beninger RJ, Ferguson AV. Subfornical organ stimulation elicits drinking. Brain research bulletin. 1995;38:209–213. doi: 10.1016/0361-9230(95)00088-v. [DOI] [PubMed] [Google Scholar]
- 14.Verbalis JG. How does the brain sense osmolality? Journal of the American Society of Nephrology : JASN. 2007;18:3056–3059. doi: 10.1681/ASN.2007070825. [DOI] [PubMed] [Google Scholar]
- 15.Bourque CW, Oliet SH, Richard D. Osmoreceptors, osmoreception, and osmoregulation. Frontiers in neuroendocrinology. 1994;15:231–274. doi: 10.1006/frne.1994.1010. [DOI] [PubMed] [Google Scholar]
- 16.Li X, et al. Fast noninvasive activation and inhibition of neural and network activity by vertebrate rhodopsin and green algae channelrhodopsin. Proceedings of the National Academy of Sciences of the United States of America. 2005;102:17816–17821. doi: 10.1073/pnas.0509030102. [DOI] [PMC free article] [PubMed] [Google Scholar]
- 17.Boyden ES, Zhang F, Bamberg E, Nagel G, Deisseroth K. Millisecond-timescale, genetically targeted optical control of neural activity. Nature neuroscience. 2005;8:1263–1268. doi: 10.1038/nn1525. [DOI] [PubMed] [Google Scholar]
- 18.Taniguchi H, et al. A resource of Cre driver lines for genetic targeting of GABAergic neurons in cerebral cortex. Neuron. 2011;71:995–1013. doi: 10.1016/j.neuron.2011.07.026. [DOI] [PMC free article] [PubMed] [Google Scholar]
- 19.Feil R, et al. Ligand-activated site-specific recombination in mice. Proceedings of the National Academy of Sciences of the United States of America. 1996;93:10887–10890. doi: 10.1073/pnas.93.20.10887. [DOI] [PMC free article] [PubMed] [Google Scholar]
- 20.Hiyama TY, Watanabe E, Okado H, Noda M. The subfornical organ is the primary locus of sodium-level sensing by Na(x) sodium channels for the control of salt-intake behavior. The Journal of neuroscience. 2004;24:9276–9281. doi: 10.1523/JNEUROSCI.2795-04.2004. [DOI] [PMC free article] [PubMed] [Google Scholar]
- 21.Noda M, Sakuta H. Central regulation of body-fluid homeostasis. Trends in neurosciences. 2013;36:661–673. doi: 10.1016/j.tins.2013.08.004. [DOI] [PubMed] [Google Scholar]
- 22.Johnson AK, Zardetto-Smith AM, Edwards GL. Integrative mechanisms and the maintenance of cardiovascular and body fluid homeostasis: the central processing of sensory input derived from the circumventricular organs of the lamina terminalis. Progress in brain research. 1992;91:381–393. doi: 10.1016/s0079-6123(08)62357-2. [DOI] [PubMed] [Google Scholar]
- 23.Johnson AK, Gross PM. Sensory circumventricular organs and brain homeostatic pathways. FASEB journal. 1993;7:678–686. doi: 10.1096/fasebj.7.8.8500693. [DOI] [PubMed] [Google Scholar]
- 24.Vong L, et al. Leptin action on GABAergic neurons prevents obesity and reduces inhibitory tone to POMC neurons. Neuron. 2011;71:142–154. doi: 10.1016/j.neuron.2011.05.028. [DOI] [PMC free article] [PubMed] [Google Scholar]
- 25.Garcia AD, Doan NB, Imura T, Bush TG, Sofroniew MV. GFAP-expressing progenitors are the principal source of constitutive neurogenesis in adult mouse forebrain. Nature neuroscience. 2004;7:1233–1241. doi: 10.1038/nn1340. [DOI] [PubMed] [Google Scholar]
- 26.Madisen L, et al. A robust and high-throughput Cre reporting and characterization system for the whole mouse brain. Nature neuroscience. 2010;13:133–140. doi: 10.1038/nn.2467. [DOI] [PMC free article] [PubMed] [Google Scholar]
- 27.Wu Z, Autry AE, Bergan JF, Watabe-Uchida M, Dulac CG. Galanin neurons in the medial preoptic area govern parental behaviour. Nature. 2014;509:325–330. doi: 10.1038/nature13307. [DOI] [PMC free article] [PubMed] [Google Scholar]
- 28.Aponte Y, Atasoy D, Sternson SM. AGRP neurons are sufficient to orchestrate feeding behavior rapidly and without training. Nature neuroscience. 2011;14:351–355. doi: 10.1038/nn.2739. [DOI] [PMC free article] [PubMed] [Google Scholar]
- 29.Lee H, et al. Scalable control of mounting and attack by Esr1+ neurons in the ventromedial hypothalamus. Nature. 2014;509:627–632. doi: 10.1038/nature13169. [DOI] [PMC free article] [PubMed] [Google Scholar]
- 30.Chandrashekar J, et al. The cells and peripheral representation of sodium taste in mice. Nature. 2010;464:297–301. doi: 10.1038/nature08783. [DOI] [PMC free article] [PubMed] [Google Scholar]
- 31.Yoneshima H, et al. Er81 is expressed in a subpopulation of layer 5 neurons in rodent and primate neocortices. Neuroscience. 2006;137:401–412. doi: 10.1016/j.neuroscience.2005.08.075. [DOI] [PubMed] [Google Scholar]
- 32.Ng L, et al. An anatomic gene expression atlas of the adult mouse brain. Nature neuroscience. 2009;12:356–362. doi: 10.1038/nn.2281. [DOI] [PubMed] [Google Scholar]
Associated Data
This section collects any data citations, data availability statements, or supplementary materials included in this article.


