Abstract
We describe a microscope capable of both light sheet fluorescence microscopy (LSFM) and differential interference contrast microscopy (DICM). The two imaging modes, which to the best of our knowledge have not previously been combined, are complementary: LSFM provides three-dimensional imaging of fluorescently labeled components of multicellular systems with high speed, large fields of view, and low phototoxicity, while DICM reveals the unlabeled neighborhood of tissues, organs, and other structures with high contrast and inherent optical sectioning. Use of a single Nomarski prism for DICM and a shared detection path for both imaging modes enables simple integration of the two techniques in one custom microscope. We provide several examples of the utility of the resulting instrument, focusing especially on the digestive tract of the larval zebrafish, revealing in this complex and heterogeneous environment anatomical features, the behavior of commensal microbes, immune cell motions, and more.
Introduction
Embryonic and larval development occurs via the coordinated interactions of large numbers of cells. Imaging developmental processes therefore presents significant technical demands, calling for methods that can span organs, tissues, or even whole organisms with sufficient resolution in three dimensions to track individual cells, sufficient speed to capture snapshots unblurred by cellar motions, and sufficiently low phototoxicity to allow imaging for the long durations of morphogenetic processes. In recent years, the technique of light sheet fluorescence microscopy (LSFM), also known as selective plane illumination microscopy (SPIM), has emerged as a powerful approach for three-dimensional live imaging, satisfying the above requirements (Keller et al. 2008; Huisken & Stainier 2009; Santi 2011; Tomer et al. 2012; Krzic et al. 2012; Schmid et al. 2013; Ahrens et al. 2013; Swoger et al. 2011) In brief, LSFM involves illumination of a specimen with a thin sheet of fluorescence excitation light, the emission from which is imaged onto a camera via a perpendicular lens (Figure 1). Scanning the specimen in only one dimension, perpendicular to the sheet, rapidly generates a three dimensional image. Moreover, in stark contrast to, for example, confocal microscopy, every part of the specimen that is illuminated is imaged, leading to very low levels of photobleaching and phototoxicity (Keller et al. 2008; Jemielita et al. 2013).
Figure 1.
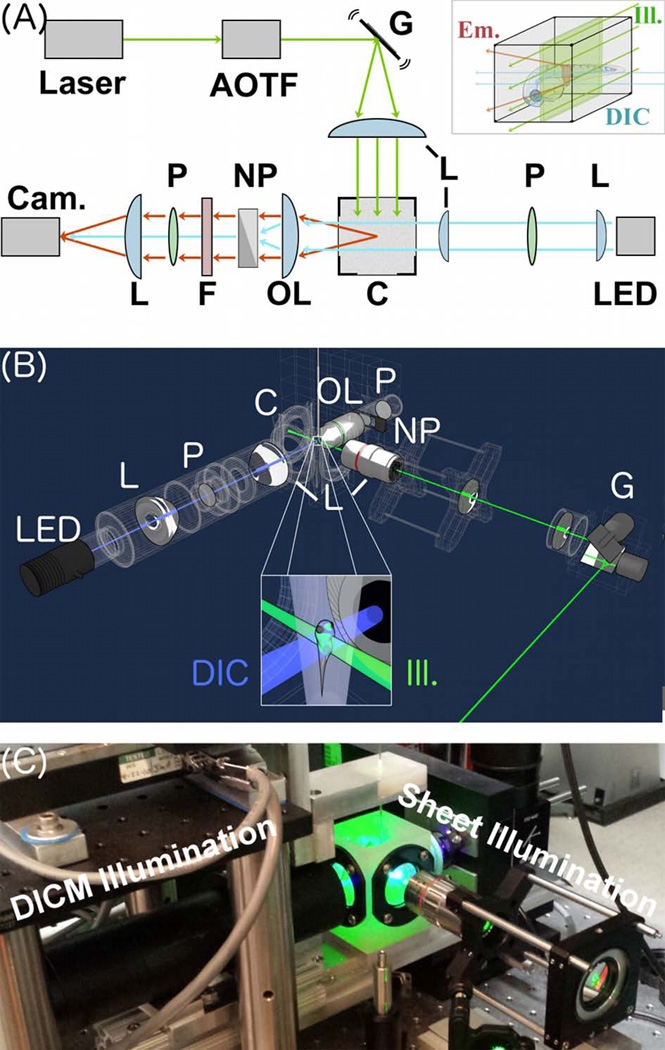
A Combined Light Sheet Fluorescence and Differential Interference Contrast Microscope. (A) Schematic. Laser excitation light (green) is filtered with an acousto-optic tunable filter (AOTF) and formed into a sheet using a galvanometer-scanned mirror, G. The sheet plane is perpendicular to plane of the page. Fluorescence emission light is indicated in red. Transmitted light for DICM is indicated in blue. LED = light emitting diode for DICM illumination. P = polarizers; NP = Nomarski prism L = lenses; OL = objective lens; C = specimen chamber; F = filter wheel; Cam. = Camera. As described in the text, the right-side Nomarski prism is optional. Inset: the specimen chamber, highlighting a larval zebrafish specimen, the excitation light sheet, and the DICM light source. (B) A three-dimensional schematic rendering, with the same abbreviations and inset features as in (A). (C) A photograph of the setup.
Several research groups have extended the imaging capabilities of LSFM through, for example, the integration of structured illumination (Keller & Stelzer 2010), localization-based superresolution (Cella Zanacchi et al. 2011), stimulated emission depletion (Friedrich et al. 2011), and multiphoton excitation (Truong et al. 2011). It is notable that all of these methods, while certainly useful, rely on fluorescence, as does LSFM itself. Often in biological imaging, fluorescently labeled cells or cellular structures of interest, by construction, make up a subset of all the cells in their neighborhood. One can image, for example, migrating sensory cells (Swoger et al. 2011),firing neurons (Ahrens et al. 2013), or gut microbes (Taormina et al. 2012), but the function and behavior of these and other specific cell types can be modulated by the cells and biomaterials of their local neighborhood. In a complex multicellular organism, however, simple brightfield imaging is insufficient to make sense of the unlabeled cellular environment.
Differential interference contrast microscopy (DICM) has a long history as a powerful imaging method for generating optical contrast and sectioning using transmitted light (Allen et al. 1969; Pluta 1989). In DICM, light from slightly spatially separated paths is recombined such that the resulting intensity is a measure of the difference in optical path length. Roughly, the image intensity is a measure of the gradient of the index of refraction in the focal plane, and therefore provides contrast to edges in transparent structures like collections of cells.
While DICM is a well-established technique, it has never been combined with light sheet fluorescence imaging (In contrast, several groups have integrated DICM with confocal imaging, e.g. (Cody et al. 2005; Amos et al. 2003)). We show here that combining DICM and LSFM is straightforward to implement, and we provide examples illustrating that, as claimed above, differential contrast imaging provides useful tissue-level context for light sheet fluorescence microscopy. Our examples focus mainly on imaging of the digestive tract of larval zebrafish, in which the existence of multiple tissue types and multiple species, fish and microbes, provide a challenging imaging environment.
Experimental Setup
Various designs for light sheet fluorescence microscopy have been developed in recent years (Huisken & Stainier 2009; Krzic et al. 2012; Tomer et al. 2012; Schmid et al. 2013), all of which involve the illumination of a specimen with a thin sheet of fluorescence excitation light and the detection of emission along an axis perpendicular to the sheet. The light sheet fluorescence design aspects of our home-built instrument (Figure 1) closely follow the designs of Keller et al. (Keller et al. 2008)and are described in detail in Ref. (Taormina et al. 2012).In brief: One of several laser lines (Coherent Sapphire 561 and 488) is selected with an acousto-optical tunable filter (AOTF) (Crystal Technologies, AODS 20160) and swept by a rapidly scanning galvanometer mirror (frequency 500 Hz, Cambridge Technology 6210H). A telecentric f-theta lens transforms the angular sweep into a translational sweep, which then passes through a tube lens and objective lens (Mitutoyo M Plan APO, 5x) to reach the specimen. Emission light is filtered with a bandpass filter (Chroma Technology) and magnified by an objective lens (Zeiss DICM M Plan Apochromat, 40x) and tube lens onto a scientific CMOS camera (Cooke pco.edge). Typical exposure times for each image plane are 10–100 ms, which are long compared to the sweep frequency of the light sheet. Our setup is illustrated in Figure 1.
Differential interference contrast microscopy is a method for transforming spatial variation in the index of refraction or thickness of a sample into contrast in an image. DICM has been a well-established imaging technique for decades, and detailed treatments of its optics exist in the literature (Allen et al. 1969; Mehta & C. J. R. Sheppard 2010; Mehta & C. J. Sheppard 2008; Preza et al. 1999).In order to make this report self-contained, we provide a short explanation of this method. Consider polarized light incident on a sample. In the infinity space of the imaging light path, a Nomarski prism deflects light of orthogonal polarizations, chosen to be oriented at 45 degrees relative to the incident polarization axis, along different directions. This angular shear of the differently polarized transmitted rays is transformed by the microscope’s tube lens into a lateral separation. The light also passes through a polarizer (known as the analyzer) oriented at 90 degrees relative to the illumination polarization, before being detected, typically by a camera. Note that light from a single point in the object plane reaches two points at the camera plane, one corresponding to each polarization generated the Nomarski prism. Equivalently, light from two spatially separated points in the object plane will reach the same point in the camera plane, and the analyzer orientation ensures that their interference will depend on the relative path length difference of the two paths. DICM therefore effectively computes a directional derivative of the optical path length of a specimen and displays the result as image contrast.
The argument above is valid if the light used to illuminate the sample is spatially coherent at the object plane, so that there is a well-defined phase relationship between separated points. It is therefore critical to maintain coherence over at least the shear distance. A standard approach to achieving this is to add a Nomarski prism to the beam path between the condenser lens, and the specimen. By separating components of the polarization of the illumination light by exactly the desired shear distance in the object plane, one guarantees that any phase difference acquired by the components was obtained via a difference in optical path length through the sample (assuming temporal coherence). Another approach is to use a light source that is coherent over distances greater than or equal to the shear distance. It has been well known for decades that LEDs have limited spatial coherence, and many researchers have made use of this property for microscopy. Bormuth et al. (2007) specifically described and characterized the use of LEDs for DICM illumination, and we adopt their approach. One could also use a highly coherent source, such as a laser, though this has the practical disadvantage of easily generating speckle in images.
Our DICM setup uses a 447nm LED as an illumination source (Luxeon Star) and uses only one Nomarski prism (Zeiss), as explained above (Figure 1). The microscope is designed such that the same detection optics are used for light sheet fluorescence and DICM imaging. The addition of a Nomarski prism to the beam path does not introduce noticeable optical aberrations to the imaging of the incoherent fluorescent emission (quantified below). Because the Nomarski prism and polarizer pairs are located in the infinity space separating the objective and tube lens, insertion and removal of these optical elements is straightforward. Wavelength filtering or control of the LED power supply enable switching between fluorescence and DICM imaging. In addition, since DICM and LSFM can be done at different wavelengths, one can simultaneously acquire both DICM and LSFM images. We demonstrate this (Supplementary Figure 1) by using a color camera (Thorabs, Moticam 2000), but one could also spatially split the colors and image onto two separate cameras, or onto different regions of a single camera sensor. Notably, the combined LSFM and DICM instrument (Figure 1) can incorporate various modifications to light sheet microscopy, such as structured illumination and multiphoton excitation, as noted above, without requiring redesign or alteration of the DICM optics.
All experiments performed with zebrafish were done according to protocols approved by the University of Oregon Institutional Animal Care and Use Committee. The ages of all imaged zebrafish were between 5 and 7 days post fertilization (dpf).
Results
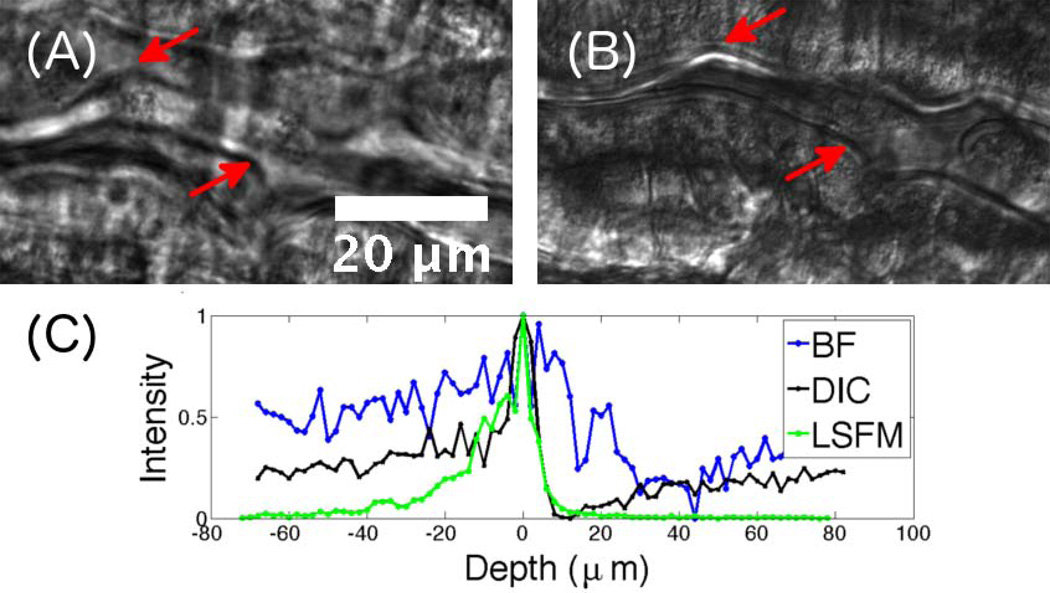
We constructed an integrated DICM / LSFM microscope to augment information on the positions and dynamics of fluorescent cells in live specimens, especially embryonic and larval zebrafish, with information about the local environment. Zebrafish are a popular and important model organism due to their physiological similarity with other vertebrates, their fecundity, their amenability to genetic manipulation, and their transparency at young ages (Grunwald & Eisen 2002; Dooley & Zon 2000). Like all vertebrates, however, they are composed of many types of tissues, organs, and extracellular materials, often making simple brightfield imaging of specimens confusing or uninformative. We provide examples of the utility of our instrument focusing especially on the larval zebrafish gut, both because of its importance as a model for studying bacteria-host interactions in vertebrates (Taormina et al. 2012; Semova et al. 2012; Rawls et al. 2007) and because its complexity highlights the utility of DICM imaging. We first show brightfield and DICM images of a region of the gut (Figure 2A,B). In the DICM image, important features such as the gut boundary and individual cells are evident.
Figure 2.
Characterization of various imaging techniques. (A) Brightfield and (B) DICM images of the same region of the intestine of a 7 dpf (days post fertilization) larval zebrafish. In the DICM image, features such as the gut edge (arrows) are clearly evident. (C) Pixel intensity, normalized to a peak value of 1, as a function of depth relative to the focal plane from images of a fluorescent polystyrene microsphere embedded in agar imaged with BF (brightfield), DICM, and LSFM, providing a measure of the depth of focus, and optical sectioning ability, of each method.
The interferometric nature of DICM also generates well-known optical sectioning, as only a thin region around the focal plane contributes coherently to image formation. To compare the depth of field of fluorescence, brightfield, and DICM imaging we captured images of 100 nm diameter fluorescent microspheres (Invitrogen, 488nm FlouSpheres), immobilized in agar, at a series of depths along the detection optical axis. We determined the central pixel of a bead from the in-focus two-dimensional image, and examined the intensity of this pixel as a function of image depth, plotted in Figure 2C for a single bead. The fluorescence intensity of the microsphere decays to half its maximal value within approximately 10 microns from the focal plane. This width is largely determined by the excitation sheet thickness, which can be tuned via the illumination optics and which determines the Rayleigh length of the illuminating beam. While we are capable of achieving a near diffraction limited beam waist with our setup, the corresponding Rayleigh length associated with this width would be much smaller than the field of view we wish to image, specifically large sections of the larval zebrafish gut. We therefore use a beam waist of roughly 10 microns, which gives a uniform sheet thickness over a roughly 500 micron extent. For different applications, different beam waists and Rayleigh lengths will be optimal. The DICM intensity of the microsphere exhibits a characteristic bright and dark pattern relative to the background, with a sharpness similar to that of the fluorescence trace, indicating section capabilities well-matched to integration with LSFM. The brightfield image is noisy, has low contrast, and its peak decays over a depth of approximately 30 microns, considerably larger than the DICM or LSFM traces.
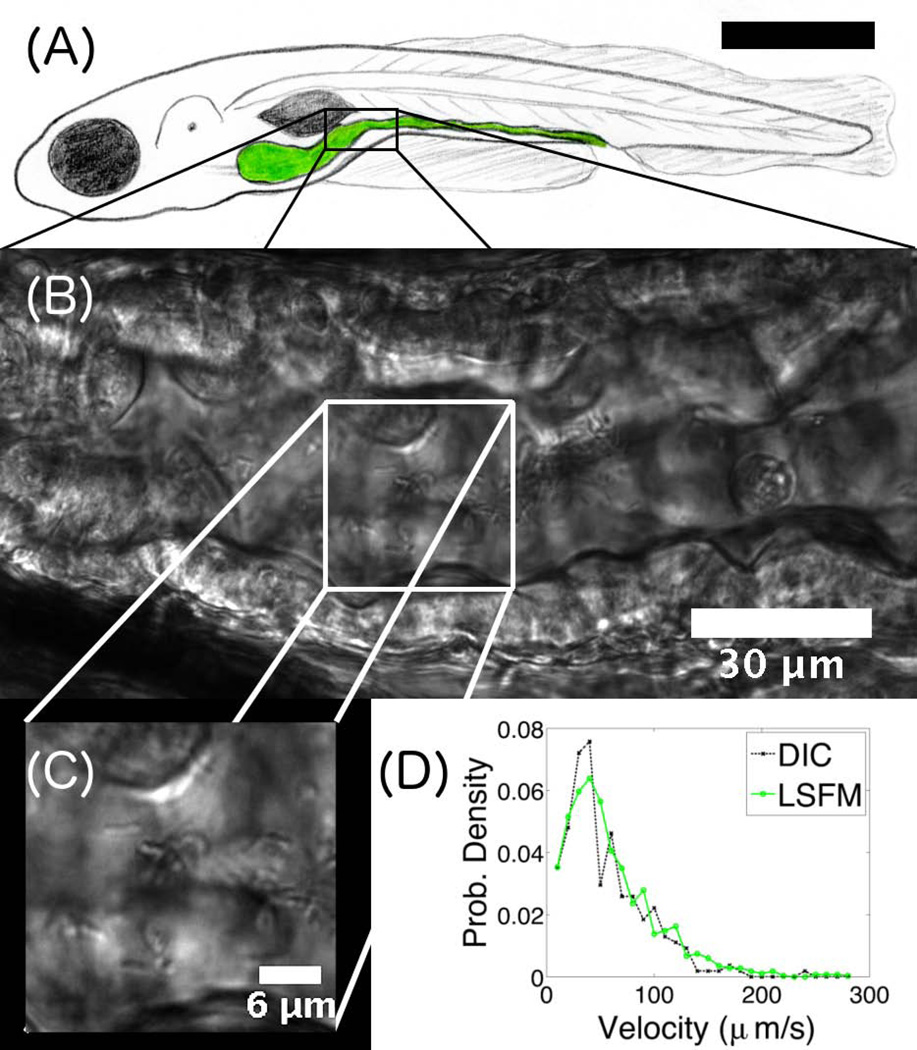
Figure 3 shows an example of the quantitative information that can be derived from DICM imaging of the zebrafish digestive tract. Gut bacteria (Vibrio cholerae, introduced into an initially microbe-free fish (Milligan-Myhre et al. 2011) are evident (Figure 3B,C and Supplementary Video 1). Not only can we distinguish individual bacteria (Figure 3C), we can also extract quantitative information about their motility. Figure 3D shows velocity distributions of gut bacteria obtained by the two different imaging modes of our microscope. The green curve was obtained from LSFM images of V. Cholerae expressing green fluorescent protein. The black curve was obtained from DICM images taken shortly after the LSFM images of the same region of the same fish. In both cases, bacteria were tracked using custom software that localizes bright spots in images (Parthasarathy 2012). For DICM, images were spatially and temporally filtered to extract non-stationary signals with the size characteristic of bacteria, mean-subtracted, and smoothed to generate processed images with bright features on dark backgrounds that could then be tracked. The velocity distributions are essentially identical to one another. The mean velocities from DICM- and LSFM-derived trajectories are 55 um/s and 60 um/s, respectively, consistent with expected in vitro values for these microbes (McCarter 2001).
Figure 3.
(A) Schematic illustration of a larval zebrafish, with the intestine highlighted in green. The scale bar is approximately 0.5 mm. (B) DICM image of a section of the intestine of a 6 dpf zebrafish. The gut boundaries are clearly evident. (C) Part of the image in (B), showing individual rod-like Vibrio cholerae bacteria. (D) Velocity distribution of Vibrio cholerae in the gut, obtained from either LSFM or DICM imaging.
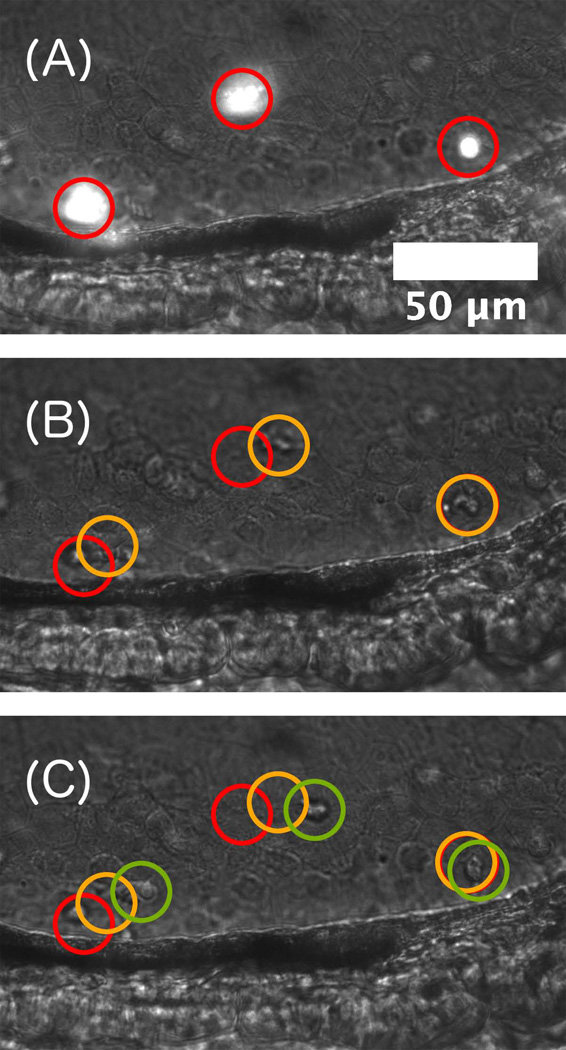
DICM can be used to monitor particular eukaryotic cell types or behaviors. To demonstrate this in a live animal, we show LSFM and DICM images of neutrophils, highly motile immune cells, imaged with both DICM and LSFM in a transgenic fish (MPO:GFP) in which green fluorescent protein expression is driven by a neutrophil-specific promoter (Renshaw et al. 2006). DICM images in Figure 4 show the motion of particular individual cells over 6 minutes (see also Supplemental Video 2), and LSFM images indicate that these cells are, in fact, neutrophils. The use of DICM to follow specific cells should be especially useful in cases in which LSFM is devoted to imaging other, different cells. Specific fluorescent transgenic animals are often unavailable or difficult to construct, and the combination of DICM and LSFM expands the set of cell types that can be examined in one experiment.
Figure 4.
Motile immune cells. (A) Simultaneous DICM and LSFM image of fluorescent neutrophils (transgenic mpo:GFP) in a 5 dpf larval zebrafish. (B, C) DICM images at times 185 seconds and 380 seconds before the image of panel (A), showing neutrophil motility.
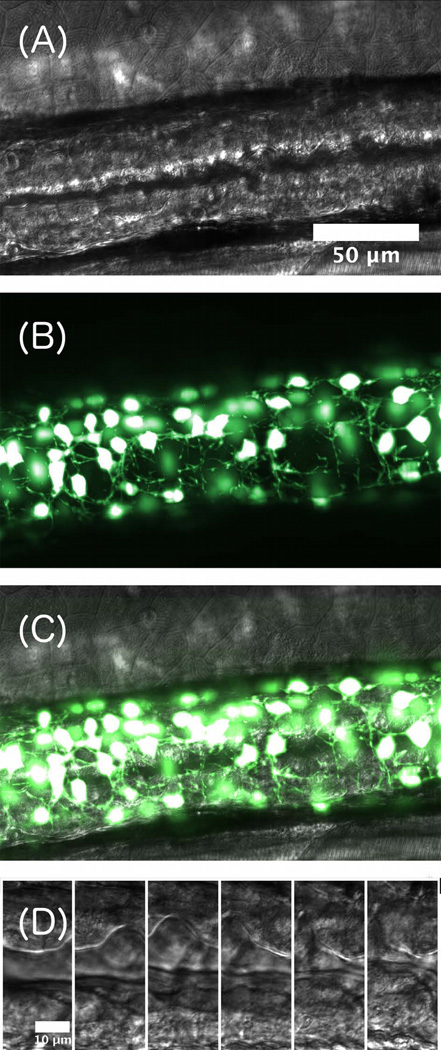
Another example of the utility of combined DICM and LSFM is provided in Figure 5, which shows a DICM image of the gut and LSFM images of enteric neurons (transgenic phox2b:GFP) that line the gut and coordinate peristaltic motions (Holmberg et al. 2007; Field et al. 2009; Holmberg et al. 2004) With the two imaging modes, the dynamics of peristalsis (see Supplemental Video 3) can be correlated with the location and the connectivity of the enteric neural network (see Supplemental Video 4) relative to the gut boundary, enabling previously inaccessible quantitative studies of the control of gut motility.
Figure 5.
(A) DICM image of a 5 dpf larval zebrafish gut. (B) False-color maximum intensity projection of a three dimensional LSFM image of enteric neurons. (C) Overlay of the DICM and LSFM images. Image contrast has been enhanced for clarity. (D) A time series of DICM images, separated by 1 second, showing a peristaltic wave of gut motion. Scale bar: 10 microns.
Conclusion
Three-dimensional imaging in live specimens presents many technical challenges due to its demands of large fields of view, high speeds relative to timescales of cellular motion, and low phototoxicity. We have shown that the integration of light sheet fluorescence microscopy and differential interference contrast microscopy is a valuable methodology for live imaging, as it combines the specificity of fluorescence-based three-dimensional microscopy with the contextual information of DICM. The appeal of the speed and light efficiency of LSFM relative to, for example, confocal microscopy for live imaging is increasingly well appreciated (Huisken & Stainier 2009; Swoger et al. 2011; Jemielita et al. 2013; Truong et al. 2011), and its straightforward integration with DICM should motivate even more applications to optically and biologically heterogeneous systems such as three-dimensional cell cultures, developing organs and tissues, and whole animals.
It is worth noting that part of the appeal of adding DICM to LSFM stems from the difficulty and laboriousness of creating fluorescent transgenic organisms, even with modern molecular methods. Being able to use DICM to quantify the motility of bacteria (Figure 3) or neutrophils (Figure 4) – each of which provide information on chemotaxis and other response behaviors in a wide variety of contexts – frees fluorescence channels to be used for other cell types. In principle, one can create a wide range of multicolored fluorescent reporters. In practice, however, the labor of designing new fluorescent microbes or animals is significant – for bacteria, it typically involves engineering appropriate plasmids, controlling the cloning, insertion, and expression of new genes, and tedious assessments of insertion and viability, which typically take weeks to implement in new species, not always successfully. The creation of transgenic zebrafish is even more labor and time intensive. Therefore, the combination of high contrast fluorescence-based and non-fluorescent imaging modes is useful for circumventing these challenges. Integrating DICM with LSFM in particular combines two imaging methods that are ideally suited to the visualization of complex multicellular systems.
Supplementary Material
Acknowledgements
We thank Judith Eisen, Julia Ganz, and Karen Guillemin for useful discussions, Jennifer Hampton and Travis Wiles for providing larval zebrafish inoculated with Vibrio cholerae, and Julia Ganz and Annah Rolig for providing transgenic zebrafish with fluorescent neutrophils and enteric neurons, respectively. This material is based upon work supported by the National Science Foundation under Grant No. 0922951. Research reported in this publication was also supported by the National Institute of General Medical Sciences of the National Institutes of Health under award number 1P50 GM098911. The content is solely the responsibility of the authors and does not necessarily represent the official views of the National Institutes of Health.
References
- Ahrens MB, et al. Whole-brain functional imaging at cellular resolution using light-sheet microscopy. Nature Methods. 2013;10(5):413–420. doi: 10.1038/nmeth.2434. [DOI] [PubMed] [Google Scholar]
- Allen RD, David GB, Nomarski G. The Zeiss-Nomarski Differential Interference Equipment for Transmitted-Light Microscopy. Zeitschrift für wissenschaftliche Mikroskopie und mikroskopische Technik. 1969;69(4) [PubMed] [Google Scholar]
- Amos WB, et al. Re-evaluation of differential phase contrast (DPC) in a scanning laser microscope using a split detector as an alternative to differential interference contrast (DIC) optics. Journal of Microscopy. 2003;210(Pt 2):166–175. doi: 10.1046/j.1365-2818.2003.01189.x. [DOI] [PubMed] [Google Scholar]
- Bormuth V, et al. LED illumination for video-enhanced DIC imaging of single microtubules. Journal of Microscopy. 2007;226(Pt 1):1–5. doi: 10.1111/j.1365-2818.2007.01756.x. [DOI] [PubMed] [Google Scholar]
- Cella Zanacchi F, et al. Live-cell 3D super-resolution imaging in thick biological samples. Nature Methods. 2011;8(12):1047–1049. doi: 10.1038/nmeth.1744. [DOI] [PubMed] [Google Scholar]
- Cody SH, et al. A simple method allowing DIC imaging in conjunction with confocal microscopy. Journal of Microscopy. 2005;217(Pt 3):265–274. doi: 10.1111/j.1365-2818.2005.01452.x. [DOI] [PubMed] [Google Scholar]
- Dooley K, Zon LI. Zebrafish: a model system for the study of human disease. Current Opinion in Genetics & Development. 2000;10(3):252–256. doi: 10.1016/s0959-437x(00)00074-5. [DOI] [PubMed] [Google Scholar]
- Field HA, et al. Analysis of gastrointestinal physiology using a novel intestinal transit assay in zebrafish. Neurogastroenterology and Motility: The Official Journal of the European Gastrointestinal Motility Society. 2009;21(3):304–312. doi: 10.1111/j.1365-2982.2008.01234.x. [DOI] [PubMed] [Google Scholar]
- Friedrich M, et al. STED-SPIM: Stimulated Emission Depletion Improves Sheet Illumination Microscopy Resolution. Biophysical Journal. 2011;100(8):L43–L45. doi: 10.1016/j.bpj.2010.12.3748. [DOI] [PMC free article] [PubMed] [Google Scholar]
- Grunwald DJ, Eisen JS. Headwaters of the zebrafish — emergence of a new model vertebrate. Nature Reviews Genetics. 2002;3(9):717–724. doi: 10.1038/nrg892. [DOI] [PubMed] [Google Scholar]
- Holmberg A, Olsson C, Hennig GW. TTX-sensitive and TTX-insensitive control of spontaneous gut motility in the developing zebrafish (Danio rerio) larvae. Journal of Experimental Biology. 2007;210(6):1084–1091. doi: 10.1242/jeb.000935. [DOI] [PubMed] [Google Scholar]
- Holmberg A, et al. Ontogeny of the gut motility control system in zebrafish Danio rerio embryos and larvae. Journal of Experimental Biology. 2004;207(23):4085–4094. doi: 10.1242/jeb.01260. [DOI] [PubMed] [Google Scholar]
- Huisken J, Stainier DYR. Selective plane illumination microscopy techniques in developmental biology. Development. 2009;136(12):1963–1975. doi: 10.1242/dev.022426. [DOI] [PMC free article] [PubMed] [Google Scholar]
- Jemielita M, et al. Comparing phototoxicity during the development of a zebrafish craniofacial bone using confocal and light sheet fluorescence microscopy techniques. Journal of Biophotonics. 2013;6(11–12):920–928. doi: 10.1002/jbio.201200144. [DOI] [PMC free article] [PubMed] [Google Scholar]
- Keller PJ, Stelzer EHK. Digital Scanned Laser Light Sheet Fluorescence Microscopy. Cold Spring Harbor Protocols. 2010;(5) doi: 10.1101/pdb.top78. 2010 p.pdb.top78. [DOI] [PubMed] [Google Scholar]
- Keller PJ, et al. Reconstruction of zebrafish early embryonic development by scanned light sheet microscopy. Science (New York, N.Y.) 2008;322(5904):1065–1069. doi: 10.1126/science.1162493. [DOI] [PubMed] [Google Scholar]
- Krzic U, et al. Multiview light-sheet microscope for rapid in toto imaging. Nature Methods. 2012;9(7):730–733. doi: 10.1038/nmeth.2064. [DOI] [PubMed] [Google Scholar]
- McCarter LL. Polar Flagellar Motility of the Vibrionaceae. Microbiology and Molecular Biology Reviews. 2001;65(3):445–462. doi: 10.1128/MMBR.65.3.445-462.2001. [DOI] [PMC free article] [PubMed] [Google Scholar]
- Mehta SB, Sheppard CJ. Partially coherent image formation in differential interference contrast (DIC)microscope. Optics Express. 2008;16(24):19462–19479. doi: 10.1364/oe.16.019462. [DOI] [PubMed] [Google Scholar]
- Mehta SB, Sheppard CJR. Sample-less calibration of the differential interference contrast microscope. Applied Optics. 2010;49(15):2954–2968. doi: 10.1364/AO.49.002954. [DOI] [PubMed] [Google Scholar]
- Milligan-Myhre K, et al. Study of host-microbe interactions in zebrafish. Methods in Cell Biology. 2011;105:87–116. doi: 10.1016/B978-0-12-381320-6.00004-7. [DOI] [PMC free article] [PubMed] [Google Scholar]
- Parthasarathy R. Rapid, accurate particle tracking by calculation of radial symmetry centers. Nature Methods. 2012;9(7):724–726. doi: 10.1038/nmeth.2071. [DOI] [PubMed] [Google Scholar]
- Pluta M. Advanced Light Microscopy: Specialized Methods. Elsevier Science & Technology Books; 1989. [Google Scholar]
- Preza C, Snyder DL, Conchello J-A. Theoretical development and experimental evaluation of imaging models for differential-interference-contrast microscopy. Journal of the Optical Society of America A. 1999;16(9):2185–2199. doi: 10.1364/josaa.16.002185. [DOI] [PubMed] [Google Scholar]
- Rawls JF, et al. In vivo imaging and genetic analysis link bacterial motility and symbiosis in the zebrafish gut. Proceedings of the National Academy of Sciences of the United States of America. 2007;104(18):7622–7627. doi: 10.1073/pnas.0702386104. [DOI] [PMC free article] [PubMed] [Google Scholar]
- Renshaw SA, et al. A transgenic zebrafish model of neutrophilic inflammation. Blood. 2006;108(13):3976–3978. doi: 10.1182/blood-2006-05-024075. [DOI] [PubMed] [Google Scholar]
- Santi PA. Light Sheet Fluorescence Microscopy A Review. Journal of Histochemistry & Cytochemistry. 2011;59(2):129–138. doi: 10.1369/0022155410394857. [DOI] [PMC free article] [PubMed] [Google Scholar]
- Schmid B, et al. High-speed panoramic light-sheet microscopy reveals global endodermal cell dynamics. Nature Communications. 2013;4:2207. doi: 10.1038/ncomms3207. [DOI] [PMC free article] [PubMed] [Google Scholar]
- Semova I, et al. Microbiota Regulate Intestinal Absorption and Metabolism of Fatty Acids in the Zebrafish. Cell Host & Microbe. 2012;12(3):277–288. doi: 10.1016/j.chom.2012.08.003. [DOI] [PMC free article] [PubMed] [Google Scholar]
- Swoger J, et al. 4D retrospective lineage tracing using SPIM for zebrafish organogenesis studies. Journal of Biophotonics. 2011;4(1–2):122–134. doi: 10.1002/jbio.201000087. [DOI] [PubMed] [Google Scholar]
- Taormina MJ, et al. Investigating Bacterial-Animal Symbioses with Light Sheet Microscopy. The Biological Bulletin. 2012;223(1):7–20. doi: 10.1086/BBLv223n1p7. [DOI] [PMC free article] [PubMed] [Google Scholar]
- Tomer R, et al. Quantitative high-speed imaging of entire developing embryos with simultaneous multiview light-sheet microscopy. Nature Methods. 2012;9(7):755–763. doi: 10.1038/nmeth.2062. [DOI] [PubMed] [Google Scholar]
- Truong TV, et al. Deep and fast live imaging with two-photon scanned light-sheet microscopy. Nature Methods. 2011;8(9):757–760. doi: 10.1038/nmeth.1652. [DOI] [PubMed] [Google Scholar]
Associated Data
This section collects any data citations, data availability statements, or supplementary materials included in this article.


