Abstract
Knowledge of the structure and speciation of aqueous Ni(II)-chloride complexes is important for understanding Ni behavior in hydrometallurgical extraction. The effect of concentration on the first-shell structure of Ni(II) in aqueous NiCl2 and NiCl2-MgCl2 solutions was investigated by Ni K edge X-ray absorption (XAS) and UV-Vis spectroscopy at ambient conditions. Both techniques show that no large structural change (e.g., transition from octahedral to tetrahedral-like configuration) occurs. Both methods confirm that the Ni(II) aqua ion (with six coordinated water molecules at R Ni-O = 2.07(2) Å) is the dominant species over the whole NiCl2 concentration range. However, XANES, EXAFS and UV-Vis data show subtle changes at high salinity (> 2 mol∙kg-1 NiCl2), which are consistent with the formation of small amounts of the NiCl+ complex (up to 0.44(23) Cl at a Ni-Cl distance of 2.35(2) Å in 5.05 mol∙kg-1 NiCl2) in the pure NiCl2 solutions. At high Cl:Ni ratio in the NiCl2-MgCl2-H2O solutions, small amounts of [NiCl2]0 are also present. We developed a speciation-based mixed-solvent electrolyte (MSE) model to describe activity-composition relationships in NiCl2-MgCl2-H2O solutions, and at the same time predict Ni(II) speciation that is consistent with our XAS and UV-Vis data and with existing literature data up to the solubility limit, resolving a long-standing uncertainty about the role of chloride complexing in this system.
Introduction
One of the most challenging tasks in the extractive metallurgy of nickel from ores or Ni-containing industrial wastes is its separation from Co and Cu [1,2]. Pospiech and Walkowiak [3] developed a separation method by taking advantage of the different tendency between Ni and Co to form complexes with the chloride ion [4,5]. Further development of these ionic exchange methods to remove trace Cu/Co from Ni chloride aqueous solutions require a profound understanding of the formation of Ni(II)-chloride complexes in NiCl2 aqueous solution.
A number of studies investigated Ni(II) aqueous solutions in the presence of excess Cl-ions (Cl/Ni >> 2) under a wide range of conditions using different techniques; a summary is given in Table 1. Most of these investigations [5–12] agree that the octahedral NiCl+ and [NiCl2]0 species are formed at ambient temperature. Other divalent transition metals such Cu(II) [13–15], Co(II) [4] and Zn(II) [16] form anionic tetrahedral-like MCl4 2—complexes in the presence of a large excess of HCl or LiCl at room-temperature. In contrast, the anionic [NiCl3(H2O)]-complex with tetrahedral-like configuration appears to be the highest order Ni(II) chloro-complex in aqueous solutions, and was observed only at elevated temperature [5].
Table 1. Previous studies on aqueous Ni(II) halide complexes in aqueous solutions.
| Method | T, P and salinity range* | Cl‒/Ni2+ ratio (Y) range | Species identified a | Ref. |
|---|---|---|---|---|
| X-ray absorption spectroscopy | 25–434°C, 400–600 bar, 0 m < Cltot < 7.68 m, Nitot = 0.2 m | 0.28 ≤ Y ≤42 | Oh-[Ni(H2O)6]2+, Oh-Ni(H2O)5Cl+, Oh-[NiCl2(H2O)4]0, Td-[NiCl2(H2O)2]0, Td-[NiCl3(H2O)]- | [5] |
| UV-Vis spectrophotometry | 26–250°C, 0.1 kbar, Cltot ≤ 3 m, 0.05 ≤ Nitot ≤ 0.1 m | 20 ≤ Y ≤ 54 | Ni2+, NiCl+, [NiCl2]0, [NiCl3]- | [10] |
| EXAFS | 25°C, Psat, 2 M ≤ Cltot ≤ 10 M, Nitot = 2 M | 2 ≤ Y ≤ 5 | Oh-[Ni(H2O)6]2+, Oh-[NiCl(H2O)5]+ | [9] |
| X-ray diffraction | 25°C, Psat, 4 M ≤ Cltot ≤ 6 M, Nitot = 2 M | 2 ≤ Y ≤ 5 | Oh-[Ni(H2O)6]2+, Oh-[NiCl(H2O)5]+, Oh-[NiCl2(H2O)4]0 | [11] |
| UV-Vis spectrophotometry | 25–320°C, Psat, 0 m ≤ Cltot ≤ 11 m | Y > 10 | Oh-[Ni(H2O)6]2+, Oh-[NiCl(H2O)5]+, Oh-[NiCl2(H2O)4]0, Oh-[NiCl3(H2O)3]-, Oh-[NiCl4(H2O)2]2–, Oh-NiCl5(H2O)3–, Oh-[NiCl6]4–, Td-[NiCl(H2O)3]+, Td-[NiCl2(H2O)2]0, Td-[NiCl3(H2O)]-, Td-[NiCl4]2– | [6] |
| UV-Vis spectrophotometry | 25°C, Psat, 0.12 M ≤ Cltot ≤ 13.7 M, Nitot = 0.06 M | 1 ≤ Y ≤ 228 | [Ni(H2O)6]2+, [NiCl(H2O)5]+, [NiCl2(H2O)4]0 | [12] |
| Polarography and UV-Vis spectrophotometry | 25°C, Psat, 1 M ≤ Cltot ≤ 13.9 M, Nitot = 0.03 M | 33 ≤ Y ≤ 463 | [Ni(H2O)5Cl]+ | [8] |
| UV-Vis spectrophotometry | 25°C, Psat, 0.12 M≤ Cltot ≤ 12.5 M, Nitot = 0.06 M | 1 ≤ Y ≤ 208 | [NiCl]+, [NiCl2]0 | [7] |
* m is molality and M is molarity.
a Complex geometries: Oh: octahedral; Td: tetrahedral.
The role and extent of chloride complexing in stoichiometric concentrated Ni(II) chloride solutions (Cl/Ni = 2) remains controversial [17–26]. There is broad agreement that the 6-fold-water-coordinated Ni(II) ion is the dominant complex in NiCl2 solutions up to high concentrations (4 mol∙L-1), a result supported by extended X-ray absorption fine structure (EXAFS) measurements [19,20,23], neutron diffraction measurements [22,24], and first principle molecular dynamics simulations [26]. However, some studies emphasize the existence of small but significant amounts of inner-sphere complexes in concentrated NiCl2 solutions. For example, on the basis of X-ray diffraction (XRD) studies, Magini [21] suggested the existence of about 8% NiCl+ complex in a 3.12 mol∙kg-1 NiCl2 solution, and Waizumi et al. [25] reported 0.4 Cl in the first coordination shell of Ni(II) at the solubility limit (5.06 mol∙kg-1 NiCl2). A recent Ni L2,3-edge X-ray absorption near edge structure (XANES) study showed less than ~10% Cl in the first coordination shell in a 1.5 mol∙L-1 NiCl2 solution [17]. However, the data show evidence for a distortion of the complex from octahedral symmetry, which was interpreted to reflect the presence of solvent-shared ion pairs.
Some XRD studies were also carried out on NiBr2 solutions to help resolve the ambiguities regarding the structure of NiCl2 solutions [27,28], as the Ni-Br distance is longer than the Ni-Cl distance, and Br-is a stronger X-ray scatter than Cl-. The results indicated the formation of strong inner-sphere complexes, with 0.29(3) Br-coordinated to Ni(II) in a 2 mol∙L-1 solution; this suggests that chloro-complexes exist in concentrated solutions of NiCl2 [27].
In this study we used a combination of X-ray absorption spectroscopy (XAS) and UV-Vis spectrophotometry to provide a molecular-level understanding of the effect of concentration on the speciation and structure of Ni(II)-chloride complexes in NiCl2 and NiCl2-MgCl2 solutions at concentrations ranging from dilute to the solubility limit at ambient temperature. A speciation-based mixed-solvent electrolyte (MSE) thermodynamic model is used to provide a speciation model that is consistent with most existing experimental and theoretical data on NiCl2-MgCl2 solutions. The results of our study can be used to predict Ni(II) behavior in high concentration brines for hydrometallurgical processing.
Experimental
Sample Preparation
NiCl2∙6H2O(s), NiSO4∙6H2O(s) and MgCl2∙6H2O(s) (99.8% purity) from Sinoreagent, China, were used as XAS standards and for solution preparation. All Ni(II) solutions were prepared gravimetrically and made freshly before the experiments. The sample solutions were prepared by dissolving NiCl2∙6H2O(s) in doubly deionized water. For the UV-Vis spectroscopic measurement, two series of solutions were prepared by gravimetrically mixing (i) deionized water with a 4.65 mol∙kg-1 NiCl2 stock solution (NiCl2-H2O system); and (ii) a 5.72 mol∙kg-1 MgCl2 + 0.05 mol∙kg-1 NiCl2 stock solution with a 0.05 mol∙kg-1 NiCl2 stock solution (NiCl2-MgCl2-H2O system). The chloride concentrations in the stock solutions were checked using the Ag chloride gravimetric method [76]. To suppress the hydrolysis of Ni(II), ~0.001 mol∙kg-1 hydrochloric acid (HCl(l), Sinoreagent, China, AR) was added to all the Ni-Cl and Ni-Mg-Cl solutions; spectrographic measurements of acidified and non-acidified solutions were identical. The compositions of both systems were listed in the S1 and S2 Tables. In order to establish a reference free of Ni(II)-chloride complexes at different ionic strengths, two Ni(II) perchlorate solutions (0.05 and 4.46 mol∙kg-1) were prepared by mixing hexahydrate Ni(ClO4)2(s) (Sinoreagent, China, AR) with deionized water.
XAS measurement and analysis
The coordination environment of Ni(II) in solutions containing 1, 2, 4 and 5.05 mol∙kg-1 NiCl2 was characterized using XAS data obtained at the XAS beamline of the 1.5–2.2 GeV Beijing Synchrotron Radiation Facility (BSRF). This beamline has a Si(111) double-crystal monochromator with an energy resolution of 1.25 eV at the Ni K-edge (8333.0 eV). Data on solutions and solid samples were acquired in transmission mode. The solutions were placed in a cell that consisted of a square-shaped Kapton spacer having a thickness from 125 to 605 μm; the higher concentration of solution, the shorter the path length that was used. The liquid samples were injected into the cell with a micro-syringe. For the solid samples, a layer of powder was placed on a flat Kapton substrate.
EXAFS data were analyzed using the HORAE package [29], with amplitude and phase shifts calculated using FEFF6 [30]. The fits were performed in R-space using k 3-weighting and a Hanning window. The fit parameters include the scale factor (), the energy shift (△E 0), the number of oxygen (water molecule, N O) and chlorine (N Cl) in the first coordination shell of Ni(II), the bond distances R O and R Cl, and the Debye-Waller factors for the O and Cl atoms (,). A value = 0.83(7) was obtained from fitting the EXAFS spectra of the two solid standards; this value is in excellent agreement with previous studies (5,31), and was used for fitting all the samples.
UV-Vis measurements
Spectrophotometric measurements were carried out using a Shimadzu (Japan) UV-2550 double-beam spectrophotometer at room temperature. Sample solutions of the NiCl2-H2O and NiCl2-MgCl2-H2O systems were placed in 1 and 10 mm rectangular quartz cells, respectively. Dual-beam mode was used with the reference cell containing deionized water. The data were baseline-corrected using measurements of two water-filled cuvettes. Spectra were recorded at a 1.0 nm interval over the range 300–850 nm, and the absorbance range was typically between 0 and 3 absorbance units. The experimental error was estimated by multiple scans (5 times) of two solutions with 0.1 and 4 mol∙kg-1 NiCl2. The difference between these repeat spectra was generally less than 0.002–0.005 absorbance units.
The raw UV-Vis and XAS data are provided in the supporting information (S1–S10 Tables).
Results and Discussion
XAS investigation
XANES analysis
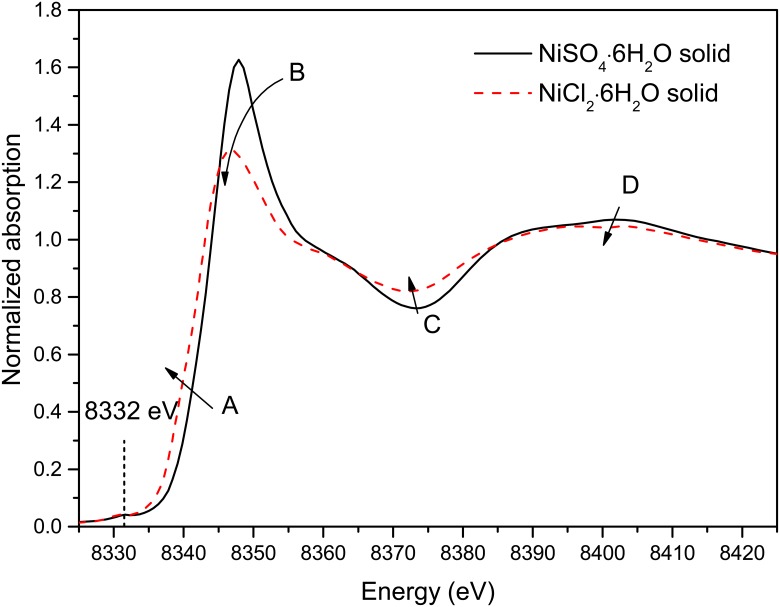
Fig 1 shows the XANES spectra (Raw spectral data was collected in S1–S4 Tables) for the NiSO4∙6H2O(s) and NiCl2∙6H2O(s) reference compounds, which contain octahedral [Ni(H2O)6] [32] and [NiCl2(H2O)4] moieties [33], respectively. The main spectral differences between the two spectra are: (i) presence of a shoulder at ~8340 eV attributed to the 1s to 4p transition [31] in NiCl2∙6H2O(s) (feature A); (ii) a lowering of the intensity of the white line (feature B) and shift of its position by ~ -1.2 eV in NiCl2∙6H2O(s) relative to NiSO4∙6H2O(s); as well as (iii) reduced intensity of the oscillation in the 8360 to 8420 eV region in NiCl2∙6H2O(s) (features C and D in Fig 1).
Fig 1. Normalized Ni K-edge XANES spectra for the two solid compounds.
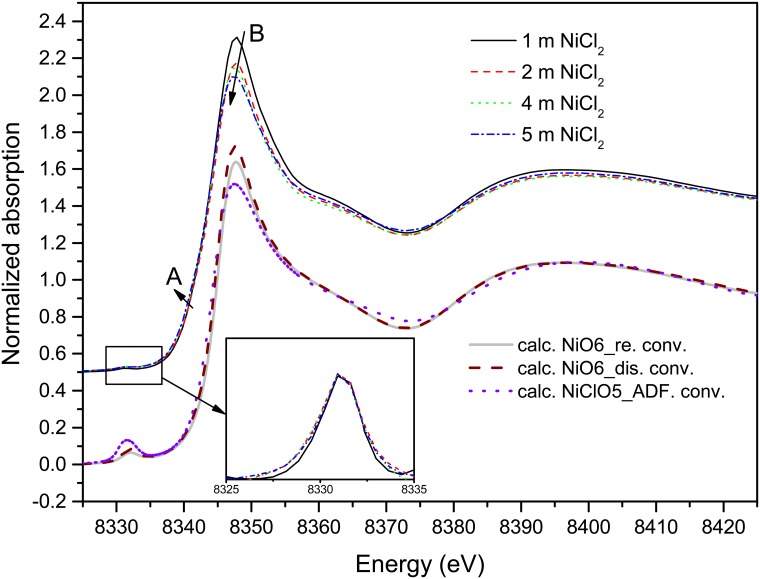
The Ni K-edge XANES spectra (Raw spectral data was collected in S5–S8 Tables) of solutions with various NiCl2 concentrations at room temperature are plotted in Fig 2 with the XANES spectra calculated by Tian et al. [5] using ab initio XANES simulations for the NiO6 and NiO5Cl clusters. The spectra of the four solutions are similar and show features that are characteristic for octahedral transition metal complexes [5,31,34]. A slight decrease (9.7%) of the white line intensity and a subtle energy shift (0.4 eV) of the white line to lower energy (feature B in Fig 2) are observed as the NiCl2 concentration increases from 1 to 5.05 mol∙kg-1. Therefore, the changes affecting the white line region of the solution spectra are analogous with the difference of XANES spectra of the two solid reference compounds and are consistent with some Cl entering the first coordination sphere of Ni(II) upon increasing salt concentration. Similar spectral changes are confirmed by the XANES simulations of Ni clusters (Fig 2). In addition, the XANES calculations show that the differences in features C and D observed for the solid standards are due to second-shell contributions. The only significant difference between the experimental and simulated spectra lies in the pre-edge peak intensity (feature around 8332 eV), which is associated with a 1s→3d photoelectron transition and is sensitive to the local geometry of the Ni site [5,35,36]. There is no change observed in the experimental spectra (inset in Fig 2), whereas the XANES simulations predict an increase in intensity of this pre-edge upon replacement of a water molecule by a chloride ion in the Ni(II) coordination sphere. Tian et al. [5] similarly failed to confirm this feature experimentally. Overall, the XANES data are consistent with octahedral Ni(II) aqua complexes being present over the whole NiCl2 concentration range, with minor amounts of chloride complexing taking place at high salt concentration.
Fig 2. Normalized Ni K-edge XANES spectra of nickel complexes as a function of concentration (thin lines).
Baseline-removed pre-edges are shown as a function of concentration in inset for clarity. Thick lines are the calculated (convoluted) XANES spectra for Ni aqueous species using fully hydrated regular (re.) and distorted (dis., DFT optimized), as well as [NiCl(H2O)5]2+ (ADF., DFT optimized) octahedral configuration models from literature [5].
EXAFS analysis
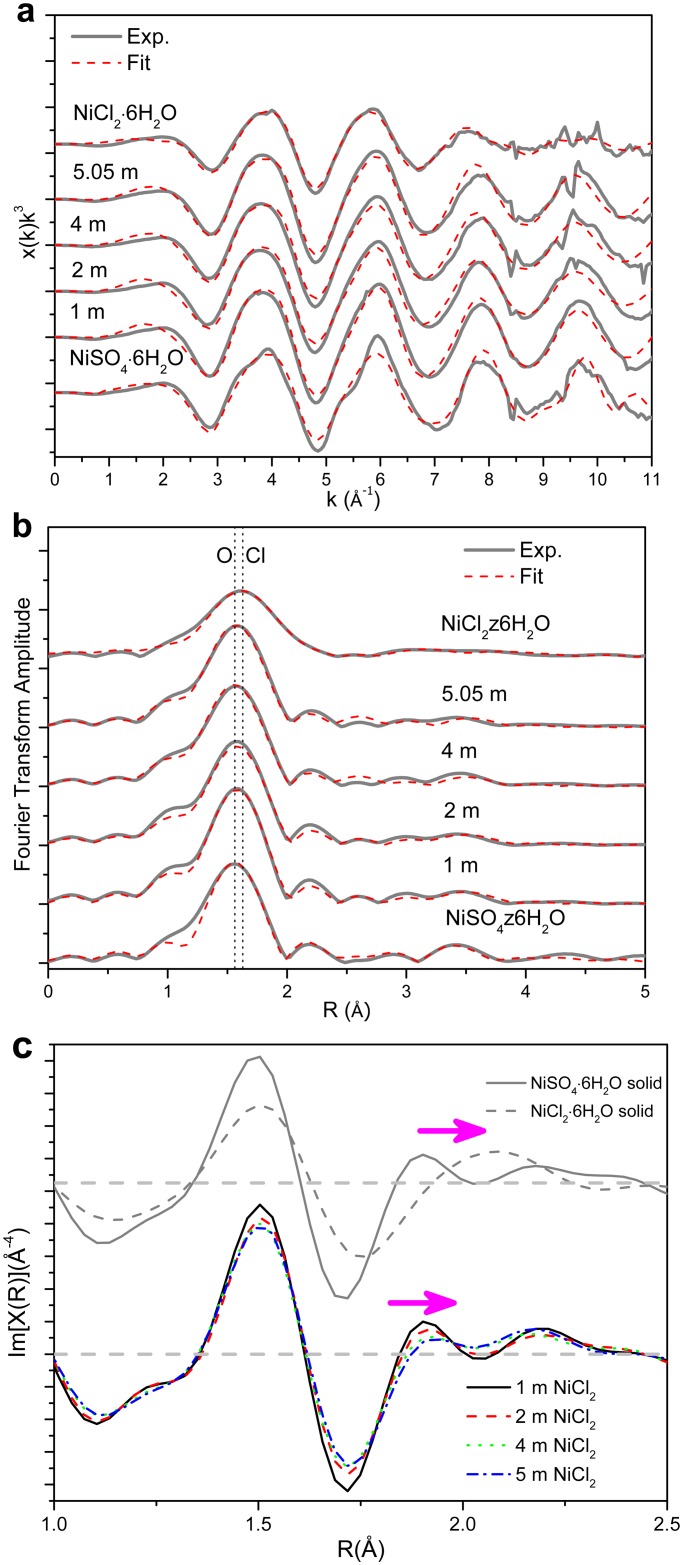
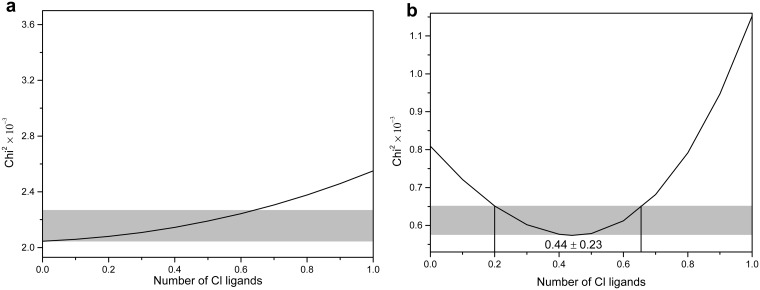
The Ni K-edge EXAFS k- and R-space spectra for the two solid standards and the four solutions are shown in Fig 3. The small amount of replacement of water molecules by chloride ions upon increasing NiCl2 concentration is clearly shown by the phase shift in the imaginary part of the EXAFS Fourier transform (arrow in Fig 3c). In the final analysis, Ni(II) coordination was constrained to be 6, consistent with the result of octahedral configuration obtained from XANES data; the fitting results are listed in Table 2. For all solutions, the refined Ni-O bond distances are 2.07(2) Å, which is consistent with earlier studies [31,37]. For the 1 and 2 mol∙kg-1 NiCl2 solutions, the fully hydrated ([Ni(H2O)6]2+) model reproduced well the experimental k-space and R-space EXAFS spectra. The effect of replacing one of the water molecules with a chloride ligand on the fit quality (reduced chi-square, χ2 [38]) of the 2 mol∙kg-1 NiCl2 solution is illustrated in Fig 4a. The absolute minimum of χ2 is located at 0 chloride, and the residuals increase slowly with addition of Cl, resulting in a large uncertainty at the 90% confidence level. In contrast, χ2 shows a minimum at 0.44 Cl for the 5.05 mol∙kg-1 NiCl2 corresponding to the “deepest” depression with an uncertainty of +/– 0.23 Cl (Fig 4b). As expected, the Cl-ion resides at a longer distance than O (R Ni-Cl 2.35(2) Å vs. R Ni-O 2.07(2) Å) due to the larger hard-sphere radius. These results are close to those obtained using XRD by Waizumi et al. [25]; for a 5.06 mol∙kg-1 NiCl2 solution, these authors reported N Ni-O = 5.6 ± 0.2 and R Ni-O = 2.06(2) Å; and N Ni-Cl = 0.4 ± 0.2 and R Ni-Cl = 2.37(2) Å.
Fig 3. Ni K-edge k 3-weighted EXAFS (a), and the amplitude (b) and imaginary part (c) of their Fourier transforms of the two solid compounds and four NiCl2 solutions.
The dot line is the position of Ni-O and Ni-Cl peaks.
Table 2. Results of Ni EXAFS analysis of the Ni(II) first shell structure under ambient conditions.
| Ni-O interaction | Ni-Cl interaction | ||||||||||
|---|---|---|---|---|---|---|---|---|---|---|---|
| Composition of system | △E0(eV) | N O | R Ni-O(Å) | × 103 | N Cl | R Ni-Cl(Å) | × 103 | k-range | R-range | R-factor | Ref. |
| 1.00 | –3.86(0.55) | 6.0 a | 2.07(06) | 5.4(6) | - | - | - | 2–10 | 1–5 | 0.014 | This work |
| 2.00 | –4.15(0.65) | 6.0 a | 2.07(09) | 7.1(8) | - | - | - | 2–10 | 1–5 | 0.021 | This work |
| 4.00 | –4.90(0.98) | 5.8 b (3) | 2.06(1) | 4.8(7) | 0.2 b (3) | 2.38(1) | 8.4(27) | 2–10 | 1–5 | 0.014 | This work |
| 5.05 | –3.46(0.93) | 5.6 b (3) | 2.08(1) | 2.4(5) | 0.4 b (3) | 2.35(2) | 7.3(21) | 2–10 | 1–5 | 0.023 | This work |
| NiSO4∙6H2O c | 2.68(1.00) | 2.0 a | 2.02(3) | 3.0 a | 2–10 | 1–5 | 0.030 | This work | |||
| 2.0 a | 2.03(3) | 3.0 a | 2–10 | 1–5 | 0.030 | This work | |||||
| 2.0 a | 2.13(5) | 3.0 a | 2–10 | 1–5 | 0.030 | This work | |||||
| NiCl2∙6H2O c | –1.19(1.53) | 4.0 a | 2.07(2) | 9(2) | 2.0 a | 2.36(4) | 13.4(42) | 2–10 | 1–5 | 0.009 | This work |
| 3.12 d | - | 5.92 | 2.07(1) | - | 0.08 | 2.44(1) | - | - | - | - | [21] |
| 5.06 d | - | 5.6(2) | 2.06(2) | - | 0.4(2) | 2.37(2) | - | - | - | - | [25] |
The results for 3.12 and 5.06 mol∙kg-1 NiCl2 solutions using X-ray diffraction [21,25] are also listed. The concentrations are expressed in molality (mol∙kg-1). Uncertainty limits are given in parentheses.
a Value fixed (not optimized) during refinements.
b Sum of number of O and Cl fixed to be equal to 6.
c Solid standard.
Fig 4. The distribution maps of analysis error of XAS spectra for 2 mol∙kg-1 (a) and 5.05 mol∙kg-1 (b) NiCl2 solution as a function of number of Cl ligands.
The gray area represents 90% confidence level.
UV-Vis spectroscopy investigation
Qualitative analysis of UV-Vis spectra
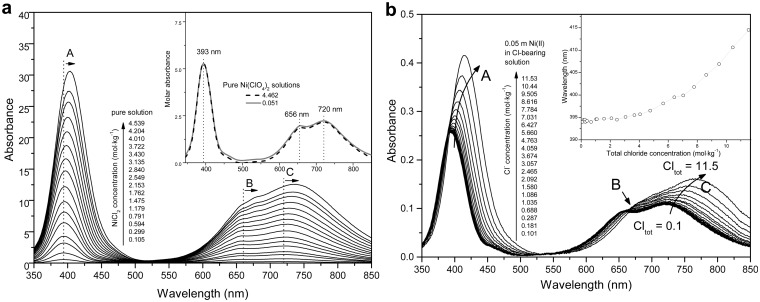
The baseline-corrected room-temperature spectra (Raw spectral data was collected in S9 and S10 Tables) for both sets of solutions, one with systematically increasing NiCl2 concentration and the other containing constant Ni(II) (0.05 mol∙kg‒1) but systematically increasing the MgCl2 concentration, are presented in Fig 5a and 5b, respectively. The spectra show two characteristic absorption features at 350–500 and 600–800 nm. With increasing NiCl2 concentration, the absorbance increases and the spectra display a systematic red-shift: the band in the range of 350–500 nm shifts from ~393 to ~405 nm (arrow A in Fig 5a), and the bands in the 600–800 nm range (arrows B and C in Fig 5a) shifts from ~720 to ~737 nm and ~656 to ~670 nm, respectively. These features become more pronounced for the Ni-Mg-Cl system at higher MgCl2 concentration, with the ~393 nm band shifting up to ~415 nm (inset in Fig 5b) and the ~720 band shifting to ~770 nm. The shoulder at ~654 nm becomes weaker (arrow B in Fig 5b, almost vanishing) at the higher chloride concentration. To check the effect of ionic strength on the UV-Vis spectra, solutions of 0.05 and 4.46 mol∙kg-1 Ni(ClO4)2 were measured (inset in Fig 5a). No shift of the peak position was observed, and the molar absorbance coefficients remained nearly constant. Deviations from the Beer-Lambert law at high salinity [75,40] can be due to the influence of the dielectric constant of the medium on the absorption of light by a particular complex [41], or to changes in the electronic structure of the complex induced by changes in the structure of the solvent and in the outer coordination shells of the complex. These effects can be difficult to quantify. The Ni(II) perchlorate data in Fig 5a, however, clearly indicate that the structure of the Ni(II) aqua ion is not sensitive to changes in solvent structure as the salt concentration changes from 0.05 to 4.5 mol∙kg-1; this stable structure was also confirmed by the neutron diffraction study of Newsome et al. [42]. Consequently, the Beer-Lambert law appears to be obeyed up to high salinity in this system.
Fig 5. Background-subtracted UV-Vis spectra of (a) NiCl2-H2O system with salt concentration range from 0.1 to 4.5 mol∙kg-1 at room temperature; background subtracted molar absorbance of Ni(ClO4)2 solutions with 0.05 and 4.46 mol∙kg-1 salt concentration are shown in inset; and (b) NiCl2-MgCl2-H2O system, for a constant NiCl2 concentration of 0.05 m and MgCl2 concentrations from 0 to 5.7 m.
The inset show the location of the band at ~400 nm as a function of total Cl concentration.
Ligand field theory can be used to describe the electronic absorption spectra of first row transition metal complexes. For the [Ni(H2O)6]2+ species at room temperature, the bands at 800–550 nm and ~500–350 nm are assigned to the 2A2g→3T1g and 3A2g→3T1g(P) transitions of the octahedral structure, respectively [10]. The spin-orbit coupling that mixes the 3T1g(F) and 1Eg states results in the 3A2g to 3T1g transition band in the 800–550 nm range being split with a main peak at ~720 nm and a shoulder at ~656 nm [43], which is consistent with a splitting of approximately 18 eV (~68 nm) observed in the Ni L2,3-edge XANES spectra [17].
The peak shift observed as a function of NiCl2 and MgCl2 concentrations reflects the progressive replacement of a H2O ligand by a chloride ion around Ni(II) within the first coordination shell, because the d-d splitting caused by the chloride ion is at lower energy than that produced by water [10]. Since the spectral changes observed via UV-Vis are mainly related to inner-sphere complexing, we performed a quantitative treatment of the UV-Vis dataset to retrieve species concentrations and thermodynamic properties of the Ni(II)-chloride complexes.
Speciation model and activity coefficients calculations for quantitative analysis
The quantitative treatment was based on the Beer-Lambert law, following the approach developed by Brugger et al. [13] and implemented in the BeerOz program [39]. The analysis deconvolutes the measured matrix of absorbances into spectra for individual absorbing species (molar absorptivity coefficients) present in solutions, and a matrix of concentrations of these species in each solution. The species concentrations are constrained by a thermodynamic model (mass action and mass balance equations) so that the analysis refines formation constants (log10 K) of aqueous Ni(II)-chloride complexes rather than actual species concentrations. The spectral dataset was restricted to the wavelengths over which peaks are present (350–550 nm and 580–850 nm). Prior to the analysis of the spectra, the usual molarity scale-based Beer’s law was converted to a molality absorbance by dividing a transfer factor, f, defined as a function of density of electrolyte [13,39], which was calculated in present study by the method as described in Zhang et al. [14].
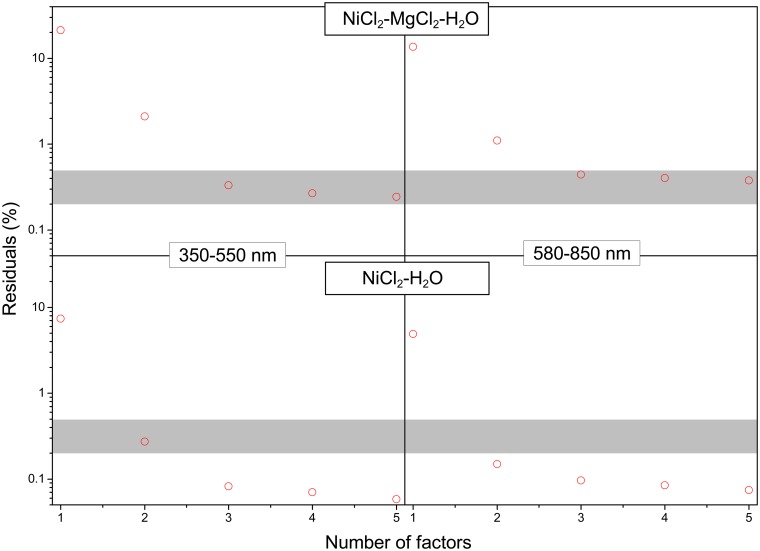
Based on the analysis of XAS data above, two main Ni(II) species are present in NiCl2 solutions: the fully hydrated aqua ion and the monochloro complex. Principal component analysis (PCA) [44] confirms that two species are required to explain the UV-Vis data for the pure NiCl2 solutions within experimental error (Fig 6). In contrast, three species are required to explain the NiCl2-MgCl2-H2O system dataset (Fig 6), suggesting that [NiCl2]0 may be present in the solutions with the highest ionic strength. This is also consistent with the XAS results of Tian et al. [5]; consequently, the analysis was conducted using the Ni2+, NiCl+ and [NiCl2]0 species. The minor species H+ and [HCl]0 were also included in the speciation model, with the formation constant of the neutral ion pair, [HCl]0, taken from the result of Sverjensky et al. [45] (Table 3).
Fig 6. Principal component analysis results for NiCl2-H2O and Ni-MgCl2-H2O system in 350–550 nm and 580–850 nm absorbance bands, respectively.
The circle is calculated by 100 ×, where x calc and x meas are the model and observed value, respectively. The gray area stands for the level of experimental error of 0.2%-0.5%.
Table 3. The solubility product of solid phase in MSE and Pitzer model and the formation constant of NiCl+ and [NiCl2]0 species determined in this study.
| log10 K/log10 K sp | |||||
|---|---|---|---|---|---|
| Phase | Reaction | MSE | Pitzer | HSC§ | Ref. |
| Solid | MgCl2∙6H2O = Mg2+ + 2Cl-+ 6H2O | 4.4 (+0.2/–0.3) | 4.5 (+0.1/–0.2) | - | This work |
| - | 4.307* £ | - | [46] | ||
| - | - | 4.455 | [47] | ||
| NiCl2∙6H2O = Ni2+ + 2Cl-+ 6H2O | 3.2 (+0.1/–0.2) | 3.1 (+0.2/–0.1) | - | This work | |
| 3.133 | - | 3.180 | [48] | ||
| NiCl2∙4H2O = Ni2+ + 2Cl-+ 4H2O | 3.9 (+0.1/–0.1) | 3.2 (+0.3/–0.1) | - | This work | |
| 3.985 | - | 3.713 | [48] | ||
| Phase | Reaction | MSE | Others | HKF | Ref. |
| Aqueous | H+ + Cl- = HCl(aq) | –0.711 | [45] | ||
| Ni2+ + Cl- = NiCl+ | 0.09 (–0.05/+0.03) | - | This work | ||
| –0.43 | [10] | ||||
| –0.5 | [49] | ||||
| –1.31 (+0.07/–0.07) | [12] | ||||
| –2.0 (+0.2/–0.2) | [7] | ||||
| Ni2+ + 2Cl- = [NiCl2]0 | –6.6 (–0.5/+0.4) | This work | |||
| –0.95 | [10] | ||||
| –4.1 (+0.4/–0.4) | [12] | ||||
| –4.5 (+0.5/–0.5) | [7] | ||||
The association constant of [HCl]0 aqueous species used in the calculation is also listed.
Uncertainty limits are given in parentheses.
* The solubility products were converted from mole fraction-scale in the literatures to molality-scale.
£ Value was calculated by Pitzer−Simonson−Clegg (PSC) model [46].
§ Values were calculated by HSC software (H = enthalpy, S = entropy, C = heat capacity) in literature [48].
¶ The activity coefficient model assumed γ ion = γ ±,ion.
In order to calculate the distribution of species in concentrated NiCl2 solutions, activity coefficients need to be available for all the species in the model. The “b-dot” equation developed by Helgeson and Kirkham [50] is a popular method for calculating activity coefficients, used for example by Liu et al. [10] in their UV-Vis study of Ni(II)-chloride complexes in chloride brines up to high temperature. This model is well suited for relatively dilute solutions (ionic strength ≤ 2 molal), though some studies extended the approach to higher salinities (10,1–15,40). The ion-interaction Pitzer model [51] is a popular semi-empirical approach used to describe the thermodynamics of concentrated electrolyte solutions. Originally, Pitzer’s model assumed full dissociation of electrolytes, but several authors [52–54] have introduced speciation-based extensions to the theory. In the present study, we implemented the speciation-based mixed-solvent electrolyte (MSE) model [55–57]. This comprehensive and self-consistent model has the following advantages: (i) it is a speciation-based model, taking complexation reactions explicitly into account; (ii) it provides a bridge to the Helgeson-Kirkham-Flowers (HKF) approach [50,58], so that predictions can be expanded over a wide range of pressures and temperatures; (iii) it covers the full concentration range from highly dilute to the solubility limit. The standard-state properties calculated from the model of Helgeson and Kirkham [59] are based on the molality concentration scale and on the infinite-dilution reference state and result in large excess properties in concentrated solutions, whereas the activity coefficients in the MSE framework are based on the mole fraction scale and are symmetrically normalized (i.e., unit activity coefficients for xi = 0 and xi = 1).
In the MSE model, the activity coefficient of any aqueous species k is expressed as a sum of three terms,
| (1) |
where LR represents the long-range electrostatic interactions between ions at low concentrations, calculated using the Pitzer-Debye-Hückel expression [55,60]; SR is the short-range contribution resulting from intermolecular interactions, calculated by the UNIQUAC equation [61]. As ions are the dominant species in this study, the short-range term can be neglected [62]. MR is an additional symmetrical second virial coefficient-type (middle-range) term, which represents primarily ionic interactions (i.e., ion-ion and ion-molecule) that are not accounted for by the LR term. The MR term is given by [55]
| (2) |
where i and j represent aqueous species (ions or molecules), x is the mole fraction, n is the mole number and B ij(I x) are binary interaction parameters, which are assumed to be symmetric, i.e., B ij(I x) = B ji(I x), and B ii(I x) = B jj(I x) = 0, and dependent on the ionic strength, with
| (3) |
where
| (4) |
| (5) |
For the final fit, the MSE MR parameters b 0,ij and c 0,ij (Table 4), the formation constants log10 K(NiCl+) and log10 K([NiCl2]0), and the molar absorptivity coefficients for NiCl+ and [NiCl2]0 were optimized by using non-linear least squares [39] to minimize the residual function χ 2,
Table 4. MSE middle-range ion interaction parameters in this study.
| Species i | Species j | b 0,ij | c 0,ij |
|---|---|---|---|
| Ni2+ | Cl- | –54.9768 | 69.0819 |
| NiCl+ | Cl- | –28.5398 | - |
| Ni2+ | Mg2+ | –33.8995 | 50.9434 |
| NiCl+ | Mg2+ | –6.8626 | - |
| [NiCl2]0 | Mg2+ | –0.0984 | - |
| Mg2+ | Cl- | –82.4238 | 112.1769 |
| (6) |
The experimental data consisted of the UV-Vis spectra data for 16 solutions with NiCl2 concentrations ranging from 0.1 to 4.53 mol∙kg-1, and for 23 solutions with a constant Ni(II) concentration (~0.05 mol∙kg-1) with MgCl2 concentrations ranging from 0 to 5.72 mol∙kg-1 (), together with the experimental mean activity coefficient data of NiCl2 solutions at room temperature () [63], and the solubility data in the NiCl2-MgCl2-H2O ternary system () [64]. In Eq (6), V is the total number of wavelengths at which measurements were made, and U is the number of solutions. and are the measured and calculated absorbance at wavelength v for solution u. w 1, w 2 and w 3 are weighting factors and are set as 0.5, 1.0 and 1.0, respectively, in the present study. and are the experimental and calculated mean activity coefficient of solution l; the experimental activity coefficients show a deviation from ideal behavior at high concentration due to the formation of Ni(II)-chloride complexes [63], and can be described as a combination of an ideal stoichiometric activity coefficient, and the effect of complexation. Aparicio and Elizalde [65] calculated the experimental mean stoichiometric activity coefficient for an electrolyte containing a significant amount of complexes (ZnCl2 solutions), and their approach is used here:
| (7) |
where υ + and υ − are the number of Ni2+ and Cl-ions, whose activity coefficients are γ + and γ − calculated by the MSE model, and m + and m —are their respective equilibrium concentrations in molality; υ = υ ++υ −; and m is the conventional total NiCl2 concentration (in molal). The Mg2+-Cl-mixing parameters were refined from the mean stoichiometric activity and water activity data [66] (Table 5). K sp in Eq (6) represents the solubility product of the solid phase Mv+Xv–∙nH2O, which is an equilibrium reaction with aqueous species and given by
| (8) |
K sp is calculated by
| (9) |
where a is the activity, γ is the activity coefficient calculated by Eq (1), and m is the concentration in molality. In this work, the solid phases MgCl2∙6H2O and NiCl2∙nH2O (n = 4, 6) in the ternary system NiCl2-MgCl2-H2O at room temperature are involved for reproducing experimental solubility data [64].
Table 5. Experimental data used for parameters estimation.
* Water activity data
** Solid liquid equilibrium data
Due to the low concentration of [NiCl2]0 present in the solution, correlations among concentration and molar absorptivity coefficients [39,40], and the large number of parameters involved in the regression, a step-wise approach was required to obtain a self-consistent solution for the NiCl2-MgCl2-H2O system: 1) refine the molar absorbance of the NiCl+ species, the formation constant of NiCl+, and the mixing parameters for the Ni2+-Cl-and NiCl+-Cl-interaction based on the NiCl2-H2O system spectrophotometric data. 2) The molar absorbance and formation constant of [NiCl2]0 species were fixed using the results of step 1). 3) We then refined the molar absorbance and formation constant for [NiCl2]0 species, as well as the mixing parameter based on the NiCl2-MgCl2-H2O system spectrophotometric data.
Results of the quantitative analysis of UV-Vis data
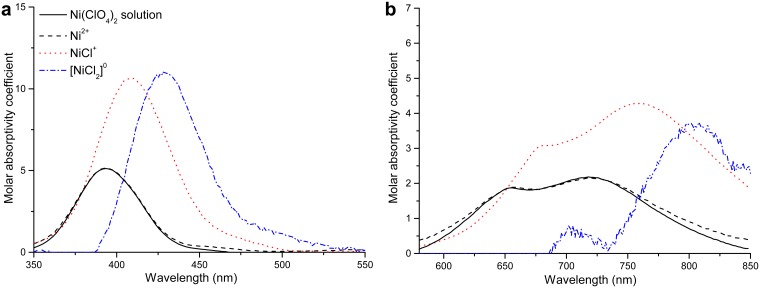
The analysis provides a good agreement between experimental and calculated spectra; for the 350–550 nm range, the largest differences (in absorbance unit) were 0.05 (NiCl2-H2O system) and 0.07 (NiCl2-MgCl2-H2O system); and for the 580–850 nm range, 0.012 and 0.006, respectively. The regressed MSE ion interaction parameters are presented in Table 4, and the optimized formation constants of Ni(II)-chloride complexes and the solubility products of solids obtained from solid-liquid equilibrium data and spectral data are reported in Table 3 together with the comparison of log10 K sp/log10 K values at 25°C from this work and the literature [7,10,12,46,47,48,], respectively. The uncertainties of formation constants for NiCl+ and [NiCl2]0 at the 90% confidence level are also listed; they are derived from residual maps as described in the literature [39]. The molar absorptivity spectra of individual Ni(II)-chloride complexes are shown in Fig 7. The molar absorptivity spectra of individual Ni(II)-chloride complexes show a shift to lower energy (red-shift) with increasing substitution of chloride ions. We also conducted a fit in which we refined the molar absorptivity coefficients for the Ni(II) species; the refined the molar absorptivity spectrum is close to the spectrum fixed from measurement of the Ni(ClO4)2 solution, indicating that the analysis method is reliable. There is a large increase in molar absorptivity from Ni2+ to NiCl+; the change in intensity between NiCl+ and [NiCl2]0 was model-sensitive, which is attributed to the low concentration of this complex in the studied solutions. For the 580–850 nm region (Fig 7), the analysis only reveals a red-shift for the molar absorbance spectrum of [NiCl2]0, but failed to provide a realistic molar absorptivity spectrum for this complex. The changes of the calculated spectra of each individual Ni(II) species are analogous with the results obtained for minor amounts of Ni(II) in NaCl solutions at elevated temperatures [10].
Fig 7. Molar absorptivity spectra of individual Ni(II)-chloride species obtained from the analysis of two absorptive band (left, 350–550 nm and right 580–850 nm) spectroscopic data for NiCl2-H2O and NiCl2-MgCl2-H2O systems at room temperature.
The molar spectrum for Ni(ClO4)2 solution at room temperature is plotted as solid line for comparison.
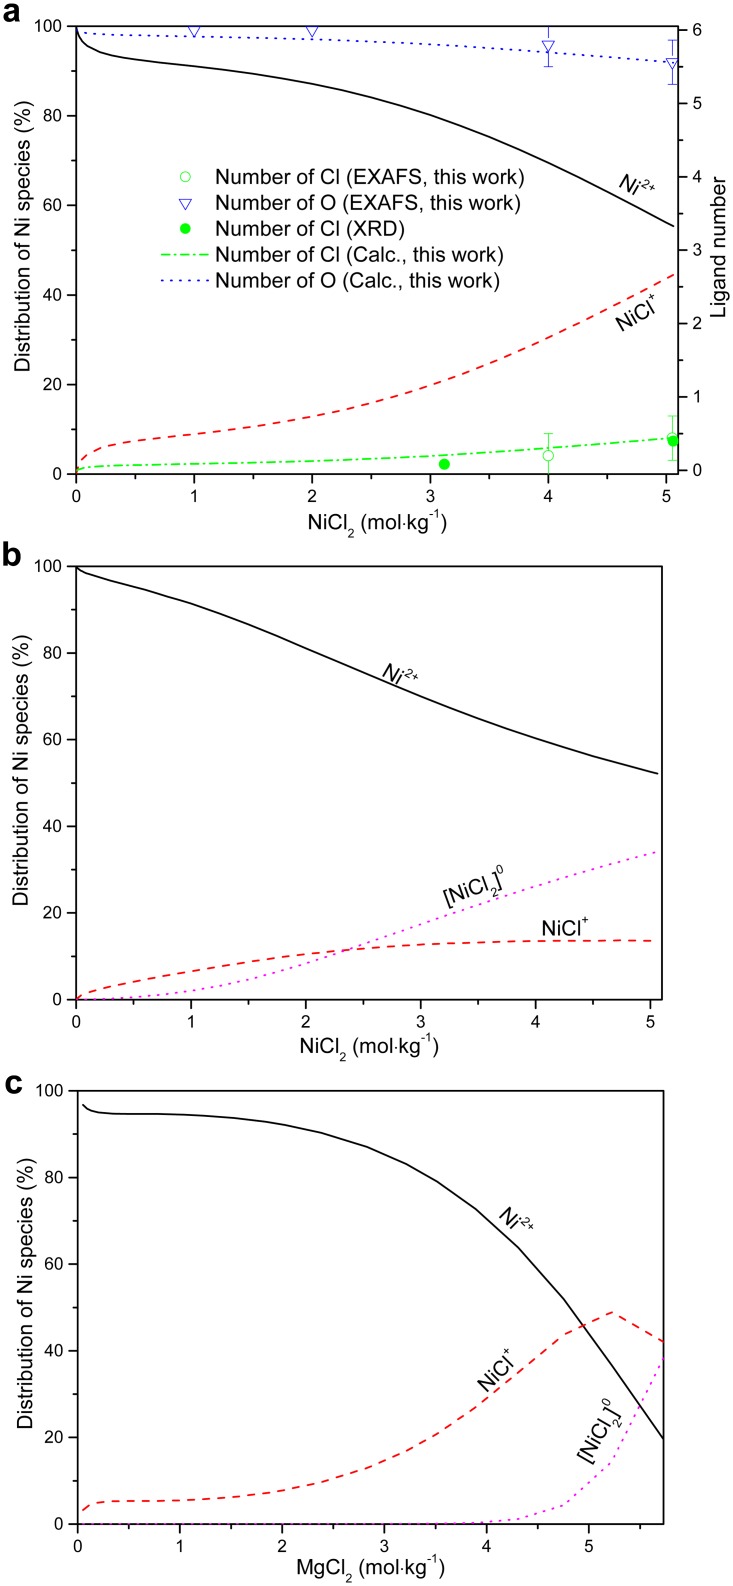
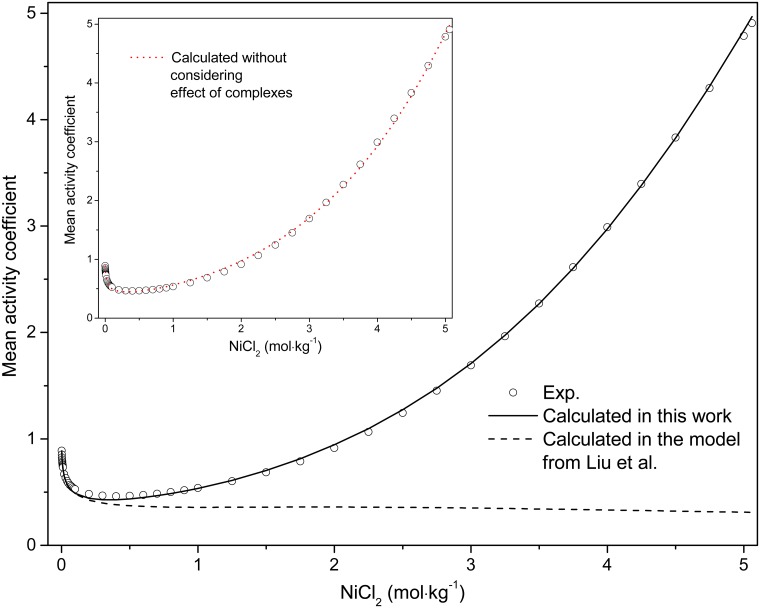
The formation constant of NiCl+ in this work is larger than that reported in the potentionmetric study of Libus and Tialowska [49] and in the spectrophotometric studies of Bjerrum [7], Liu et al. [10] and Paatero and Hummelstedt [12], whereas that of the neutral [NiCl2]0 complex is more negative than that reported by Liu et al. [10] (Table 3) but closer the values from Bjerrum [7] and Paatero and Hummelstedt [12]. The distributions of absorbing species in the NiCl2-H2O and NiCl2-MgCl2-H2O solutions calculated with the new model show a larger percentage of the NiCl+ complex in the NiCl2-MgCl2-H2O solutions (higher Cl/Ni ratio) compared to the NiCl2-H2O solutions, implying a stronger association in the former solutions (Fig 8a and 8c). In addition, the neutral complex [NiCl2]0 can account up to ~38% Ni(II) in the MgCl2 solutions. For comparison, we calculated the distribution of Ni(II) species in NiCl2-H2O solutions using Liu et al. [10]’s model, in which the activities of the species are calculated using the “b-dot” equation (Fig 8b). The agreement is good at low NiCl2 concentrations (< 1 mol∙kg-1 NiCl2). However, the predictions diverge with increasing electrolyte concentration, with Liu et al. [10]’s model showing the neutral complex, [NiCl2]0, playing an important role (up to ~30%) in pure NiCl2 solutions at high concentrations, while our model and UV-Vis data suggest that no significant [NiCl2]0 is present (Fig 8a). This apparent contradiction is the result of the poor description of activity-composition relationships in highly saline solutions in the HKF model. The experimental mean activity coefficient of NiCl2 solutions is compared to the values calculated using the MSE parameters and the model of Liu et al. [10] in Fig 9. The mean activity coefficient calculated in this work agrees well with the experimental data [63], while Liu et al. [10]’s model only reproduces the data at low NiCl2 concentrations (≤ 0.5 mol∙kg-1), with increasingly significant deviations occurring with increasing salt concentrations.
Fig 8. Distribution of Ni(II) species in NiCl2-H2O (a, b), and NiCl2-MgCl2-H2O (c) solutions and average number of ligand in the first shell of Ni2+ as a function of NiCl2 solution concentration.
In (a) and (c), the distributions of species are calculated with the formation constant and MSE parameters determined in this study (all lines); in (b), the distributions of species was calculated for NiCl2 solutions using the model and parameters from literature [10]; In (a), the calculated average numbers of ligands in the first shell of Ni2+ are compared with the number of ligands extracted by EXAFS (Cl ligand, empty circles with error bar; O ligand, triangles with error bar) and XRD [21,25] (Cl ligand, filled circles) analysis are shown for comparison; and (b) the result using the model and parameters from literature [10].
Fig 9. Comparison of experimental and calculated mean activity coefficient for NiCl2 solution at room temperature.
The line is calculated ones using the method of this work; the dash line represents the calculated results using the method from literature [10]; the circle are literature values [63]. The dot line of inset is the mean stoichiometric activity coefficient, namely, without considering effect of complexes in system, with the parameters derived in present model.
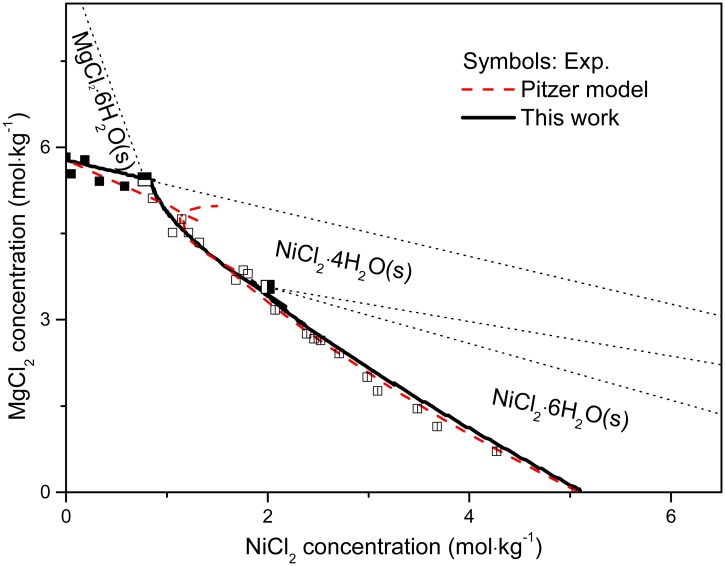
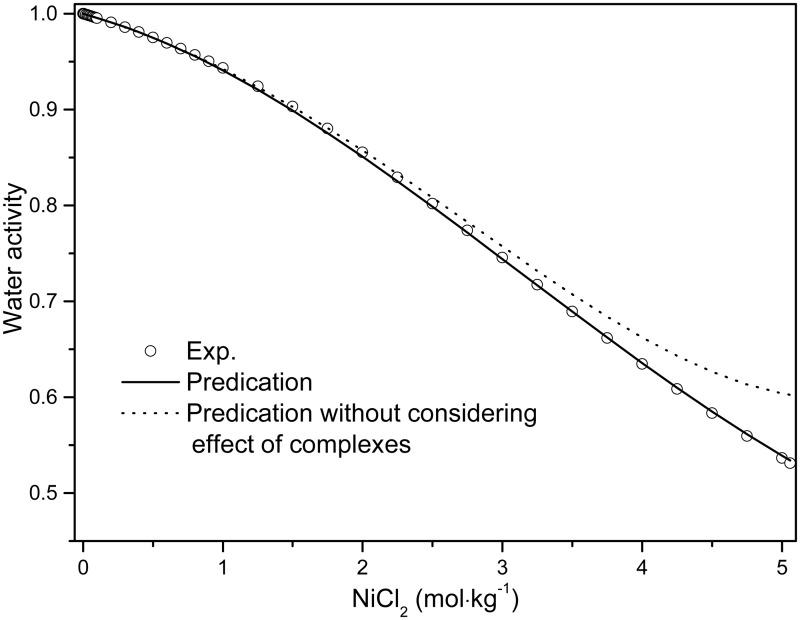
The solubility products from this work are mostly in agreement with the literature values [46–48]. The solubility isotherms calculated using the parameters from Tables 3 and 4 are displayed in Fig 10, and are consistent with the experimental values [64]. If ion association is neglected for the NiCl2-MgCl2-H2O ternary system, the results are unsatisfactory as shown in the dashed line of Fig 10 using the Pitzer completely dissociated model (see [47,67] for details of calculation procedure), although the solubility products of the solid phases are comparable in both models as tabulated in Table 3. Furthermore, the predicted water activity in the NiCl2-H2O system in this work is in excellent agreement with the literature value [63] (Fig 11). In the absence of Ni(II)-chloride complexing, the calculated water activity for pure NiCl2 solutions deviated from the experimental values at high salt concentration (dotted line in Fig 11). The deviation occurs at higher concentration for NiCl2 solutions than that for ZnCl2 solutions (~2.5 mol∙kg-1 vs ~0.05 mol∙kg-1, respectively [65]); this is consistent with the smaller extent of chloro complex formation in Ni(II) chloride solution relative to Zn(II) chloride solutions [68–70]. We also attempted to fit the experimental mean activity coefficient of NiCl2 solutions without considering the NiCl+ complex (dotted line in inset of Fig 9), with no significant decrease in fit quality.
Fig 10. Calculated solubility isotherms (solid line by MSE model in this work and dashed line by Pitzer model) compared with experimental values (symbols: ■, MgCl2∙6H2O; ◪, MgCl2∙6H2O + NiCl2∙4H2O; □, NiCl2∙4H2O; ◨, NiCl2∙4H2O + NiCl2∙6H2O; ◫, NiCl2∙6H2O, data from literature [64]) at room temperature.
Fig 11. Comparison experimental and predicted water activity for NiCl2 solution at room temperature.
The line is predicted one in this work and the dot line represents the prediction one without considering effect of complexes in system, corresponding to the dot line in Fig 9; the circles are literature values [63].
The results of our speciation calculations confirm that the fully hydrated Ni(II) species is dominant in NiCl2-H2O solutions, with only a small amount of chloride anions replacing water within the first octahedral shell even in saturated NiCl2 solutions under ambient conditions. This indicates that the capacity of Ni(II) to bind chloride is much weaker that Zn(II) [16,70], Cu(II) [13–15] and Co(II) [4]. The average numbers of inner-sphere chloride and oxygen (water molecule) ligands calculated based on our thermodynamic speciation model agree with the experimental results from EXAFS and XRD experiments [21,25] (Fig 8a). Note that the low proportion of NiCl+ (~30%, i.e. 0.3 Cl on average around Ni atoms) present in solution was detected by UV-Vis spectroscopy (red-shift) and XANES (subtle decrease of the intensity of the white line), but can easily be overlooked in the EXAFS data. Therefore, accurate results require the integration of results from a range of techniques and careful error analysis. We note that the apparent discrepancies in the literature—with some studies claiming no inner-sphere complexing in concentrated NiCl2 solutions—are related to poor consideration of errors. In addition, the molecular dynamics simulations of Xia et al. [26], used to dismiss the formation of ion pairs in concentrated NiCl2 solutions, are inconclusive because the simulation times (19 ps) were short relative to the ligand exchange rates (k ex), e.g. 3 × 10⁴ to 102 s-1 for M-Cl exchange (M = Au(III), Zn(II), Cd(II) [71–72]; 3.2 × 10⁴ s-1 for Ni-H2O exchange at room temperature ([73]). Aziz et al. [17] observed a geometrical distortion of the Ni(II) coordination sphere with increasing NiCl2 concentration (0.05 to 1.5 mol∙L-1) on the basis of L2,3-edge XANES spectra. They interpreted this distortion to reflect solvent-shared ion pairs rather than inner-sphere complexes, on the basis of a comparison with an unspecified NiCl2∙nH2O(s) solid in vacuum. However, in view of the uncertainty on the hydration state of the standard, and the low concentrations of the inner-sphere complex even in concentrated NiCl2 solutions, Aziz et al. [17]’s L2,3-edge XANES data are consistent with the speciation proposed in this study. Indeed, more recent L-edge XANES spectroscopy studies have emphasized the sensitivity of this method to small amounts of ion pairing (e.g., [74]).
Conclusions
The Ni(II)-chloride interaction in aqueous solutions of NiCl2-H2O (Cl:Ni = 2) and NiCl2-MgCl2-H2O systems (Cl:Ni from 2 to 230) was systematically investigated using XAS and UV-Vis spectroscopy at room temperature. All the evidence indicates that there is no large structural change (e.g., from octahedral to tetrahedral configuration) in these systems up to the solubility limit. The analysis confirms that the hexa-aqua Ni(II) complex is the major complex in all studied solutions. However, the subtle changes of XAS and UV-Vis spectra as a function of salinity indicate that a small amount of Ni(II)-chloride complexation occurs, with up to 0.44(23) Cl in the first coordinated shell of Ni(II) at 5.05 mol∙kg-1 at a Ni-Cl distance of 2.35(2) Å. At high Cl:Ni ratio, small amounts of the [NiCl2]0 complex are also present. These results are consistent with existing literature.
We developed a self-consistent thermodynamic model, based on the comprehensive MSE framework, for predicting the speciation, mean activity coefficients, water activities, and mineral solubilities in Ni-Cl-Mg-H2O solutions up to the solubility limits. The stability of the Ni(II)-chloride complexes was retrieved mainly from a quantitative analysis of the UV-Vis spectroscopic data. The obtained speciation model is consistent with existing XAS and XRD data, and can easily be extended to include further components.
Supporting Information
(TXT)
(TXT)
(TXT)
(TXT)
(TXT)
(TXT)
(TXT)
(TXT)
(XLS)
(XLS)
Acknowledgments
We gratefully acknowledge Dr. F.F. Xia for the XAS measurements.
Data Availability
All relevant data are within the paper and its Supporting Information files.
Funding Statement
This research was financially supported by National Basic Research Program of China (No. 2014CB643401), the National Natural Science Foundation of China (Nos: 20773036, 51134007 and 21463010), and the China Scholarship Council (No. 201306370118). The funders had no role in study design, data collection and analysis, decision to publish, or preparation of the manuscript.
References
- 1. Agrawal A, Kumari S, Sahu KK. Iron and copper recovery/removal from industrial wastes: A review. Ind. Eng. Chem. Res. 2009; 48: 6145–6161. [Google Scholar]
- 2. Zhu Z, Zhang W, Pranolo Y, Cheng CY. Separation and recovery of copper, nickel, cobalt and zinc in chloride solutions by synergistic solvent extraction. Hydrometallurgy. 2012; 127–128: 1–7. [Google Scholar]
- 3. Pospiech B, Walkowiak W. Separation of copper(II), cobalt(II) and nickel(II) from chloride solutions by polymer inclusion membranes. Sep. Purif. Technol. 2007; 57: 461–465. [Google Scholar]
- 4. Liu W, Borg SJ, Testemale D, Etschmann B, Hazemann JL, Brugger J. Speciation and thermodynamic properties for cobalt chloride complexes in hydrothermal fluids at 35–440°C and 600 bar: An in-situ XAS study. Geochim. Cosmochim. Acta. 2011; 75: 1227–1248. [Google Scholar]
- 5. Tian Y, Etschmann B, Liu W, Borg S, Mei Y, Testemale D, et al. Speciation of nickel(II) chloride complexes in hydrothermal fluids: In situ XAS study. Chem. Geol. 2012; 334: 345–363. [Google Scholar]
- 6. Angell CA, Gruen DM. Octahedral-tetrahedral coordination equilibria of nickel(II) and copper(II) in concentrated aqueous electrolyte solutions. J. Am. Chem. Soc. 1966; 88: 5192–5198. [Google Scholar]
- 7. Bjerrum J. Estimation of small stability constants in aqueous solution. The nickel(II)-chloride system. Acta Chem. Scand. A. 1988; 42: 714–716. [Google Scholar]
- 8. Florence TM. Polarography of nickel in concentrated chloride media. Aust. J. Chem. 1966; 19: 1343–1355. [Google Scholar]
- 9. Licheri G, Paschina G, Piccaluga G, Pinna G. EXAFS study of Ni-Cl bonding in Ni(II) aqueous solutions at increasing Cl-/Ni2+ ratios. J. Chem. Phys. 1983; 79: 2168–2171. [Google Scholar]
- 10. Liu W, Migdisov A, Williams-Jones A. The stability of aqueous nickel(II) chloride complexes in hydrothermal solutions: Results of UV-Visible spectroscopic experiments. Geochim. Cosmochim. Acta. 2012; 94: 276–290. [Google Scholar]
- 11. Magini M, Paschina G, Piccaluga G. Ni-Cl bonding in concentrated Ni(II) aqueous solutions at high Cl-/Ni2+ ratios. An X-ray diffraction investigation. J. Chem. Phys. 1982; 76: 1116–1121. [Google Scholar]
- 12. Paatero J, Hummelstedt L. A spectrophotometric study of nickel(II) chloride complexes in aqueous solutions. Acta Academ. Aboens. 1971; 31: 1–19. [Google Scholar]
- 13. Brugger J, Mcphail DC, Black J, Spiccia L. Complexation of metal ions in brines: application of electronic spectroscopy in the study of the Cu(II)-LiCl-H2O system between 25 and 90°C. Geochim. Cosmochim. Acta. 2001; 65: 2691–2708. [Google Scholar]
- 14. Zhang N, Zhou QB, Yin X, Zeng DW. Trace amounts of aqueous copper(II) chloride complexes in hypersaline solutions: Spectrophotometric and thermodynamic studies. J. Solution Chem. 2014; 43: 326–339. [Google Scholar]
- 15. Zhang N, Zeng DW, Hefter G, Chen QY. Chemical speciation in concentrated aqueous solutions of CuCl2 using thin-film UV-visible spectroscopy combined with DFT calculations. J. Mol. Liq. 2014; 198: 200–203. [Google Scholar]
- 16. Liu W, Etschmann B, Foran G, Shelley M, Brugger J. Deriving formation constants for aqueous metal complexes from XANES spectra: Zn2+ and Fe2+ chloride complexes in hypersaline solutions. Amer. Miner. 2007; 92: 761–770. [Google Scholar]
- 17. Aziz EF, Eisebitt S, Groot F, Chiou JW, Dong C, Guo J, et al. Direct contact versus solvent-shared ion pairs in NiCl2 electrolytes monitored by multiplet effects at Ni(II) L edge X-ray absorption. J. Phys. Chem. B. 2007; 111: 4440–4445. [DOI] [PubMed] [Google Scholar]
- 18. Fontana MP, Maisano G, Migliardo P, Wanderlingh F. Raman spectroscopy and local order in aqueous solutions of strong II-I electrolytes. J. Chem. Phys. 1978; 69: 676–683. [Google Scholar]
- 19. Lagarde P, Fontaine A, Raoux D, Sadoc A, Migliardo P. EXAFS studies of strong electrolytic solutions. J. Chem. Phys. 1980; 72: 3061–3069. [Google Scholar]
- 20. Licheri G, Paschina G, Piccaluga G, Pinna G, Vlaic G. EXAFS study of Ni2+ coordination in concentrated aqueous solutions. Chem. Phys. Lett. 1981; 83: 384–387. [Google Scholar]
- 21. Magini M. Hydration and complex formation study on concentrated MCl2 solutions [M = Co(II), Ni(II), Cu(II)] by X-ray diffraction technique. J. Chem. Phys. 1981; 74: 2523–2529. [Google Scholar]
- 22. Neilson GW, Enderby JE. The hydration of Ni2+ in aqueous solutions. J. Phys. C: Solid State Phys. 1978; 11: L625–628. [Google Scholar]
- 23. Sandstrom DR. Ni2+ coordination in aqueous NiCl2 solutions: Study of the extended X-ray absorption fine structure. J. Chem. Phys. 1979; 76: 2381–2386. [Google Scholar]
- 24. Soper AK, Neilson GW, Enderby JE, Howe RA. A neutron diffraction study of hydration effects in aqueous solutions. J. Phys. C: Solid State Phys. 1977; 10: 1793–1801. [Google Scholar]
- 25. Waizumi K, Kouda T, Tanio A, Fukushima N, Ohtaki H. Structural studies on saturated aqueous solutions of manganese(II), cobalt(II), and nickel(II) chlorides by X-ray diffraction. J. Solution Chem. 1999; 28: 83–100. [Google Scholar]
- 26. Xia F, Zeng DW, Yi HB, Fang C. Direct contact versus solvent-shared ion pairs in saturated NiCl2 aqueous solution: A DFT, CPMD, and EXAFS investigation. J. Phys. Chem. A. 2013; 117: 8468–8476. doi: 10.1021/jp405168r [DOI] [PubMed] [Google Scholar]
- 27. Magini M, de Moraes M, Licheri G, Piccaluga G. Composition of the first coordination sphere of Ni2+ in concentrated aqueous NiBr2 solutions by X-ray diffraction. J. Chem. Phys. 1985; 83: 5797–5801. [Google Scholar]
- 28. Wakita H, Ichihashi M, Mibuchi T, Masuda I. The structure of nickel(II) bromide in highly concentrated aqueous solution by X-ray diffraction analysis. Bull. Chem. Soc. Jpn. 1982; 55: 817–821. [Google Scholar]
- 29. Ravel B, Newville M. ATHENA, ARTEMIS, HEPHAESTUS: data analysis for X-ray absorption spectroscopy using IFEFFIT. J. Synchrotron Radiat. 2005; 12: 537–541. [DOI] [PubMed] [Google Scholar]
- 30. Zabinsky SI, Rehr JJ, Ankudinov A, Albers RC, Eller MJ. Multiple-scattering calculations of X-ray-absorption spectra. Phys. Rev. B. 1995; 58: 2995–3009. [DOI] [PubMed] [Google Scholar]
- 31. Hoffmann MM, Darab JG, Palmer BJ, Fulton JL. A transition in the Ni2+ complex structure from six- to four-coordinate upon formation of ion pair species in supercritical water: An X-ray absorption fine structure, near-infrared, and molecular dynamics study. J. Phys. Chem. A. 1999; 103: 8471–8482. [Google Scholar]
- 32. Rousseau B, Maes ST, Lenstra ATH. Systematic intensity errors and model imperfection as the consequence of spectra truncation. Acta Crystallogr. A. 2000; 56: 300–307. [DOI] [PubMed] [Google Scholar]
- 33. Kleinberg R. Crystal structure of NiCl2∙6H2O at room temperature and 4.2 K by neutron diffraction. J. Chem. Phys. 1969; 50: 4690–4696. [Google Scholar]
- 34. Wallen SL, Palmer BJ, Fulton JL. The ion pairing and hydration structure of Ni2+ in supercritical water at 425°C determined by X-ray absorption fine structure and molecular dynamics studies. J. Chem. Phys. 1998; 108: 4039–4046. [Google Scholar]
- 35. Farges F, Brown JGE, Petit PE, Munoz M. Transition elements in water-bearing silicate glasses/melts. part I. a high-resolution and anharmonic analysis of Ni coordination environments in crystals, glasses, and melts. Geochim. Cosmochim. Acta. 2001; 65: 1665–1678. [Google Scholar]
- 36. Fulton JL, Heald SM, Badyal YS, Somonson JM. Understanding the effects of concentration on the solvation structure of Ca2+ in aqueous solution. I: The perspective on local structure from EXAFS and XANES. J. Phys. Chem. A. 2003; 107: 4688–4696. [Google Scholar]
- 37. Jong PHK, Neilson GW, Bellissent-Funel MC. Hydration of Ni2+ and Cl-in a concentrated nickel chloride solution at 100°C and 300°C. J. Chem. Phys. 1996; 105: 5155–5159. [Google Scholar]
- 38. Kelly SD, Hesterberg D, Ravel B. Analysis of soils and minerals using X-ray absorption spectroscopy In: Ulery AL, Drees LR (Eds.) Methods of Soil Analysis. Part 5. Mineralogical Methods. SSSA Book Series No. 5, pp. 387–483. 2008. [Google Scholar]
- 39. Brugger J. BeerOz, a set of Matlab routines for the quantitative interpretation of spectrophotometric measurements of metal speciation in solution. Comput. Geosci. 2007; 33: 248–261. [Google Scholar]
- 40. Liu W, Etschmann B, Brugger J, Spiccia L, Foran G, Mclnnes B. UV–Vis spectrophotometric and XAFS studies of ferric chloride complexes in hyper-saline LiCl solutions at 25–90°C. Chem. Geol. 2006; 231: 326–349. [Google Scholar]
- 41. Clifford AA, Crawford B. Vibrational intensities. XIV. The relation of optical constants to molecular parameters. J. Phys. Chem. 1966; 70: 1536–1543. [Google Scholar]
- 42. Newsome JR, Neilson GW, Enderby JE, Sandstrom M. Ni2+ hydration in perchlorate and chloride solutions. Chem. Phys. Lett. 1981; 82: 399–401. [Google Scholar]
- 43. Iuchi S, Sakaki S. Spin-orbit coupling in a model Hamiltonian for d-d excited states of Ni2+ ion aqueous solution. Chem. Phys. Lett. 2010; 485: 114–118. [Google Scholar]
- 44. Malinowski ER Determination of the number of factors and the experimental error in a data matrix. Anal. Chem. 1977; 49: 612–616. [Google Scholar]
- 45. Sverjensky DA, Shock EL, Helgeson HC. Prediction of the thermodynamic properties of aqueous metal complexes to 1000°C and 5 kb. Geochim. Cosmochim. Acta. 1997; 61: 1359–1412. [DOI] [PubMed] [Google Scholar]
- 46. Li H, Zeng D, Yao Y, Gao C, Yin X, Han H. Solubility phase diagram of the ternary system MgCl2-MgSO4-H2O at 323.15 and 348.15 K. J. Chem. Eng. Data 2014; 59: 2177–2185. [Google Scholar]
- 47. Harvie CE, Moller N, Weare JH. The prediction of mineral solubilities in natural waters: The Na-K-Mg-Ca-H-Cl-SO4-OH-HCO3-CO3-CO2-H2O system to high ionic strengths at 25 degree. Geochim. Cosmochim. Acta. 1984; 48: 723–751. [Google Scholar]
- 48. Liu H, Papangelakis V. Solubility of Pb(II) and Ni(II) in mixed sulfate-chloride solutions with the mixed solvent electrolyte model. Ind. Eng. Chem. Res. 2006; 45: 39–47. [Google Scholar]
- 49. Libus Z, Tialowska H. Stability and nature of complexes of the type MCl+ in aqueous solution (M = Mn, Co, Ni, and Zn). J. Solution Chem. 1975; 4: 1011–1022. [Google Scholar]
- 50. Helgeson H, Kirkham DH, Flowers GC. Theoretical predigtion of the thermodynamic behavior of aqueous electrolytes at high pressures and themperatures: IV. Calculation of acticity coefficients, osmotic coefficients, and apparent molal and standard and relative partial molal properties to 600°C and 5 kbar. Am. J. Sci. 1981; 281: 1249–1516. [Google Scholar]
- 51. Pitzer KS. Thermodynamics of electrolytes. I. Theoretical basis and general equations. J. Phys. Chem. 1973; 77: 268–277. [Google Scholar]
- 52. Millero FJ, Hawke DJ. Ionic interactions of divalent metals in natural waters. Mar. Chem. 1992; 40: 19–48. [Google Scholar]
- 53. Millero FJ, Yao W, Aicher J. The speciation of Fe(II) and Fe(III) in natural waters. Mar. Chem. 1995; 50: 21–39. [Google Scholar]
- 54. Santana-Casiano JM, Gonzalez-Dzvila M, Millero FJ. The examination of the activity coefficients of Cu(II) complexes with OH-and Cl-in NaClO4 using Pitzer equations: Application to other divalent cations. J. Solution Chem. 2008; 37: 749–762. [Google Scholar]
- 55. Wang P, Anderko A, Young RD. A speciation-based model for mixed-solvent electrolyte systems. Fluid Phase Equilib. 2002; 203: 141–176. [Google Scholar]
- 56. Wang P, Springer RD, Anderko A, Young RD. Modeling phase equilibria and speciation in mixed-solvent electrolyte systems. Fluid Phase Equilib. 2004; 222–223: 11–17. [Google Scholar]
- 57. Wang P, Anderko A, Springer RD, Young RD. Modeling phase equilibria and speciation in mixed-solvent electrolyte systems: II. Liquid–liquid equilibria and properties of associating electrolyte solutions. J. Mol. Liq. 2006; 125: 37–44. [Google Scholar]
- 58. Tanger JC, Helgeson HC. Calculation of the thermodynamic and transport properties of aqueous species at high pressures and temperatures: Revised equations of state for the standard partial molal properties of ions and electrolytes. Am. J. Sci. 1988; 288: 19–98. [Google Scholar]
- 59. Helgeson H, Kirkham DH. Theoretical prediction of the thermodynamic behavior of aqueous electrolytes at high pressures and temperatures: II. Debye-Huckel parameters for activity coefficients and relative partial molal properties. Am. J. Sci. 1974; 274: 1199–1261. [Google Scholar]
- 60. Pitzer KS. Electrolytes. From dilute solutions to fused salts. J. Am. Chem. Soc. 1980; 102: 2902–2906. [Google Scholar]
- 61. Abrams DS, Prausnitz JM. Statistical thermodynamics of liquid mixtures: A new expression for the excess Gibbs energy of partly or completely miscible systems. AIChE J. 1975; 21: 116–128. [Google Scholar]
- 62. Azimi G, Papangelakis VG, Dutrizac JE. Development of an MSE-based chemical model for the solubility of calcium sulphate in mixed chloride-sulphate solutions. Fluid Phase Equilib. 2008; 266: 172–186. [Google Scholar]
- 63. Goldberg RN, Nuttall RL, Staples BR. Evaluated activity and osmotic coefficients for aqueous solutions: iron chloride and the bi-univalent compounds of nickel and cobalt. J. Phys. Chem. Ref. Data. 1979; 8: 923–1004. [Google Scholar]
- 64. Oikova T. NiCl2-MgCl2-H2O and CoCl2-MgCl2-H2O systems at 25°C. Zh. Neorg. Khim. 1979; 24: 219–222. [Google Scholar]
- 65. Aparicio JL, Elizalde MP. Activity coefficient calculations applied to ZnCl2 in LiCl media. Distinction between the real activity coefficient and the effect of complexation. J. Solution Chem. 1996; 25: 1055–1069. [Google Scholar]
- 66. Stokes RH, Levien BJ. The osmotic and activity coefficients of zinc nitrate, zinc perchlorate and magnesium perchlorate. Transference numbers in zinc perchlorate solutions. J. Am. Chem. Soc. 1946; 68: 333–337. [Google Scholar]
- 67. Wang W, Zeng D, Yin X, Chen Q. Prediction and measurement of gypsum solubility in the systems CaSO4 + HMSO4 + H2SO4 + H2O (HM = Cu, Zn, Ni, Mn) at 298.15 K. Ind. Eng. Chem. Res. 2012; 51: 5124–5134. [Google Scholar]
- 68. Harris DJ, Brodholt JP, Sherman DM. Zinc complexation in hydrothermal chloride brines: Results from ab initio molecular dynamics calculations. J. Phys. Chem. A. 2003; 107: 1050–1054. [Google Scholar]
- 69. Liu W, Borg S, Etschmann B, Mei Y, Brugger J. An XAS study of speciation and thermodynamic properties of aqueous zinc bromide complexes at 25–150°C. Chem. Geol. 2012; 298–299: 57–69. [Google Scholar]
- 70. Mei Y, Sherman D, Liu W, Etschmann B, Testemale D, Brugger J. Zinc complexation in chloride-rich hydrothermal fluids (25 to 600°C): a thermodynamic model derived from ab initio molecular dynamics. Geochimica et Cosmochimica Acta. 2015; 150: 265–284. [Google Scholar]
- 71. Mei Y, Sherman D, Liu W, Brugger J. Ab initio molecular dynamics simulation and free energy exploration of copper(I) complexation by chloride and bisulfide in hydrothermal fluids. Geochim. Cosmochim. Acta. 2013; 102: 45–64. [Google Scholar]
- 72. Sharps JA, Brown GE, Stebbins JF. Kinetics and mechanism of ligand exchange of Au(III), Zn(II), and Cd(II) chlorides in aqueous solution: An NMR study from 28–98°C. Geochim. Cosmochim. Acta. 1993; 57: 721–731. [Google Scholar]
- 73. Helm L, Merbach AE. Inorganic and bioinorganic solvent exchange mechanisms. Chem. Rev. 2005; 105: 1923–1960. [DOI] [PubMed] [Google Scholar]
- 74. Atak K, Bokarev SI, Gotz M, Golnak R, Lange KM, Engel N, et al. Nature of the chemical bond of aqueous Fe2+ probed by Soft X-ray spectroscopies and ab initio calculations. J. Phys. Chem. B. 2013; 117: 12613–12618. doi: 10.1021/jp408212u [DOI] [PubMed] [Google Scholar]
- 75. Brugger J, Etschmann B, Liu W, Testemale D, Hazemann J, Emerich H, et al. An XAS study of the structure and thermodynamics of Cu(I) chloride complexes in brines up to high temperature (400°C, 600 bar). Geochim. Cosmochim. Acta. 2007; 71: 4920–4941. [Google Scholar]
- 76. He PH, Yin X, Zhang N, Zhu J. Study on thermal decomposition gravimetric method for the determination of magnesium chloride in pure magnesium chloride solution. Metall. Anal. 2010; 30: 58–61. [Google Scholar]
Associated Data
This section collects any data citations, data availability statements, or supplementary materials included in this article.
Supplementary Materials
(TXT)
(TXT)
(TXT)
(TXT)
(TXT)
(TXT)
(TXT)
(TXT)
(XLS)
(XLS)
Data Availability Statement
All relevant data are within the paper and its Supporting Information files.


