Abstract
Purpose:
In this research, a high-energy in-line phase contrast tomosynthesis prototype was developed and characterized through quantitative investigations and phantom studies.
Methods:
The prototype system consists of an x-ray source, a motorized rotation stage, and a CMOS detector with a pixel pitch of 0.05 mm. The x-ray source was operated at 120 kVp for this study, and the objects were mounted on the rotation stage 76.2 cm (R1) from the source and 114.3 cm (R2) from the detector. The large air gap between the object and detector guarantees sufficient phase-shift effects. The quantitative evaluation of this prototype included modulation transfer function and noise power spectrum measurements conducted under both projection mode and tomosynthesis mode. Phantom studies were performed including three custom designed phantoms with complex structures: a five-layer bubble wrap phantom, a fishbone phantom, and a chicken breast phantom with embedded fibrils and mass structures extracted from an ACR phantom. In-plane images of the phantoms were acquired to investigate their image qualities through observation, intensity profile plots, edge enhancement evaluations, and/or contrast-to-noise ratio calculations. In addition, the robust phase-attenuation duality (PAD)-based phase retrieval method was applied to tomosynthesis for the first time in this research. It was utilized as a preprocessing method to fully exhibit phase contrast on the angular projection before reconstruction.
Results:
The resolution and noise characteristics of this high-energy in-line phase contrast tomosynthesis prototype were successfully investigated and demonstrated. The phantom studies demonstrated that this imaging prototype can successfully remove the structure overlapping in phantom projections, obtain delineate interfaces, and achieve better contrast-to-noise ratio after applying phase retrieval to the angular projections.
Conclusions:
This research successfully demonstrated a high-energy in-line phase contrast tomosynthesis prototype. In addition, the PAD-based method of phase retrieval was combined with tomosynthesis imaging for the first time, which demonstrated its capability in significantly improving the contrast-to-noise ratios in the images.
Keywords: high-energy in-line phase contrast tomosynthesis, PAD phase retrieval, bubble wrap phantom, fishbone phantom, chicken breast phantom
1. INTRODUCTION
Digital tomosynthesis (DTS) is an emerging x-ray technology with the potential to provide retrospective reconstruction of an arbitrary number of plane slices from a single image acquisition sequence. As a volumetric imaging modality, DTS removes the structure noise induced by overlapping tissue and provides lower radiation doses as compared to CT.1–5 A recently developed x-ray imaging method known as in-line phase contrast imaging has the potential to increase imaging quality through edge enhancement (EE) and contrast enhancement.2,5–12 In our previous researches, a quasi 3D x-ray imaging prototype providing in-line phase contrast tomosynthesis has recently been developed by combining the methods of in-line phase contrast and DTS imaging.7,13,14
In-line phase contrast projection imaging can generally be performed with direct phase-sensitive projections, which can demonstrate the edge enhancement effect at the interfaces and boundaries of different materials or tissues.2,6,15,16 In addition, the procedure of phase retrieval can be utilized to retrieve the phase map of the sample for fully exhibiting the phase contrast effect, as well as providing a quantitative characterization of the sample’s projected electron densities. Although the interfaces between boundaries of different tissue areas are significantly enhanced in a phase contrast image, the bulk of the phase contrast in a given tissue area may be lost if the phase shifts vary slowly. This occurs because phase contrast is proportional to the Laplacian and gradient differentials of the phase shifts. As shown in our previous works,13–16 phase retrieval can exhibit the phase-shift differences among different materials by enhancing the overall image contrast rather than providing edge enhancement.
In the filtered backprojection (FBP)-based DTS image reconstruction, the in-plane images intrinsically show edge enhancement in the tube-sweep direction even without the phase contrast effects.5 Hence, combining phase retrieval with the FBP image reconstruction is expected to improve in-line phase contrast tomosynthesis, as both the edge enhancement and overall contrast enhancement will be provided.
In the literature, in-line phase contrast tomosynthesis imaging prototypes have been investigated with the x-ray tube voltages of 15–40 kVp typically used in conventional breast mammography.2,7,13,17,18 Adequate x-ray transverse coherence was provided in these studies by employing microfocus x-ray tubes combined with large source-to-object distances (SODs). Although conventional attenuation contrast between different tissues decreases rapidly with increasing x-ray energies, phase contrast decreases much more slowly as the x-ray energy increases.19,20 The use of high-voltage can also greatly reduce the exposure time required in image acquisition. Thus, in this paper, an in-line phase contrast tomosynthesis prototype operating with a high tube voltage of 120 kVp will be investigated.
To conduct a characterization of this high-energy in-line phase contrast tomosynthesis prototype, the modulation transfer function (MTF) and noise power spectrum (NPS) will first be determined without applying phase retrieval by employing the methods presented in the previous studies.17,21–26 In addition, the edge enhancement-to-noise ratio (EE/N) will be calculated by using an acrylic edge to provide a quantitative measurement to demonstrate that a high-energy in-line phase contrast tomosynthesis system can provide imaging abilities similar to and/or comparable with a conventional digital tomosynthesis. In phantom studies, the images of the bubble wrap phantom, the fishbone phantom, and the chicken breast phantom provide qualitative and observable comparisons of the images but do not contain a gold-standard edge from which to calculate the EE/N. Therefore, by applying phase retrieval to the in-line phase contrast projections as a preprocessing step before reconstruction, the image quality improvement will be depicted as the increase in contrast-to-noise ratio (CNR). The results will be compared with conventional DTS images taken with 40 kVp, a 50 μm spot size upon manual selection, and the same milliampere-second.
2. METHODS AND MATERIALS
2.A. Prototype configuration
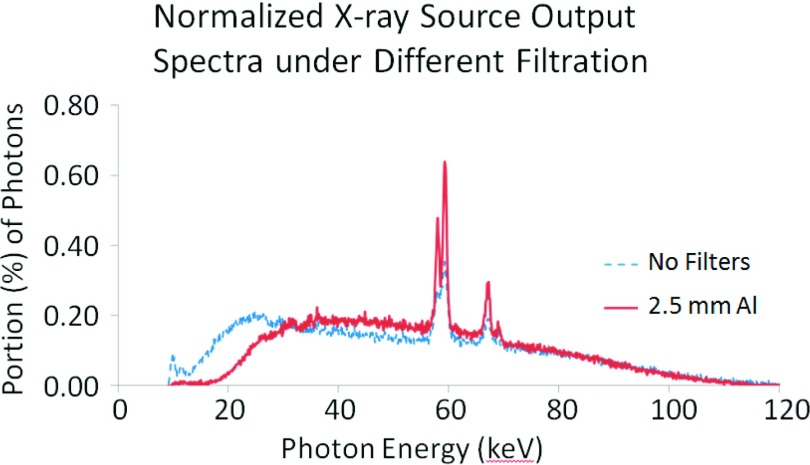
This research employed a microfocus x-ray source (Model L8121-03, Hamamatsu Photonics). The x-ray tube generates x-ray photons ranging from 40 to 150 kV with an adjustable tube current. The nominal focal spot sizes of 7, 20, and 50 μm can be selected and/or determined by the desired output power of 10, 30, or 75 W, respectively. In this research, the in-line phase contrast angular images were acquired with 120 kVp tube voltage, 500 μA tube current, and 50 μm spot size. An aluminum (Al) filter with 2.5 mm thickness was utilized to harden the beam and remove x-ray photons with energies less than 30 keV. The percentage of removed photons, 64.4%, was experimentally calculated with the following formula: , where represents the cumulative number of photons under 30 keV in the filtration mode and N0(30) represents the cumulative number of photons under 30 keV in the nonfiltration mode. A comparison of the x-ray output spectra illustrating the percentage of x-ray photons as a function of x-ray energy for different filtration levels is shown in Fig. 1. The image grabber used to acquire the angular projections was a CMOS flat panel detector (C7942SK-25, Hamamatsu Photonics), providing sampling pixel pitch of 50 μm on a 120 × 120 mm active photodiode area, on which a CsI scintillator was mounted to convert incident x-rays to light for detection. The electronic noise of this detector was 1100 electrons, which is indicated in the manufacturer’s datasheets. The rotation device utilized to provide the tomosynthesis mechanism was a motorized rotation stage (Model SGSP-160YAW, OptoSigma).
FIG. 1.
Normalized x-ray source output spectrum obtained under 120 kVp with the different filtration modes of no filter and a 2.5-mm Al filter.
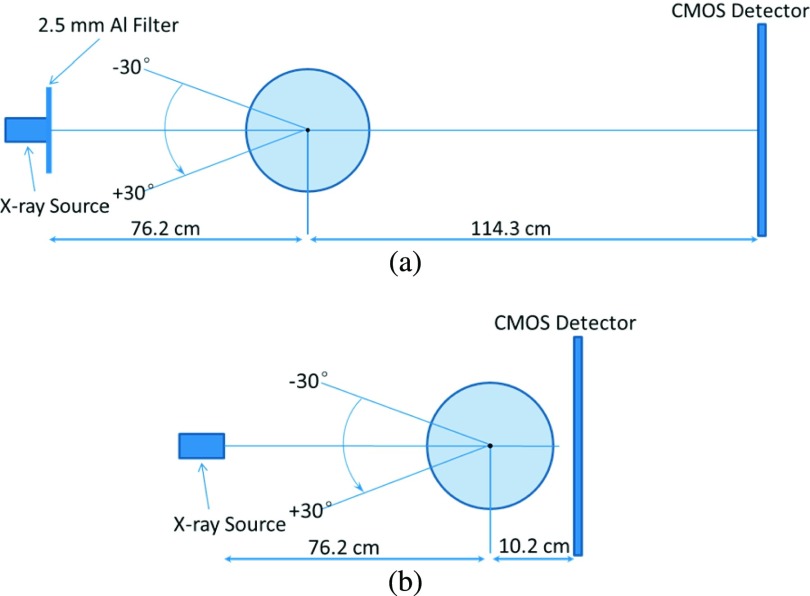
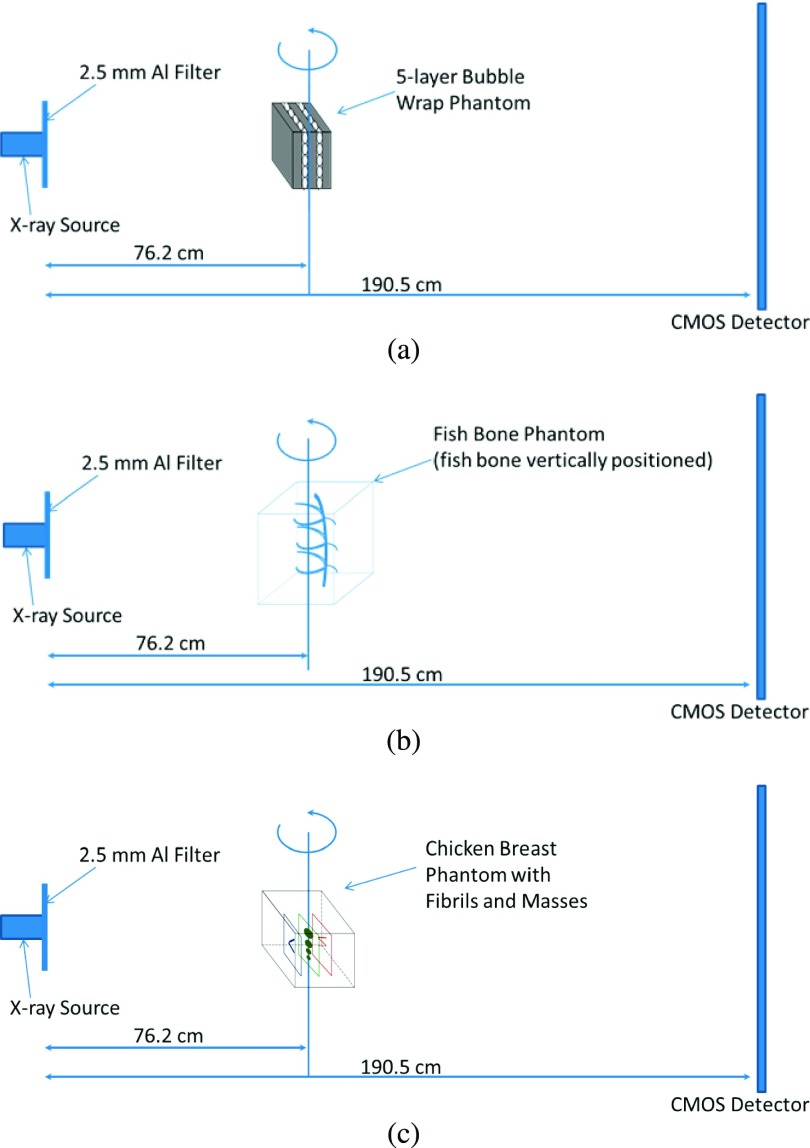
Shown in Fig. 2(a), the test objects were placed at the center of the rotation stage. The objects were rotated with respect to the rotation center from −30° to +30° with 2° increments. This experimental setting is equivalent to the traditional isocentric motion mode, in which both the x-ray source and detector rotate around a fixed pivot point synchronously.5 The SOD and the source-to-image distance (SID) values of 76.2 and 190.5 cm, respectively, were selected to deliver optimal phase-shift effects according to the principles of in-line phase contrast imaging, as well as to reduce the loss of x-ray photons during propagation through the air gap.14–16 For comparison purposes, the conventional DTS experiments were conducted with experimental settings of 40 kVp, 500 μA, 50 μm spot size, SOD = 76.2 cm, and SID = 86.4 cm, the configuration of which is shown in Fig. 2(b).
FIG. 2.
(a) The configuration of the experimental prototype in-line phase contrast tomosynthesis system used in this research and (b) the configuration of the conventional DTS prototype for comparison experiments.
After angular projections of the test objects were acquired by the system, the series of projections were processed by the modified Feldkamp–Davis–Kress (FDK) backprojection algorithm detailed in the literature,27–30
| (1) |
| (2) |
and
| (3) |
where represents the reconstructed image at the given slice y0, D is the source-to-isocenter distance or SOD in the experiments, H(⋅) represents the 1D ramp filter along a horizontal orientation on the detection plane, P(u, v, β) is the projection value of the projection coordinate (u, v) from a projection view β, and C(x, y0, z) is the compensation weighted factor which is experimentally and optimally determined by the following:27
| (4) |
Based on the different magnification setting of in-line phase contrast mode and conventional DTS prototype, the reconstructed spacing was 0.020 and 0.044 mm for in-line phase contrast tomosynthesis and conventional DTS, respectively.
2.B. MTF measurements
Experimental determination of the modulation transfer function for this high-energy in-line phase contrast tomosynthesis prototype was performed by the presampled MTF method with a slanted sharp edge for tomosynthesis mode and a slit camera for projection mode.21,26
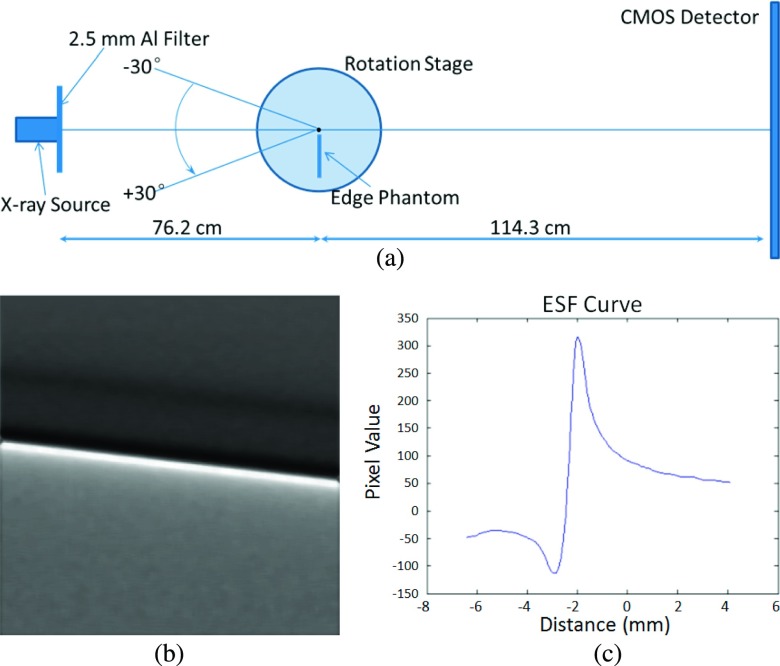
For the in-plane reconstructed MTF calculation, the sharp edge was a steel knife with an edge thickness of 0.2 mm. As shown in Fig. 3(a), the edge phantom was mounted at the center of the rotation stage. As detailed in Sec. 2.A, it was rotated from −30° to +30° with 2° increments to acquire the angular projections. The reconstructed in-plane edge image illustrated in Fig. 3(b) was used to calculate the in-plane MTF. The 1D edge spread function (ESF) was calculated through averaging the horizontal profile intensities along the maximum-value line. The ESF acquired in this research is shown in Fig. 3(c). The angular projections of the edge phantom were acquired under a total exposure of 93 mA s (500 μA × 6 s × 31 projections), tube voltage of 120 kVp, and 50 μm spot size.
FIG. 3.
(a) Schematic of the experimental setup for measuring the in-plane MTF of the in-line phase contrast tomosynthesis system prototype. (b) Reconstructed in-plane image of the sharp edge phantom. (c) Edge spread function curve calculated from the in-plane image.
The in-line phase contrast projection MTF measurement was conducted using the same system configuration without rotation of the object. A 10 μm wide slit camera (iie GmbH, Aachen, Germany) was employed instead of the sharp edge to perform the presampling MTF measurement through the line spread function (LSF) method detailed in Ref. 20. The projection of the slit camera was acquired under a total exposure of 3 mA s (500 μA × 6 s), tube voltage of 120 kVp, and 50 μm spot size.
As the thickness of the slit camera, 1.5 mm, is much larger than the width of the slit, 10 μm, and it is made of lead, it was difficult to be reconstructed in tomosynthesis mode. Therefore, the slit camera was only used in projection mode, and the results were compared with the literature results of slit-based projection MTF. The MTF of the in-line phase contrast tomosynthesis mode was calculated using an acrylic edge, which can be reconstructed, and the results were compared with the previous studies of MTF for the DTS mode. The comparisons will be detailed later.
2.C. NPS measurements
The NPS is a well-established method used to quantify the characteristics of fluctuations in the image signal and encapsulate many of the physical aspects affecting image quality. NPS calculation utilizes the Fourier transform of noise images or autocorrelation of noise signals to determine the variance of noise power as a function of spatial resolution.22
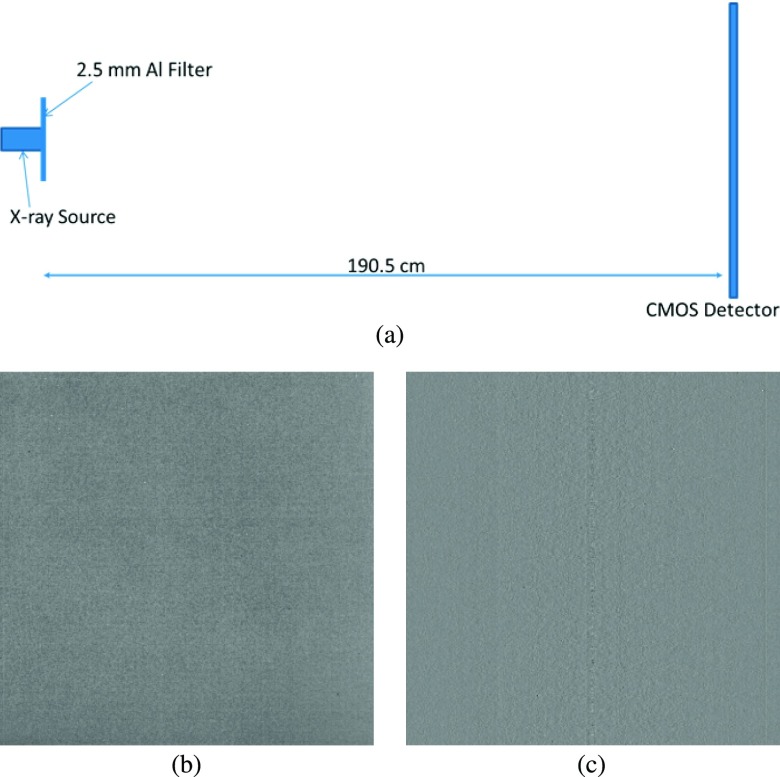
In determining the projection NPS of this prototype system, the uniform noise images were acquired without any objects in the path of the x-ray beam. Due to the stochastic nature of noise in x-ray images, and considering the fact that the number of x-ray photons incident on each pixel of the detection plane can be represented as Poisson distributed variables, the 1024 × 1024 2D noise-only image was separated into 64 smaller regions of subimages, each with a size of 128 × 128. The average noise image was calculated by averaging the subimages. Next, the Fourier transform was applied to the fluctuation image, which was obtained by subtracting the DC term from the noise-only images.6,22,31 The system geometry and the projection noise-only image are shown in Figs. 4(a) and 4(b), respectively.
FIG. 4.
(a) Schematic of the experimental setup for measuring in-line phase contrast projection NPS and in-plane tomosynthesis NPS of the prototype system. (b) Projection noise-only image. (c) In-plane noise-only image.
For the in-plane NPS calculation of the high-energy in-line phase contrast tomosynthesis prototype, shown in Fig. 4(a), the angular images were acquired under the no-object condition with a total exposure of 62 mA s (500 μA × 4 s × 31 projections), a tube voltage of 120 kVp, and a focal spot size of 50 μm. The reconstructed in-plane image was selected as the noise-only image. The in-plane NPS was then calculated through a similar procedure to the projection NPS utilizing the in-plane noise-only image shown in Fig. 4(c).25,32
2.D. Phantom studies
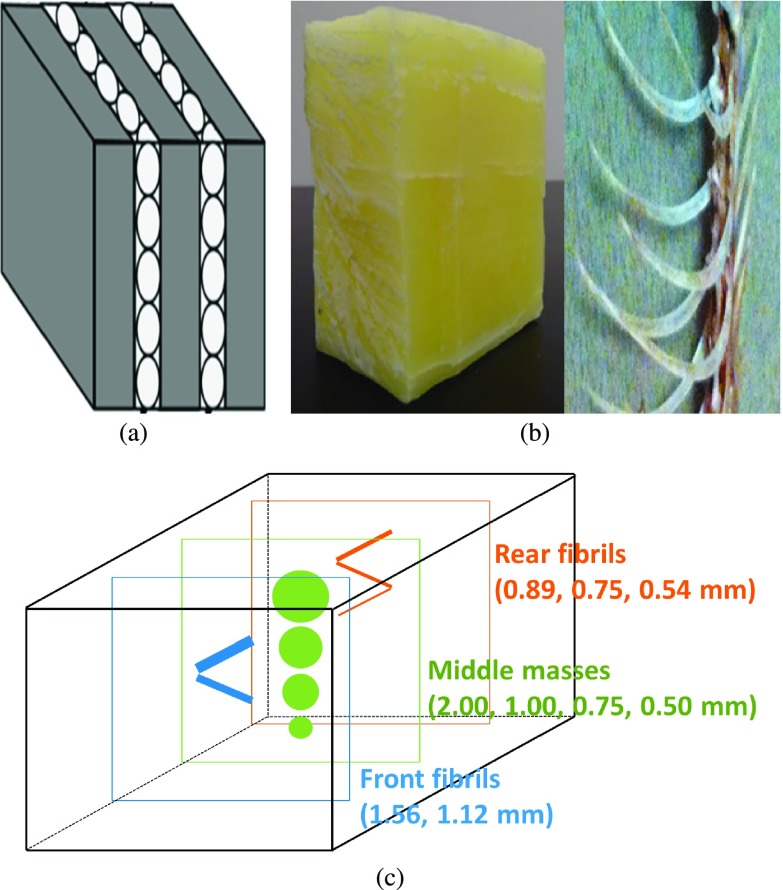
Three laboratory designed phantoms were employed in this research: a five-layer bubble wrap phantom, a fishbone phantom, and a chicken breast phantom. The fishbone simulates the tiny structures inside the soft tissues, and the bubble wrap phantom simulates lung structures/tissues as the mass attenuation coefficients among plastic and lung tissues are similar.33 For the chicken breast phantom, fibrils and mass structures with different dimensions and shapes extracted from an ACR mammographic accreditation phantom were embedded into the chicken layers to simulate tumors inside the breast.
The bubble wrap phantom, shown in Fig. 5(a), was assembled with two pieces of bubble wrap sandwiched into three acrylic boards. The bubble wrap was constructed of low-density polyethylene (C2H4)n film, and acrylic has a molecular formula of (C5H8O2)n. The dimensions of each acrylic board are 114.3 mm high, 114.3 mm wide, and 9 mm thick. The bubble wrap layers were each 2 mm in thickness.
FIG. 5.
(a) Schematic of the specifically designed five-layer bubble wrap phantom. (b) The image of the whole fishbone phantom (left) and the bones inside the beeswax cubic (right). (c) Schematic of the chicken breast phantom; the fibrils and masses were embedded at three different layers with a distance of approximately 10 mm between each layer.
The fishbone phantom, shown in Fig. 5(b), was constructed from a portion of the skeleton of a crevalle jack fish, which was purchased in the Asian food supermarket. The phantom included a portion of the vertebral column with attached neurapophysis-neural spine and ribs, which was sealed into beeswax (C15H31COOC30H61). The fishbone is made up of hydroxyapatite [Ca10(PO4)6(OH)2], calcium carbonate (CaCO3), collagen, and lipid. Although the fishbone contains elements with atomic numbers greater than 10, the effective atomic number of the bone is about 13, and the mass attenuation coefficient of bone is very close to beeswax when exposed by x-rays in the range of tens to hundreds of keV.34,35 The dimensions of the fishbone phantom are 110.0 mm high, 70 mm wide, and 110.0 mm thick along the axis of x-ray propagation.
The chicken breast phantom was made of a portion of chicken breast with a thickness of 60 mm, which was purchased in a supermarket. Three layers of test objects were embedded in the chicken breast with a distance of approximately 10 mm between each layer. The test objects included nylon fibrils with diameters of 1.56, 1.12, 0.89, 0.75, and 0.54 mm and tumorlike masses with thicknesses of 2.00, 1.00, 0.75, and 0.50 mm, which were extracted from an ACR mammographic accreditation phantom. A schematic of the phantom’s internal structure is provided in Fig. 5(c).
The bubble wrap phantom study was conducted with a total exposure of 124.0 mA s (500 μA × 8 s × 31 projections), 120 kVp, and 50 μm spot size, while the angular projections of the fishbone phantom were obtained under a total exposure of 155.0 mA s (500 μA × 10 s × 31 projections), 120 kVp, and 50 μm spot size. In the experiments with the chicken breast phantom, the angular projections were acquired under a total exposure of 258.4 mA s (500 μA × 16.67 s × 31 projections), 120 kVp, and 50 μm spot size. The experimental system configurations utilized in this study to acquire images of the phantoms are detailed in Figs. 6(a) and 6(b), respectively.
FIG. 6.
The experimental systems for measuring (a) the five-layer bubble wrap phantom, (b) the fishbone phantom, and (c) the chicken breast phantom with three layers of embedded fibrils and mass structures.
2.E. Phase retrieval
In phase tomography or tomosynthesis, phase retrieval methods were employed as a preprocessing step to the angular projections. In order to retrieve the phase maps in the angular projections, a recently developed innovative phase retrieval method known as the phase-attenuation duality (PAD) method was employed.36,37 In general, phase retrieval is based on x-ray propagation equation, which reveals how the phase shifts are encoded in the image intensity variations. Common phase retrieval method in the literature requires multiple projections (at least two projections) acquired with varying object-detector distances for retrieving the phase-shift map of a subject.38 This requirement of multiple image acquisitions for phase retrievals is cumbersome in implementation, and the multiple exposures make the radiation dose multiplied. In searching a better phase retrieval method, we noted that for a subject made of elements with Z < 10, such as soft tissues or acrylic, when being imaged with high-energy x-rays of 60 keV or higher, the x-ray-matter interactions are then dominated by the x-ray Compton scattering from atomic electrons, as the x-ray photoelectric absorption and coherent scattering are all diminished. In this condition, both the tissue attenuation and phase shift are all determined by subject electron density distributions. We called this condition as the PAD.36,37 We found that when the phase-attenuation duality holds, the x-ray propagation equation gets simplified and the phase map can be retrieved from just a single phase-sensitive projection. For a given angular view of tomosynthesis acquisitions, this method only requires a single low-dose phase-sensitive projection image to retrieve the phase map of the object for this angular view. With this method, the phase map can be retrieved from just a single phase-sensitive projection,36,37
| (5) |
where represents the phase map of the object, λ is the average wavelength of x-ray, σKN is the Klein–Nishina total cross section of Compton scattering, and re = 2.818 × 10⁻¹⁵ m denotes the classical electron radius. In addition, represents the acquired phase-sensitive intensity of the object at on the detector, and the image contrast is a mixed attenuation contrast and phase contrast prior to phase retrieval. Iin is the entrance x-ray intensity, and R2 and M are the object-to-detector distance and the magnification of the system, respectively. Also in Eq. (5), ∇2 denotes the 2D transverse Laplacian differential operator derived from x-ray propagation equations, and
represents the “inverse” pseudodifferential operator of the “forward” differential operator,
In this experiment, as the tube is a polychromatic source and the filtered beam contains photons of energies from 30 to 120 keV, the average beam energy (60.5 keV) is used in Eq. (5) for phase retrievals in this experiment. Strictly speaking, Eq. (5) is valid only for low-Z element (Z < 10) materials such as soft tissues and acrylic, when imaged with high-energy x-ray. For mid-Z and high-Z element materials, x-ray photoelectric absorption cannot be completely ignored, the PAD assumption is only approximately held, and the retrieved phase values from Eq. (5) may be with some errors. A recent PAD phase retrieval-based CT experiment conducted with 60-keV synchrotron radiation had tested how much errors can be caused for such materials in the phantom. In that experiment, the reconstructed electron densities of aluminum and alumina components based on Eq. (5) are about 36% different from the theoretical values, as these two materials contain aluminum of Z = 13.39 While tomography can provide quantitative information, a tomosynthesis technique, regardless conventional DTS or phase-sensitive tomosynthesis, is intrinsically nonquantitative as tomosynthesis acquires only a limited and incomplete set of angular projections in measurement.40 In spite of this limitation of tomosynthesis, the phase-sensitive tomosynthesis based on Eq. (5) is able to enhance the object features and interfaces and, significantly, suppress image noise, as is demonstrated below in the reconstructed images of the bubble wrap and fishbone phantoms.
When applying Eq. (5) to the phantom images, note that Eq. (5) was derived based on the principle of Fresnel x-ray diffraction of a “thin” object. According to the projection approximation of Fresnel diffraction, an object can be treated as a thin object for the Fresnel diffraction as long as the following inequality for the thickness (T) holds: T < p2/λ, where p denotes the size of the resolution element in the imaging, and λ is the mean wavelength of the x-ray. In this research, the x-ray output energy ranges from 30 to 120 keV for the high-energy in-line phase contrast projections, which means the wavelength ranges from 0.01 to 0.04 nm and the thicknesses of phantoms are 31 and 110 mm, respectively. Thus, the phantom thicknesses are much smaller than p2/λ, which range from 62 500 to 250 000 mm. Therefore, much thicker objects than the phantoms used in this research can be treated as thin objects, and Eq. (5) can be effectively applied for phase retrieval in this study.
2.F. Entrance exposure dose measurements
The phantom studies utilizing the prototype presented in this research were designed to simulate tissues and/or organs imaged in clinical conditions. A comparison of the measurements of entrance radiation dose for all angular image acquisitions for the phantoms with both imaging modalities is shown in Table I. To provide a preliminary comparison, the entrance doses for the objects in DTS were measured with the same SOD and milliampere-second settings as the in-line phase contrast tomosynthesis prototype and without the use of x-ray beam filtration. The entrance exposure values were measured by using a dosimeter (RadCal 9095, RadCal Corporation) with an ionization chamber (10X5-180, RadCal Corporation). The average value from ten measurements was utilized, and the corresponding uncertainty values are provided in the table.
TABLE I.
Measured entrance exposure of phantom studies compared with DTS.
| Phantom | Imaging method | Tube voltage (kVp) | mA s | Entrance dose (mR) | Uncertainty (mR) |
|---|---|---|---|---|---|
| Bubble wrap | In-line phase contrast tomosynthesis | 120 | 124.0 | 4 938.3 | 8.05 |
| Conventional DTS | 40 | 5 322.7 | 9.82 | ||
| Fishbone | In-line phase contrast tomosynthesis | 120 | 155.0 | 6 141.1 | 8.98 |
| Conventional DTS | 40 | 6 683.6 | 7.20 | ||
| Chicken breast | In-line phase contrast tomosynthesis | 120 | 258.4 | 10 229.7 | 7.97 |
| Conventional DTS | 40 | 11 098.5 | 6.83 |
If the same entrance exposure would have been utilized in the experiments, the transmission of the 120 kVp beam would be vastly greater than that of the 40 kVp beam. Higher transmission results in less absorption of the x-rays, which means that the same entrance exposure delivers a lower absorbed dose for the high-energy images than for the low-energy images. In our study, we utilized lower entrance exposures for the 120 kVp beam than the 40 kVp beam in the experiments to provide an even lower absorbed dose for the high-energy images than for the low-energy images. This, therefore, ensures an image quality comparison based on a dose reduction from the low-energy images to the high-energy images, which is one of the primary goals of our research. An accurate estimation of the mean glandular dose for comparison of the two configurations would require performing a Monte Carlo computation similar to what we have done previously for mammography,41,42 which is a task beyond the scope of this research.
3. RESULTS
3.A. Quantitative measurements
Figures 7(a)–7(c) present the 2D NPS, 1D NPS curve, and MTF curve, respectively, which were measured and calculated based on the in-line phase contrast projection method using the slit camera. The results show the fundamental characteristics of noise and spatial resolution for the in-line phase contrast tomosynthesis prototype without introducing the reconstruction algorithm.
FIG. 7.

In-line phase contrast projection quantitative measurements: (a) 2D NPS, (b) 1D NPS curve, and (c) MTF curve.
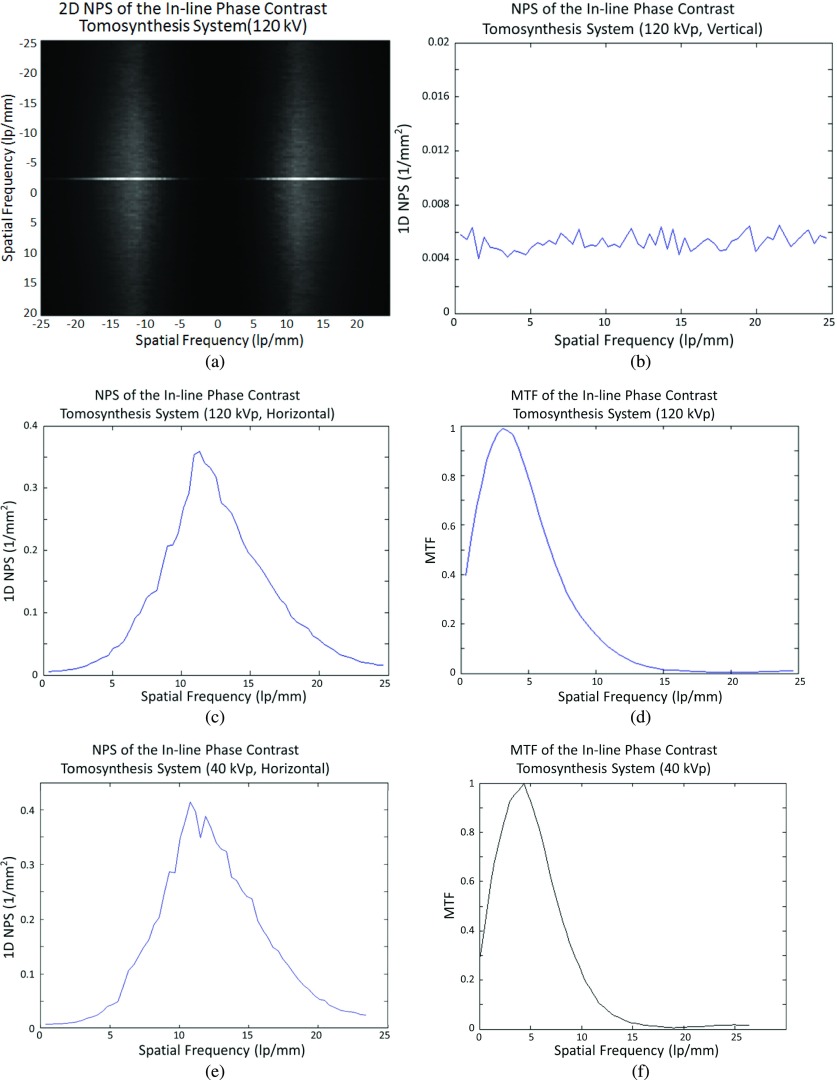
Figure 8(a) shows the reconstructed 2D in-plane noise power spectrum calculated from the in-plane noise-only image by the methods presented in the literature.22,24 The curves shown in Figs. 8(b)–8(d) are 1D in-plane NPS curves and MTF curve of the in-line phase contrast tomosynthesis prototype, respectively.
FIG. 8.
In-line phase contrast tomosynthesis quantitative measurements under 120 kVp: (a) 2D in-plane NPS, (b) vertical 1D in-plane NPS curve, (c) horizontal (tube-sweeping direction) 1D in-plane NPS curve, and (d) in-plane MTF curve of the high-energy in-line phase contrast tomosynthesis prototype; (e) and (f) are the horizontal 1D in-plane NPS curve and in-plane MTF curve of a 40 kVp in-line phase contrast tomosynthesis prototype.
Along with the high-energy in-line phase contrast tomosynthesis in-plane NPS and MTF curves, Figs. 8(e) and 8(f) show the in-line phase contrast tomosynthesis in-plane NPS and MTF curves acquired under low-energy x-ray exposure (40 kVp without additional beam filtration), utilizing the same system geometry and the same milliampere-second as in high-energy mode.
Need to note that these quantitative results were calculated after tomosynthesis reconstruction and took the effects of the reconstruction algorithm into account.
Comparing the NPS curves measured with the high-energy projection mode in Fig. 7(b) and high-energy in-line phase contrast tomosynthesis in Fig. 8(b), the noise within the images is at the same level and shares the same trend for spatial frequencies higher than 11.5 lp/mm. The obvious contrary behaviors occurring for lower spatial frequencies represent the effect of tomosynthesis, in which the reconstruction algorithm, especially the ramp filter used in backprojection, suppresses the image signals with relatively low spatial frequencies along the tube-sweeping direction, although the insufficiency of angular projections may also induce this defect on a quantitative curve.21–26,43–45 This phenomenon can also be observed in the high-energy in-line phase contrast tomosynthesis in-plane MTF curve in Fig. 8(c).
In Fig. 8, the comparison between high-energy and low-energy in-line phase contrast tomosynthesis prototypes indicates that the low-energy prototype noise power is higher than that of the high-energy prototype at spatial frequencies above 14.3 lp/mm, while for the MTF curve, this phenomenon occurs for frequencies above 4.6 lp/mm. These phenomena imply that in the low-energy imaging mode, noise potentially has greater negative effects on an object with high-spatial-frequency structures, and the MTF is higher than in high-energy mode. Further investigation on the effects of different x-ray energies was not in the scope of this research and therefore will be evaluated in a future study.
3.B. Edge enhancement-to-noise ratio
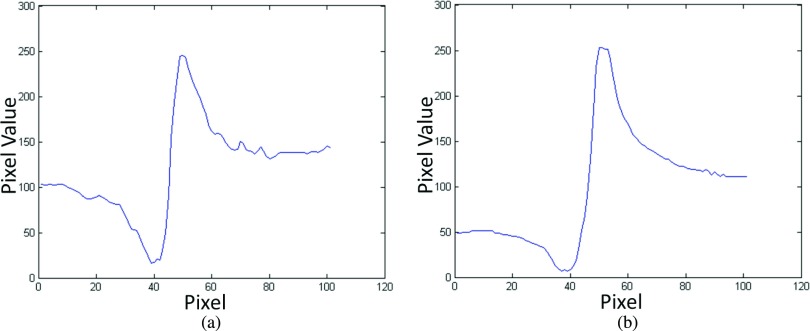
The reconstructed tomosynthesis in-plane images of the edge phantom used in the MTF measurements acquired by conventional DTS and in-line phase contrast imaging systems can be compared using the concept of EE/N, which is defined as follows:46
| (6) |
where Max, Min, σL, and σH denote the maximum intensity value of the edge, the minimum intensity value of the edge, the standard deviation of the lower background, and the standard deviation of the higher background, respectively. In this case, the backgrounds of the edge were defined as regions of 12 pixels adjacent to the left and right of the edge. As detailed in Sec. 2.B, the averaged horizontal profile intensities along the maximum-value lines were plotted for calculating EE/N. The plotted 1D edge profiles of the two imaging methods are presented in Fig. 9. The conventional DTS in-plane image of the edge phantom was taken at 40 kVp and 93 mA s, with a SOD of 76.2 cm and a SID of 86.4 cm. These plots were calculated after tomosynthesis reconstruction and took the effects of the reconstruction algorithm into account. Since the tomosynthesis reconstruction is a limited angle tomography, the samples are not accurately reconstructed such that the residual effects of the ramp filter used in the reconstruction remain. Hence, all conventional DTS images exhibit some edge enhancement in the tube-sweeping direction.
FIG. 9.
Plotted edge profiles of the edge phantom imaged by using (a) conventional DTS and (b) high-energy in-line phase contrast tomosynthesis system.
As the attenuation contrast decreases with increasing x-ray energies, more transmission of 120 kVp beam would result in less object’s absorption dose than that of 40 kVp beam, and the attenuation contrast of a 40-kVp-beam image was supposed to be better than that of 120 kVp beam. Thus, the relatively low entrance dose for the 120 kVp imaging with longer objective-to-imaging distance was expected to result in relatively low differences among maximum intensity value, minimum intensity value, and background. The calculated results of EE/N shown in Table II illustrated that the EE/N of the high-energy in-line phase contrast tomosynthesis modality was 1.44 times of the conventional DTS. This phenomenon demonstrated that a high-energy in-line phase contrast tomosynthesis system can provide imaging abilities similar to and/or comparable with a conventional digital tomosynthesis.
TABLE II.
Comparison of edge enhancement-to-noise ratios.
| Method | Max | Min | σL | σH | EE/N | Uncertainty of EE/N |
|---|---|---|---|---|---|---|
| Conventional DTS | 245 | 16 | 8.18 | 4.39 | 24.68 | 5.77 |
| High-energy in-line phase contrast tomosynthesis | 253 | 7 | 4.33 | 5.38 | 35.64 | 11.80 |
3.C. Bubble wrap phantom
3.C.1. Observation of the result images
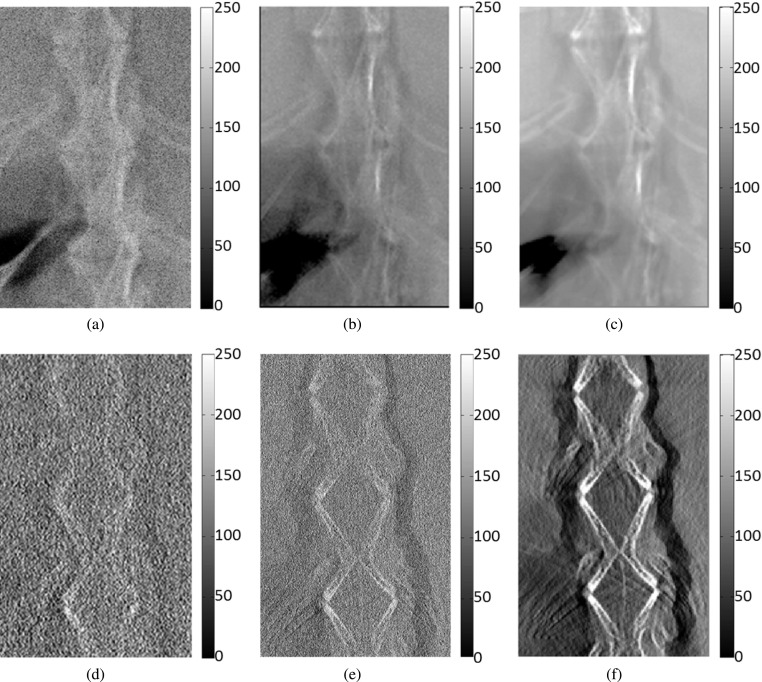
In the bubble wrap phantom study, the two pieces of bubble wrap were separated by a piece of acrylic board with a thickness of 9 mm. Considering the 2 mm thickness of each bubble wrap piece, the middle slices of the two bubble wrap layers were located at −5.5 mm and +5.5 mm with respect to the center of the entire phantom. The projection images (0° angular projection) and the reconstructed slices at −5.5 mm taken by the methods involved in comparison are shown in Fig. 10 to make a comparison. As the projections shown in the first row, the superimposed structures make the observer not able to distinguish the locations of the two bubble layers. On the contrary, tomosynthesis-reconstructed slices shown in the second row indicated that the overlapping issue was eliminated, and the high-energy in-line phase contrast tomosynthesis image holds the same level of quality through observation. Additionally, the image qualities of the in-plane slices were increased by employing both in-line phase contrast mechanism and PAD phase retrieval method.
FIG. 10.
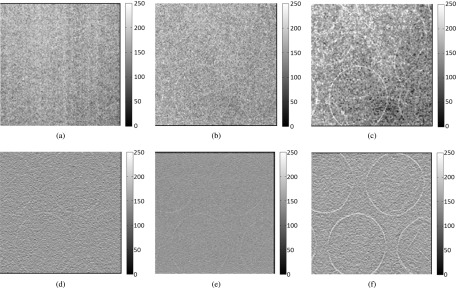
Bubble wrap phantom images acquired with the following methods: (a) radiography projection at 40 kVp, (b) in-line phase contrast projection at 120 kVp/2.5 mm Al filter, (c) phase-retrieved in-line phase contrast projection at 120 kVp/2.5 mm Al filter, (d) conventional DTS in-plane image at 40 kVp, (e) in-line phase contrast tomosynthesis in-plane image at 120 kVp/2.5 mm Al filter, and (f) in-line phase contrast tomosynthesis with phase retrieval method. The reconstructed in-plane images of the bubble phantom (d)–(f) were selected as the slices at −5.5 mm with respect to the rotation center (0 mm).
3.C.2. CNR of bubble wrap images
In Figs. 11(a)–11(c), the in-plane images of the bubble wrap phantom were acquired by conventional DTS and high-energy in-line phase contrast tomosynthesis without and with phase retrieval, respectively. These slices of the bubble wrap phantom acquired through different methods were located the same distance from the rotation center at −5.5 mm. From the in-plane images, the edges or the boundaries of the bubbles can be observed and easily distinguished in the image acquired with the high-energy in-line phase contrast tomosynthesis through the usage of phase retrieval preprocessing on the angular projections. The edges and contours of the bubbles cannot be distinguished easily and clearly in the conventional DTS image. The relative CNR values were calculated by employing the following formula:47
| (7) |
where IS, IB, σS, and σB represent the average intensity value of the bubble edge in the ROI, the average intensity value of the background near the object, the standard deviation of the object intensities, and the standard deviation of the background intensities, respectively. The average intensity value of the bubble edge in the ROI was calculated by averaging the maximum value of 16 randomly chosen intensity profile plots along the horizontal orientation. The background was a randomly chosen 16-pixel-by-16-pixel no-object area within the ROI. The CNR values calculated based on the in-plane images of the five-layer bubble wrap phantom are shown in Table III.
FIG. 11.

(a) Conventional DTS in-plane image of the bubble wrap phantom, high-energy in-line phase contrast tomosynthesis in-plane image of the bubble wrap phantom image (b) without phase retrieval, and (c) with phase retrieval. All three slices are at −5.5 mm from the center plane. The regions of interest (ROIs) selected to calculate CNR are denoted by the white squares.
TABLE III.
Contrast-to-noise ratio by different imaging methods for bubble wrap imaging.
| Method | Noise | CNR | Uncertainty of CNR |
|---|---|---|---|
| Conventional DTS | 22.51 | 1.61 | 0.44 |
| High-energy in-line phase contrast tomosynthesis without phase retrieval | 11.33 | 4.98 | 0.79 |
| High-energy in-line phase contrast tomosynthesis with phase retrieval | 6.61 | 12.34 | 0.49 |
The data in Table III indicate that the CNR of the bubble edge can be improved by approximately a factor of 2 by employing phase retrieval, as compared with high-energy in-line phase contrast tomosynthesis without using phase retrieval. Compared with the conventional DTS method, the CNR of the bubble edge can be improved by a factor of more than 6 when using high-energy in-line phase contrast tomosynthesis with phase retrieval. The discrepancy in the noise values among the DTS, phase contrast, and PAD phase contrast methods can be attributed to the following reasons: (1) in in-line phase contrast imaging, the large air gap between the object and detector reduces scattering; (2) for DTS, the detector receives more scattered x-ray photons from the object compared to in-line phase contrast, based on the modalities used in this study; and (3) the PAD method not only retrieves the phase map of a phantom but also simultaneously reduces imaging noise, as the PAD phase retrieval is essentially a robust integration procedure.
3.D. Fishbone phantom
3.D.1. Observation of the result images
In the fishbone phantom study, the projection images (0° angular projection) and the reconstructed slices at −7.5 mm taken by the comparison methods are shown in Fig. 10. As the phenomenon similar to the images presented in Sec. 3.C, the overlapping issue causes the observer to be unable to distinguish the locations of the bones based on the projections shown in the first row of Fig. 12. Meanwhile, tomosynthesis-reconstructed slices shown in the second row indicate that the superimposed structure was eliminated so that observers can distinguish the bone structure at the plane. Additionally, the image qualities of the in-plane slices were also increased by employing in-line phase contrast mechanism and PAD phase retrieval method.
FIG. 12.
Fishbone phantom images acquired with the following methods: (a) radiography projection at 40 kVp, (b) in-line phase contrast projection at 120 kVp/2.5 mm Al filter, (c) phase-retrieved in-line phase contrast projection at 120 kVp/2.5 mm Al filter, (d) conventional DTS in-plane image at 40 kVp, (e) in-line phase contrast tomosynthesis in-plane image at 120 kVp/2.5 mm Al filter, and (f) in-line phase contrast tomosynthesis with phase retrieval. The reconstructed in-plane images of the fishbone phantom (d)–(f) were selected as the slices on −7.5 mm with respect to the rotation center plane (0 mm).
3.D.2. CNR of fishbone images
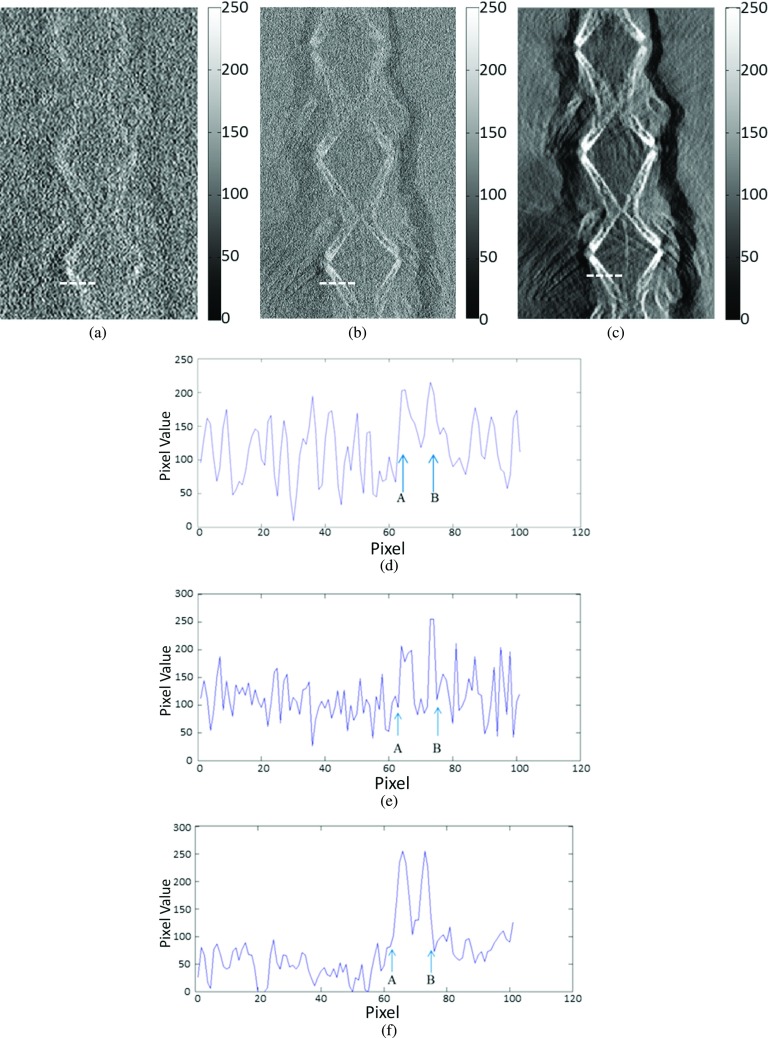
In Figs. 13(a)–13(c), the in-plane images were acquired by conventional DTS and high-energy in-line phase contrast tomosynthesis without and with phase retrieval, respectively. These slices of the fishbone acquired through different methods were located the same distance (−7.5 mm) from the center of the phantom. For the in-plane images, the tiny structures of the selected area on the fishbone cannot be distinguished easily or clearly in the conventional DTS image. Despite the effect of the imaging magnification on spatial resolution, which further improves the ability of structure discrimination, the contrast on the image acquired through conventional DTS is still poor. It should be noted that the phase contrast effects with the DTS are diminished, as a short sample-detector distance was employed for DTS, which did not provide the exiting phase-shifted x-rays with a sufficient propagation distance to interfere with each other to form phase contrast fringes. On the other hand, the details of the objects are fairly easily observed in the image acquired through high-energy in-line phase contrast tomosynthesis before applying phase retrieval preprocessing. However, comparing the intensity profiles in Figs. 13(d)–13(f) indicates that applying phase retrieval to the original angular projection images can be effective in suppressing image noise, which is also because of the noise suppression associated with the robust PAD-based phase retrieval method.48
FIG. 13.
(a) Conventional DTS in-plane image of the fishbone phantom, high-energy in-line phase contrast tomosynthesis in-plane images of the fishbone phantom (b) without phase retrieval, and (c) with phase retrieval at −7.5 mm. The regions of interest selected to plot intensity profiles are denoted by the dashed lines. Panels (d)–(f) are the plotted intensity profiles, respectively. Letters A and B in (d)–(f) were used to denote the two locations of bone structures corresponding to the plotting lines in panels (a)–(c).
Based on similar logic to that detailed in Sec. 3.C.2 and Eq. (7), the average value of the fishbone in the ROI denoted by white-line rectangle in Fig. 14 was calculated by averaging values of an 8 × 8 area on the bone structure, while another 8 × 8 area adjacent to the bone structure was considered image background. Calculated CNR values of the objects on the fishbone phantom images and the corresponding noise levels are provided in Table IV.
FIG. 14.

Regions of interest selected to calculate contrast-to-noise ratios for (a) conventional DTS in-plane image of the fishbone phantom, high-energy in-line phase contrast tomosynthesis in-plane images of the fishbone phantom (b) without phase retrieval, and (c) with phase retrieval.
TABLE IV.
Contrast-to-noise ratio by different imaging methods for fishbone imaging.
| Method | Noise | CNR | Uncertainty of CNR |
|---|---|---|---|
| Conventional DTS | 14.39 | 3.53 | 0.86 |
| High-energy in-line phase contrast tomosynthesis without phase retrieval | 10.83 | 8.50 | 1.60 |
| High-energy in-line phase contrast tomosynthesis with phase retrieval | 3.20 | 61.28 | 0.35 |
The data shown in Table IV indicate that the CNR of the fishbone features can be improved by a factor of more than 7 by using phase retrieval with high-energy in-line phase contrast tomosynthesis, as compared to that without using phase retrieval. Compared with the conventional DTS method, the CNR can be improved by a factor of 17 by employing phase retrieval, and the noise values are at approximately the same level. The discrepancy in the noise values among the DTS, phase contrast, and PAD phase contrast can be attributed to the same reasons discussed in Sec. 3.C.2.
3.E. Chicken breast phantom
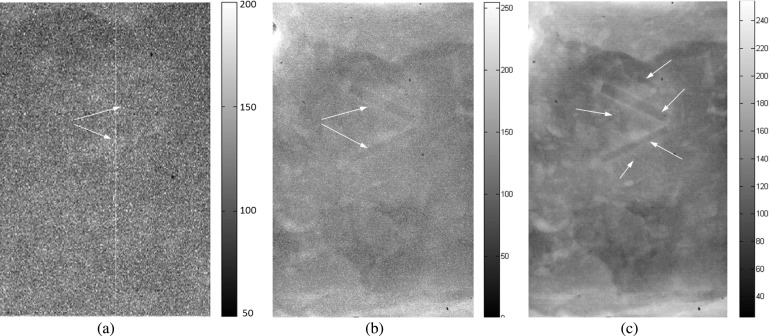
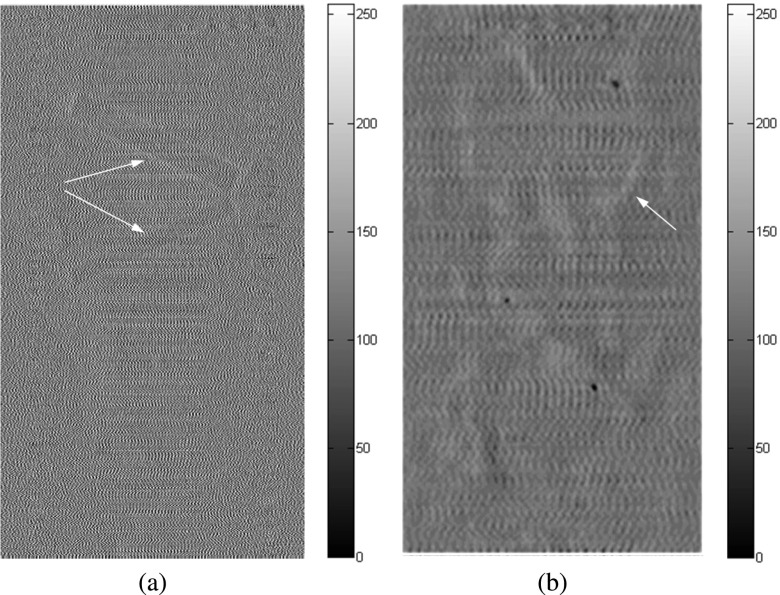
In this study of a biologically relevant phantom, the projection images and the reconstructed in-plane slices of the inserted structures in the chicken breast acquired by the different comparison methods are shown in Figs. 15–18. As with the phenomenon in the images presented in Secs. 3.C and 3.D, the overlapping issue causes the observer to be unable to distinguish the locations of the fibrils and masses on the projections shown in Fig. 15. However, the tomosynthesis-reconstructed slices shown in Figs. 16–18 indicate that the superimposed structures were eliminated, allowing observers to distinguish the structures and embedded objects at different planes within the phantom.
FIG. 15.
Chicken breast phantom images acquired with the following projection modes: (a) radiography projection at 40 kVp, (b) in-line phase contrast projection at 120 kVp/2.5 mm Al filter, and (c) phase-retrieved in-line phase contrast projection at 120 kVp/2.5 mm Al filter. The arrows denote the objects that can be observed.
FIG. 16.
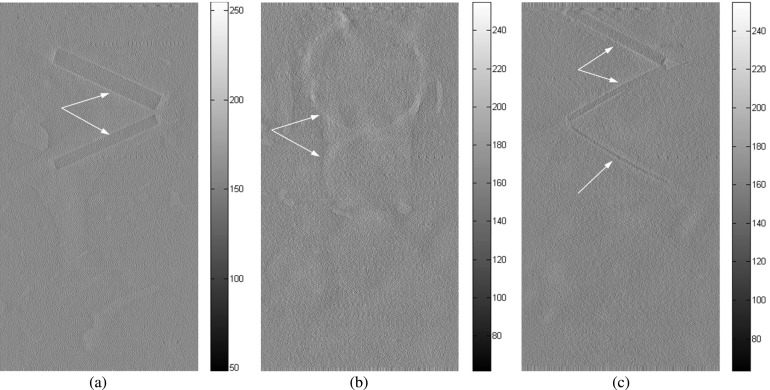
In-plane chicken breast phantom images acquired with conventional DTS in-plane imaging under 40 kVp: (a) the front plane containing 1.56 and 1.12 mm fibrils, (b) the middle plane containing 2.00, 1.00, 0.75, and 0.50 mm masses. The fibrils with diameters of 0.89, 0.75, and 0.54 mm on the rear plane cannot be observed in the images acquired by using conventional DTS. The arrows denote the objects that can be observed.
FIG. 17.
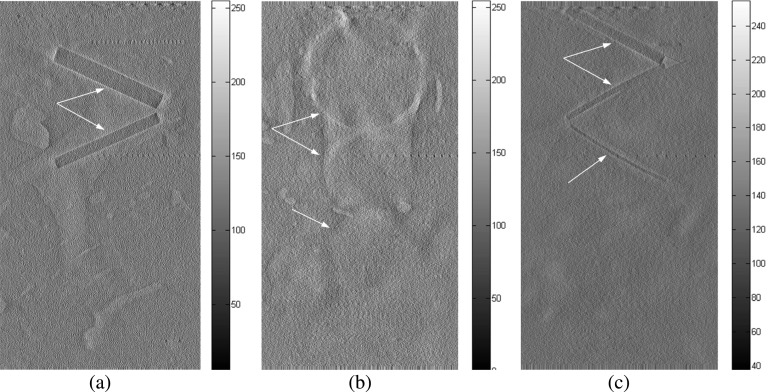
In-plane chicken breast phantom images acquired with in-line phase contrast tomosynthesis in-plane imaging under 120 kVp/2.5 mm Al filter: (a) the front plane containing 1.56 and 1.12 mm fibrils, (b) the middle plane containing 2.00, 1.00, 0.75, and 0.50 mm masses, and (c) the rear plane containing 0.89, 0.75, and 0.54 mm fibrils. The arrows denote the objects that can be observed.
FIG. 18.
In-plane chicken breast phantom images acquired with in-line phase contrast tomosynthesis with phase retrieval method under 120 kVp/2.5 mm Al filter: (a) the front plane containing 1.56 and 1.12 mm fibrils, (b) the middle plane containing 2.00, 1.00, 0.75, and 0.50 mm masses, and (c) the rear plane containing 0.89, 0.75, and 0.54 mm fibrils. The arrows denote the objects that can be observed.
As shown in Fig. 16, the conventional DTS images demonstrate poor contrast of the targets. One important difference between the ACR mammographic accreditation phantom and our chicken breast phantom should be noted. In the ACR phantom, the fibril and mass targets are embedded in a 7-mm thick wax plate (900 kg/m3 in density), but the fibril and mass targets in our phantom are embedded in chicken breast (1121 kg/m3 in density), which is much larger in mass density than the wax. Hence, we expect that the intrinsic radiological contrast between the targets and chicken breast will be much lower than that between the targets and the wax in the ACR phantom.
Comparing the slices on different planes shown in Figs. 16–18, the following observations can be made: (1) although the fibrils on the front plane can be distinguished by the three presented methods, the image qualities were dramatically increased by introducing the PAD retrieval method; (2) in the in-plane images of the middle plane, the application of the PAD method not only increased the number of distinguishable masses but also increased the image contrast; and (3) the fibrils with diameters of 0.89, 0.75, and 0.54 mm were not observable in the 40 kVp DTS reconstructions, but the images of these fibrils were observable by utilizing high-energy in-line phase contrast tomosynthesis, and the imaging quality was further enhanced by introducing the PAD method. Overall, the image qualities of the in-plane slices were increased by employing the in-line phase contrast mechanism and the PAD phase retrieval method.
3.F. Superimposed structures removal
Figures 10(a)–10(c), 12(a)–12(c), and 15(a)–15(c) show the radiography projection image and in-line phase contrast projections acquired without and with PAD phase retrieval for the bubble wrap phantom, the fishbone phantom, and the chicken breast phantom, respectively. Comparing the different methods, the phase-retrieved projection images in Figs. 10(c), 12(c), and 15(c) demonstrate improved image quality, as observers can easily detect the edges of the bubbles, sharp boundaries of the fishbone, and some of the inserted structures inside the chicken breast, but structure overlapping still cannot be avoided. On the contrary, as shown in Figs. 10(d)–10(e), 12(d)–12(e), and 16–18, the tomosynthesis mechanism facilitates the reconstruction of in-plane images, which allows observers to distinguish the characteristics of the object for different layers.
4. DISCUSSION
In order to compare the two techniques under their respective optimal configurations, the acquisition conditions were very different for the in-line phase contrast tomosynthesis versus conventional DTS. The experimental results, therefore, have limitations on the applicability. For example, the demonstrated performance of in-line phase contrast tomosynthesis was obtained under specific exposure conditions (120 kVp x-ray beam with filtration, a specific magnification factor, specific phantoms to accentuate certain features, etc.).
Although a biologically relevant chicken breast phantom was investigated in this study, the measurements may still suffer from several limitations. The chicken breast phantom was a laboratory-fabricated phantom and the material was not evenly cut, so the thickness of the chicken was not even. This unevenness of the structure may cause inhomogeneous parts on the images. Since the chicken was not frozen and was not compressed firmly, small movements caused by gravity during the measurements may result in artifacts and errors. Therefore, further investigations are needed with gold-standard phantoms to provide more comprehensive performance comparisons between in-line phase contrast tomosynthesis and conventional tomosynthesis imaging techniques.
The initial results demonstrate the feasibility of in-line phase contrast tomosynthesis to enhance image contrast-noise ratios with comparable radiation doses. High exposure levels used in this work resulted from the specific phantoms employed in the experiments. The first phantom employed in our study is a five-layer bubble wrap embedded in 30-mm acrylic plates. The imaging targets are the rims of each of the bubbles. The bubble rims present very low radiological contrast in the projections. Hence, a high exposure (5322 mR) was used with the conventional DTS technique. As is shown in Figs. 10(a) and 10(d), even with such a high exposure, the rims are just barely visible in the images acquired with the DTS technique. This being so, for a performance comparison, the experiment with the in-line phase contrast tomosynthesis technique employed a comparable exposure. In the similar low-contrast imaging task presented for the 60-mm thick chicken breast phantom, the imaging targets are the embedded fibrils and masses, which were extracted from an ACR mammography phantom. However, as is pointed out earlier, the intrinsic radiological contrast between the targets and chicken breast is much lower than that between these targets and the wax plate in the ACR phantom. This makes it necessary to use a high exposure in the DTS technique. In the fish bone phantom studied, the fish bones were embedded in a 110-mm thick beeswax block, and the large size of this phantom resulted in a high exposure employed for the DTS technique. Relating the results of this work to breast imaging, we note that the intrinsic radiological contrast of breast tissues will be much higher than that for the targets in our bubble phantom and chicken breast phantom. Therefore, we expect that a much lower entrance exposure level can be used with the DTS and phase techniques for breast imaging. In fact, recently we compared images of a 4.5 cm thick contrast-detail phantom acquired on a phase imaging setting with images acquired on a commercial flat panel digital mammography unit. The phase contrast images were acquired at 120 kVp and 4.5 mA s, with a geometric magnification factor of 2.46. Conventional digital mammography images were acquired at 28 kVp and 54 mA s. For the same radiation dose, both the observer study and signal-to-noise ratio comparisons indicated large improvement by the phase-retrieved image as compared to the clinical system.49 The exact radiation dose comparisons will be quantified in a future study, which will calculate the absorbed dose values corresponding to the comparison methods instead of applying estimations through the entrance exposure values.
Several remarks are due for the applicability of the PAD-based phase retrieval method. As mentioned in Sec. 2.E, the most applicable selection of x-ray photon energy for PAD ranges from 60 to 500 keV. Experimentally, obtaining x-ray photons with energies from 60 to 120 keV implies that heavy filtration must be utilized to completely remove photons less than 60 keV with 120 kVp output.39,46 Thus, the exposure time is dramatically increased, due to very low x-ray photon flux when employing heavy prime beam filtration. Therefore, the goal of the prime beam filtration used in this research was to remove most of the x-ray photons under 30 keV and to introduce the experimental exposure condition in order to approximately satisfy the application condition of the PAD retrieval method. Due to the use of polychromatic x-rays, it was necessary to approximate the values utilized in Eq. (5) for the average wavelength λ and the Klein–Nishina total cross section σKN as those corresponding to a 60.5 keV x-ray, which is the estimated average photon energy for a 120 kVp x-ray beam.
Also mentioned in Sec. 2.E, the x-ray attenuation by soft-tissuelike materials made up of low-Z (Z < 10) elements is dominated by incoherent x-ray scattering, due to the use of high-energy x-rays as described above. Thus, the principle of phase-attenuation duality applies. For the components of high-Z elements, PAD does not hold. As a result, the retrieved phase values of high-Z components include errors, but the retrieved phase values for the low-Z components are accurate, since the PAD equation is a differential equation and its solution is unique in its locality. Our previous experiment using a 60 keV synchrotron beam found that the presence of aluminum (Z = 13) in a phantom results in an approximate 36% discrepancy in the reconstructed electron density for the aluminum component in the phantom. As detailed in Sec. 2.D, the effective atomic number Zeff of fishbone is about 13; thus, the same level of 36% difference from the theoretical phase values can be expected. Contrary to CT, tomosynthesis is essentially a limited angle tomography, which itself cannot provide exact reconstruction by its nature. Further investigation is needed on the quantitative aspects of phase retrieval-based tomosynthesis.
As for the effects of the different magnification factors in phase tomosynthesis versus conventional DTS, note that the phantom features in the comparisons are of 0.4 mm or larger in size, so they could all be resolved by the detector in both the conventional and phase imaging configurations, as long as sufficient contrast-noise ratios exist. Hence, the magnification factor used is not the deciding factor, although larger magnification with phase imaging causes potential blurring from the focal spot, while no such blur occurs with the conventional DTS configuration.
To address the effects of the detector performance on the comparison, note that the detector DQE decreases with increasing photon energy, since the quantum efficiency of a detector decreases with increasing photon energy,50 as does the attenuation contrast between different tissue/materials. Consequently, the use of the high-kVp beam is intrinsically disadvantageous to phase imaging in this comparison study. The phase contrast itself decreases with increasing photon energy as well. However, in order to reduce exposure times with the current-limiting microfocus tube while also allowing the use of the low kVp beam for conventional imaging, the high-kVp beam is necessary for phase imaging. In addition, high-kVp imaging is especially relevant for imaging thick body parts, due to the higher penetration ability. Our work in fact provides for the first time a study on the performance of high-kVp phase tomosynthesis. Despite the disadvantages with high-kVp imaging detailed above, however, this research demonstrated that high-energy in-line phase contrast imaging at a reduced radiation dose provides comparable image quality to low-energy conventional nonphase-contrast imaging. In addition, a significant contrast-noise ratio enhancement with PAD phase retrieval as compared to conventional DTS was demonstrated.
5. CONCLUSION
In this research, the major objectives were to demonstrate a high-energy in-line phase contrast tomosynthesis imaging system and investigate the capabilities of edge enhancement, contrast improvement, and noise suppression through employing the PAD method onto angular projection images.
The quantitative calculations of in-plane MTF and NPS successfully characterized the high-energy in-line phase contrast tomosynthesis system. The phantom studies demonstrated that this imaging prototype can successfully remove the structure overlapping in phantom projections, obtain delineate interfaces, and achieve enhancement in contrast-to-noise ratios after applying the PAD-based phase retrieval to the angular projections. To our knowledge, this is the first time that PAD phase retrieval methods have been applied to tomosynthesis imaging.
Although the selection of the x-ray exposure spectrum was not perfect due to an experimental trade-off between the exposure time and the number of x-ray photons, the image quality of the high-energy in-line phase contrast tomosynthesis method with PAD phase retrieval was improved as compared with conventional DTS.
ACKNOWLEDGMENTS
This research was supported in part by the NIH under Grant No. R01CA142587 and in part by a grant from the University of Oklahoma Charles and Peggy Stephenson Cancer Center funded by the Oklahoma Tobacco Settlement Endowment Trust. The authors would like to acknowledge the support of Charles and Jean Smith Chair endowment fund as well.
REFERENCES
- 1.Quaia E., Baratella E., Cernic S., Lorusso A., Casagrande F., Cioffi V., and Cova M. A., “Analysis of the impact of digital tomosynthesis on the radiological investigation of patients with suspected pulmonary lesions on chest radiography,” Eur. Radiol. 22(9), 1912–1922 (2012). 10.1007/s00330-012-2440-3 [DOI] [PubMed] [Google Scholar]
- 2.Hammonds J., Price R., Donnelly E., and Pickens D., “Phase-contrast digital tomosynthesis,” Med. Phys. 38(5), 2353–2358 (2011). 10.1118/1.3574871 [DOI] [PubMed] [Google Scholar]
- 3.Miao H., Wu X., Zhao H., and Liu H., “A phantom-based calibration method for digital x-ray tomosynthesis,” J Xray Sci Technol. 20(1), 17–29 (2012). 10.3233/XST-2012-0316 [DOI] [PMC free article] [PubMed] [Google Scholar]
- 4.Mainprize J., Bloomquist A., Wang X., and Yaffe M., “Dependence of image quality on geometric factors in breast tomosynthesis,” Med. Phys. 38, 3090–3103 (2011). 10.1118/1.3591990 [DOI] [PubMed] [Google Scholar]
- 5.Zhao B., Zhou J., Hu Y., Mertelmeier T., Ludwig J., and Zhao W., “Experimental validation of a three-dimensional linear system model for breast tomosynthesis,” Med. Phys. 36(1), 240–251 (2009). 10.1118/1.3040178 [DOI] [PMC free article] [PubMed] [Google Scholar]
- 6.Zhang D., Donovan M., Fajardo L. L., Archer A., Wu X. Z., and Liu H., “Preliminary feasibility study of an in-line phase contrast x-ray imaging prototype,” IEEE Trans. Biomed. Eng. 55(9), 2249–2257 (2008). 10.1109/tbme.2008.919136 [DOI] [PubMed] [Google Scholar]
- 7.Wu D., Miao H., Li Y., Wu X., and Liu H., “In-plane spatial resolution measurements of a phase-contrast tomosynthesis prototype,” Proc. SPIE 8224, 82240D (2012). 10.1117/12.910126 [DOI] [Google Scholar]
- 8.Yan A., Wu X., and Liu H., “Performance analysis of the attenuation-partition based iterative phase retrieval algorithm for in-line phase-contrast imaging,” Opt. Express 18(15), 16074–16089 (2010). 10.1364/oe.18.016074 [DOI] [PMC free article] [PubMed] [Google Scholar]
- 9.Jin M., Huang Z., Xiao Y., Yin H., Wang Z., and Xiao T., “Phase-contrast tomosynthetic experiment on biological samples with synchrotron radiation,” Nuclear Science Symposium Conference Record (NSS/MIC), 2010 IEEE (IEEE, Knoxville, TN, 2010). [Google Scholar]
- 10.Helfen L., Baumbach T., Cloetens P., and Baruchel J., “Phase-contrast and holographic computed laminography,” Appl. Phys. Lett. 94(10), 104103 (2009). 10.1063/1.3089237 [DOI] [Google Scholar]
- 11.Maravilla K. R., Murry R. C., and Horner S., “Digital tomosynthesis–Technique for electronic reconstructive tomography,” Am. J. Roentgenol. 141(3), 497–502 (1983). 10.2214/ajr.141.3.497 [DOI] [PubMed] [Google Scholar]
- 12.Wilkins S. W., Gureyev T. E., Gao D., Pogany A., and Stevenson A. W., “Phase-contrast imaging using polychromatic hard x-rays,” Nature 384(6607), 335–338 (1996). 10.1038/384335a0 [DOI] [Google Scholar]
- 13.Wu D., Miao H., Li Y., Chen W., Wu X., and Liu H., “A phantom study to characterize the imaging quality of a phase-contrast tomosynthesis prototype,” Proc. SPIE 8582, 85820J (2013). 10.1117/12.2008644 [DOI] [Google Scholar]
- 14.Wu X. and Liu H., “A general theoretical formalism for x-ray phase contrast imaging,” J Xray Sci Technol. 11(1), 33–42 (2003). [PubMed] [Google Scholar]
- 15.Wu X. and Liu H., “Clinical implementation of x-ray phase-contrast imaging: Theoretical foundations and design considerations,” Med. Phys. 30(8), 2169–2179 (2003). 10.1118/1.1593836 [DOI] [PubMed] [Google Scholar]
- 16.Wu X. and Liu H., “An experimental method of determining relative phase-contrast factor for x-ray imaging systems,” Med. Phys. 31(5), 997–1002 (2004). 10.1118/1.1688213 [DOI] [PubMed] [Google Scholar]
- 17.Huang Z., Kang K., Zhang L., Chen Z., Ding F., Wang Z., and Fang Q., “Differential phase-contrast imaging experimental system under the incoherent condition with conventional x-ray tubes,” IEEE Trans. Nucl. Sci. 56(3), 1438–1443 (2009). 10.1109/tns.2009.2013948 [DOI] [Google Scholar]
- 18.Hammonds J. C., Price R. R., Pickens D. R., and Donnelly E. F., “In-line phase shift tomosynthesis,” Med. Phys. 40, 081911 (5pp.) (2013). 10.1118/1.4813295 [DOI] [PubMed] [Google Scholar]
- 19.Stutman D., Beck T. J., Carrino J. A., and Bingham C. O., “Talbot phase-contrast x-ray imaging for the small joints of the hand,” Phys. Med. Biol. 56(17), 5697–5720 (2011). 10.1088/0031-9155/56/17/015 [DOI] [PMC free article] [PubMed] [Google Scholar]
- 20.Blonder B., De Carlo F., Moore J., Rivers M., and Enquist B. J., “X-ray imaging of leaf venation networks,” New Phytol. 196(4), 1274–1282 (2012). 10.1111/j.1469-8137.2012.04355.x [DOI] [PubMed] [Google Scholar]
- 21.Zhang D., Rong J., Chu R., Chen W. R., and Liu H., “DQE measurements in magnification x-ray imaging,” J Xray Sci Technol. 14(2), 141–150 (2006). [Google Scholar]
- 22.Donovan M., Zhang D., and Liu H., “Step by step analysis toward optimal MTF algorithm using an edge test device,” J Xray Sci Technol. 17(1), 1–15 (2009). 10.3233/XST-2009-0210 [DOI] [PubMed] [Google Scholar]
- 23.Zhao B. and Zhao W., “Imaging performance of an amorphous selenium digital mammography detector in a breast tomosynthesis system,” Med. Phys. 35(5), 1978–1987 (2008). 10.1118/1.2903425 [DOI] [PMC free article] [PubMed] [Google Scholar]
- 24.Mainprize J. G., Bloomquist A. K., Kempston M. P., and Yaffe M. J., “Resolution at oblique incidence angles of a flat panel imager for breast tomosynthesis,” Med. Phys. 33(9), 3159–3164 (2006). 10.1118/1.2241994 [DOI] [PubMed] [Google Scholar]
- 25.Siewerdsen J., Cunningham I., and Jaffray D., “A framework for noise-power spectrum analysis of multidimensional images,” Med. Phys. 29(11), 2655–2671 (2002). 10.1118/1.1513158 [DOI] [PubMed] [Google Scholar]
- 26.Wells J. and Dobbins J., “Estimation of the two-dimensional presampled modulation transfer function of digital radiography devices using one-dimensional test objects,” Med. Phys. 39(10), 6148–6160 (2012). 10.1118/1.4752442 [DOI] [PMC free article] [PubMed] [Google Scholar]
- 27.Feldkamp L., Davis L., and Kress J., “Practical cone-beam reconstruction,” J. Opt. Soc. Am. A 1(6), 612–619 (1984). 10.1364/JOSAA.1.000612 [DOI] [Google Scholar]
- 28.Rougee A., Picard C., and Trousset Y., “Geometrical calibration for 3D x-ray imaging,” Proc. SPIE 1897, 161–169 (1993). 10.1117/12.146963 [DOI] [PubMed] [Google Scholar]
- 29.Godfrey D., Yin F., and Oldham M., “Digital tomosynthesis with an on-board kilovoltage imaging device,” Int. J. Radiat. Oncol., Biol., Phys. 65(1), 8–15 (2006). 10.1016/j.ijrobp.2006.01.025 [DOI] [PubMed] [Google Scholar]
- 30.Chen Z., Calhoun V., and Chang S., “Compensating the intensity fall-off effect in cone-beam tomography by an empirical weight formula,” Appl. Opt. 47(32), 6033–6039 (2008). 10.1364/ao.47.006033 [DOI] [PMC free article] [PubMed] [Google Scholar]
- 31.Wong M., Wu X., and Liu H., “Preliminary investigation on the effect of x-ray beam hardening on detective quantum efficiency and radiation dose,” Image Analysis & Interpretation (SSIAI), 2010 IEEE Southwest Symposium on, 23–25 May (IEEE, Austin, TX, 2010). [Google Scholar]
- 32.Boedeker K., Cooper V., and McNitt-Gray M., “Application of the noise power spectrum in modern diagnostic MDCT: Part I. Measurement of noise power spectra and noise equivalent quanta,” Phys. Med. Biol. 52(14), 4027–4046 (2007). 10.1088/0031-9155/52/14/002 [DOI] [PubMed] [Google Scholar]
- 33.Hubbell J. and Seltzer S., Tables of X-Ray Mass Attenuation Coefficients and Mass Energy-Absorption Coefficients (version 1.4) (National Institute of Standards and Technology, Gaithersburg, MD, 2004). [Google Scholar]
- 34.Vidal R. and Souza D., “A model for the characterization and selection of beeswaxes for use as base substitute tissue in photon teletherapy,” Mater. Sci. Appl. 3(4), 218–223 (2012). 10.4236/msa.2012.34032 [DOI] [Google Scholar]
- 35.Bushberg J., Seibert J., Leidholt E., and Boone J., The Essential Physics of Medical Imaging, 2nd ed. (Lippincott Williams & Wilkins, Baltimore, PA, 2002). [Google Scholar]
- 36.Wu X., Liu H., and Yan A., “X-ray phase-attenuation duality and phase retrieval,” Opt. Lett. 30, 379–381 (2005). 10.1364/ol.30.000379 [DOI] [PubMed] [Google Scholar]
- 37.Wu X. and Yan A., “Phase retrieval from one single phase contrast x-ray image,” Opt. Express 17, 11187–11196 (2009). 10.1364/oe.17.011187 [DOI] [PubMed] [Google Scholar]
- 38.Liu H., Zhang D., and Wu X., “Development of a dual detector phase x-ray imaging system: Design considerations,” Proceedings of IEEE Southwest Symposium on Image Analysis and Interpretation (SSIAI) (IEEE, Santa Fe, NM, 2008), pp. 193–196. [Google Scholar]
- 39.Liu H., Ren Y., Guo H., Xue Y., Xie H., Xiao T., and Wu X., “Phase retrieval for hard X-ray computed tomography of samples with hybrid compositions,” Chin. Opt. Lett. 10, 121101–121104 (2012). 10.3788/col201210.121101 [DOI] [PMC free article] [PubMed] [Google Scholar]
- 40.Wu G., Mainprize J. G., Boone J. M., and Yaffe M. J., “Evaluation of scatter effects on image quality for breast tomosynthesis,” Med. Phys. 36, 4425–4432 (2009). 10.1118/1.3215926 [DOI] [PMC free article] [PubMed] [Google Scholar]
- 41.Wu X., Barnes G., and Tucker M., “Spectral dependence of glandular tissue dose in screen-film mammography,” Radiology 179, 143–148 (1991). 10.1148/radiology.179.1.2006265 [DOI] [PubMed] [Google Scholar]
- 42.Wu X., Gingold E., Barnes G., and Tucker M., “Normalized average glandular dose in Molybdenum Target-Rhodium filter and Rhodium Target-Rhodium filter mammography,” Radiology 193(1), 83–89 (1994). 10.1148/radiology.193.1.8090926 [DOI] [PubMed] [Google Scholar]
- 43.Wang X., Mainprize J., Wu G., and Yaffe M., “Task-based evaluation of image quality of filtered back projection for breast tomosynthesis,” in Proceedings of the 10th International Workshop on Digital Mammography (Springer Berlin Heidelberg, Girona, Spain, 2010), pp. 106–113. [Google Scholar]
- 44.Marshall N., Jacobs J., Cockmartin L., and Bosmans H., “Technical evaluation of a digital breast tomosynthesis system,” in Proceedings of the 10th International Workshop on Digital Mammography (Springer Berlin Heidelberg, Girona, Spain, 2010), pp. 350–356. [Google Scholar]
- 45.Ludwig J., Mertelmeier T., Kunze H., and Härer W., “A novel approach for filtered backprojection in tomosynthesis based on filter kernels determined by iterative reconstruction techniques,” in Proceedings of the 9th International Workshop on Digital Mammography (Springer Berlin Heidelberg, Tucson, AZ, 2008), pp. 612–620. [Google Scholar]
- 46.Donnelly E., Price R., and Pickens D., “Quantification of the effect of system and object parameters on edge enhancement in phase-contrast radiography,” Med. Phys. 30(11), 2888–2896 (2003). 10.1118/1.1617430 [DOI] [PubMed] [Google Scholar]
- 47.Doyle P., Martin C., and Gentle D., “Application of contrast-to-noise ratio in optimizing beam quality for digital chest radiography: Comparison of experimental measurements and theoretical simulations,” Phys. Med. Biol. 51, 2953–2970 (2006). 10.1088/0031-9155/51/11/018 [DOI] [PubMed] [Google Scholar]
- 48.Wu X., Liu H., and Yan A., “Robustness of a phase-retrieval approach based on phase-attenuation duality,” J Xray Sci Technol. 15(2), 85–95 (2007). [Google Scholar]
- 49.Wong M. D., Yan A., Ghani M., Li Y., Fajardo L., Wu X., and Liu H., “Dose and detectability improvements with high energy phase sensitive x-ray imaging in comparison to low energy conventional imaging,” Phys. Med. Biol. 59(9), N37–N48 (2014). 10.1088/0031-9155/59/9/n37 [DOI] [PMC free article] [PubMed] [Google Scholar]
- 50.Marshall N. W., “Detective quantum efficiency measured as a function of energy for two full-field digital mammography systems,” Phys. Med. Biol. 54, 2845–2861 (2009). 10.1088/0031-9155/54/9/017 [DOI] [PubMed] [Google Scholar]


