

Abstract
Objective
To analyse mortality and life expectancy in people with alcohol use disorder in Denmark, Finland and Sweden.
Method
A population-based register study including all patients admitted to hospital diagnosed with alcohol use disorder (1 158 486 person-years) from 1987 to 2006 in Denmark, Finland and Sweden.
Results
Life expectancy was 24–28 years shorter in people with alcohol use disorder than in the general population. From 1987 to 2006, the difference in life expectancy between patients with alcohol use disorder and the general population increased in men (Denmark, 1.8 years; Finland, 2.6 years; Sweden, 1.0 years); in women, the difference in life expectancy increased in Denmark (0.3 years) but decreased in Finland (−0.8 years) and Sweden (−1.8 years). People with alcohol use disorder had higher mortality from all causes of death (mortality rate ratio, 3.0–5.2), all diseases and medical conditions (2.3–4.8), and suicide (9.3–35.9).
Conclusion
People hospitalized with alcohol use disorder have an average life expectancy of 47–53 years (men) and 50–58 years (women) and die 24–28 years earlier than people in the general population.
Keywords: alcoholism, mortality, epidemiology, Scandinavia
Significant outcomes
People with alcohol use disorder have 24–28 years shorter life expectancy than the general population in the Nordic countries.
Alcohol use disorder is a major public health problem that causes many years of lost life, even in countries with restrictive alcohol consumption policies.
Limitations
A major limitation of the present study was the inclusion only of patients with alcohol use disorder from inpatient care, which may have caused selection bias of patients with the most severe health problems.
The study was register-based and lacked clinical data about treatment and adherence.
Alcohol consumption per capita was determined from aggregate data and not from alcohol exposure for individuals.
Introduction
Alcohol use disorder (AUD) is a major cause of morbidity and mortality (1). People with AUD have among the highest all-cause mortality of all people who receive treatment for mental disorders (2, 3). A meta-analysis that included 81 observational studies from many countries showed that people with AUD have three-fold higher mortality in men and four-fold higher mortality in women than the general population (4). In all people who have AUD, mortality is relatively higher in women, younger people and people in treatment for addiction (4). However, comprehensive mortality data over time of patients with AUD are not available from Nordic countries.
Increased alcohol consumption is associated with increased disease burden, accidents, and social problems (4, 5). In response to these effects, alcohol policies were created in Nordic countries (Sweden, Norway, Denmark, Finland and Iceland) to promote a decrease in alcohol consumption and restrict alcohol availability. The governments of all Nordic countries except Denmark have a monopoly of alcohol retail. However, after joining the European Union in 1995, Finland and Sweden shifted from a highly restrictive to a more liberal alcohol policy. The price of alcohol was reduced by tax reduction on alcoholic beverages in Denmark and Finland, abolition of quantitative quotas on alcoholic beverages in Sweden and Finland, and more generous opening hours of alcohol retailers in Sweden. These changes made alcohol more accessible to the public in these countries since 2003. The alcohol control policies of the countries were associated with total alcohol consumption (6, 7); Sweden has the most restrictive, and Denmark has the least restrictive alcohol policies. Frequency of heavy alcohol drinkers and alcohol-related problems are often assumed to depend on the level of alcohol consumption in the general population (7–9).
The reliable nationwide health care registers in Denmark, Finland and Sweden provide a unique opportunity to study mortality in people diagnosed with AUD.
Aims of the study
The purpose of this study was to evaluate mortality and life expectancy in people who had AUD in Denmark, Finland and Sweden between 1987 and 2006.
Material and methods
Study populations
National health registers from Denmark, Finland and Sweden were used to follow the entire population, approximately 20 million people, aged 15 years or above, in these three countries and identify all people who were admitted to hospital because of AUD as the primary or secondary diagnosis during 20 years (January 1, 1987 to December 31, 2006). Data about patients were retrieved from the national hospital discharge registers in each country. In Denmark, the data about patients were retrieved from the Psychiatric Care Register and the Hospital Discharge Register for medical care. In Finland and Sweden, the Hospital Discharge Registers, which contained information about medical and psychiatric care, were used. The hospital register information was linked to the national registers about causes of death in each country to retrieve data about date and cause of death. Data about alcohol consumption per capita were collected from an international database (6). Follow-up started on the date of first hospital admission for AUD. Each person was followed from the day of first hospital admission until death or the end of a 5-year period to estimate time trends with a sufficient number of deaths; therefore, a person could be counted in more than one time period if readmitted during a different period. For analysis of time trends, the 20-year observation period was divided into 5-year periods: 1987–1991, 1992–1996, 1997–2001 and 2002–2006. Ethical approval was obtained from the regional ethics committee in Gothenburg. The data-keeping authorities from each country gave permission to use health register data in this study.
Definitions
The diagnosis of AUD (mental and behavioural disorders due to alcohol use) was defined according to the World Health Organization classification system (International Classification of Diseases [ICD]): ICD-8, codes 291, 303; ICD-9, codes 291, 303, 305A; ICD-10, codes F10.0 to F10.9 (10–12). Causes of death were defined according to the classification as (1) all-cause mortality (ICD-8, codes 001 to E999; ICD-9, codes 001 to E999; ICD-10, codes A00 to Y98); (2) death from diseases and medical conditions (ICD-8, codes 001 to 796; ICD-9, codes 001 to 799; ICD-10, codes A00 to R99); (3) suicide (ICD-8, codes E950 to E959; ICD-9, codes E950 to E959; ICD-10, codes X60 to 84); and (4) external causes of death other than suicide (ICD-8, codes E800 to E999, excluding codes E950 to E959; ICD-9, codes E800 to E999, excluding codes E950 to E959; ICD-10, codes V01 to Y98, excluding codes X60 to 84) (10–12).
Alcohol consumption was defined as the national average of registered amount of alcohol consumed (litres of pure alcohol) per capita aged ≥15 years during a calendar year. The aggregate indicator from taxation data included consumption for the entire population based on production, import, export and sales (6).
Statistical analysis
The study population for each country was stratified into 5 age groups (15–29 years; 30–44 years; 45–59 years; 60–74 years; ≥75 years), and frequency of mortality was calculated for each group. Person-years and number of deaths were determined for each age group and 5-year period. Standardized mortality per 100 000 person-years was calculated for each country and standardized using Nordic population data for the year 2000 (13). Mortality rate ratios were calculated by taking standardized mortality rate in people with AUD divided by standardized mortality rate in general population. We calculated life expectancy for people with AUD aged ≥15 years, stratified by sex, using Wiesler method with 1-year age stratification (14). Life expectancy for each of the 5-year periods was determined. Population life expectancy data for each country, calculated and published by the World Health Organization (6), were used for population comparisons. The difference in life expectancy was calculated by taking life expectancy in general population minus life expectancy in people with AUD. Data from national registers in the Nordic countries include all individuals and are not samples. Therefore, confidence intervals (CI) are not relevant.
Results
Alcohol use disorder: incidence and associated mortality
In Denmark, the number of men and women hospitalized because of AUD was similar for the 5-year periods from 1987 to 2001 but increased for 2002 to 2006 (Table 1). In Finland, the number of men and women with AUD increased from 1987 to 2001 and remained unchanged for 2002 to 2006. In Sweden, the number of men with AUD decreased and the number of women with AUD increased from 1987 to 2006 (Table 1).
Table 1.
Alcohol use disorder and associated mortality in Denmark, Finland and Sweden from 1987 to 2006
| Study period | Denmark |
Finland |
Sweden |
|||||||||
|---|---|---|---|---|---|---|---|---|---|---|---|---|
| 1987–1991 | 1992–1996 | 1997–2001 | 2002–2006 | 1987–1991 | 1992–1996 | 1997–2001 | 2002–2006 | 1987–1991 | 1992–1996 | 1997–2001 | 2002–2006 | |
| Men | ||||||||||||
| People with AUD | ||||||||||||
| No. of people | 32 368 | 29 818 | 31 646 | 39 163 | 27 845 | 32 232 | 41 748 | 40 489 | 51 411 | 49 097 | 43 715 | 46 840 |
| No. of deaths | 4866 | 5042 | 5041 | 6997 | 3229 | 3465 | 5355 | 5458 | 7338 | 6705 | 5497 | 6313 |
| Person-years | 84 192 | 76 142 | 75 011 | 93 981 | 63 452 | 67 223 | 95 952 | 90 994 | 143 990 | 134 416 | 114 017 | 119 116 |
| Mortality per 100 000 person-years | 5780 | 6622 | 6720 | 7445 | 5082 | 5154 | 5581 | 5998 | 5096 | 4988 | 4821 | 5300 |
| Standardized mortality per 100 000 person-years | 7591 | 8142 | 7838 | 7720 | 6327 | 6476 | 6196 | 6067 | 5855 | 5459 | 5245 | 5119 |
| General population | ||||||||||||
| Standardized mortality per 100 000 person-years | 1888 | 1867 | 1704 | 1576 | 1977 | 2011 | 2045 | 2009 | 1660 | 1524 | 1413 | 1294 |
| Women | ||||||||||||
| People with AUD | ||||||||||||
| No. of people | 13 542 | 13 168 | 14 188 | 17 658 | 5428 | 7446 | 12 235 | 12 999 | 14 366 | 14 978 | 16 939 | 19 926 |
| No. of deaths | 1673 | 1827 | 1804 | 2579 | 435 | 523 | 976 | 1128 | 1305 | 1331 | 1327 | 1585 |
| Person-years | 36 070 | 33 464 | 35 090 | 43 735 | 12 098 | 14 844 | 28 136 | 29 502 | 39 488 | 39 879 | 43 150 | 49 649 |
| Mortality per 100 000 person-years | 4638 | 5460 | 5141 | 5897 | 3596 | 3523 | 3469 | 3824 | 3305 | 3338 | 3075 | 3192 |
| Standardized mortality per 100 000 person-years | 5379 | 5764 | 5249 | 5746 | 4614 | 4381 | 4152 | 4134 | 4352 | 4040 | 3788 | 3779 |
| General population | ||||||||||||
| Standardized mortality per 100 000 person-years | 1223 | 1242 | 1164 | 1097 | 1162 | 1197 | 1190 | 1142 | 1046 | 979 | 934 | 891 |
AUD, alcohol use disorder.
Mortality was higher in Denmark than Finland or Sweden (Table 1, Figs 1 and 2). Standardized mortality per 100 000 increased during the entire study period in men and women with AUD in Denmark (Table 1). In Finland and Sweden, the standardized mortality per 100 000 decreased in men and women with AUD during the entire study period (Table 1).
Fig 1.
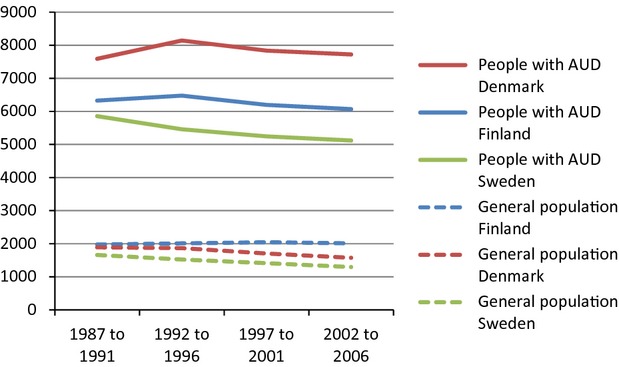
Alcohol Use Disorder (AUD) and associated mortality in Denmark, Finland and Sweden from 1987 to 2006. Standardized mortality per 100 000 person-years. Men.
Fig 2.
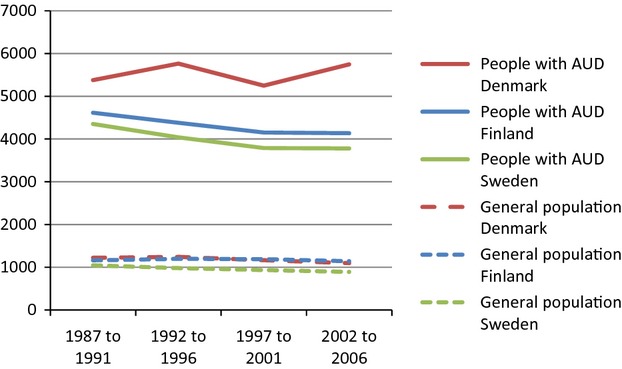
Alcohol use disorder (AUD) and associated mortality in Denmark, Finland and Sweden from 1987 to 2006. Standardized mortality per 100 000 person-years. Women.
Life expectancy
Life expectancy in people with AUD was lowest in Denmark and highest in Sweden (Table 2, Figs 3 and 4). In all three countries, life expectancy was longer for women than men, both for people with AUD and the general population (Table 2). In men and women in Denmark, life expectancy for people with AUD and the general population increased during the entire study, and the difference in life expectancy between people with AUD and the general population increased more for men than women (Table 2). In Finland, life expectancy for people with AUD increased more for women than men, and the difference in life expectancy between people with AUD and the general population increased for men but decreased for women during the entire study (Table 2). In Sweden, life expectancy for people with AUD and the general population increased in men and women, and the difference in life expectancy between people with AUD and the general population increased in men but decreased in women during the entire study (Table 2).
Table 2.
Life expectancy of people with alcohol use disorder and people in the general population in Denmark, Finland and Sweden from 1987 to 2006
| Life expectancy (years) | Denmark |
Finland |
Sweden |
|||||||||
|---|---|---|---|---|---|---|---|---|---|---|---|---|
| Study period | 1987–1991 | 1992–1996 | 1997–2001 | 2002–2006 | 1987–1991 | 1992–1996 | 1997–2001 | 2002–2006 | 1987–1991 | 1992–1996 | 1997–2001 | 2002–2006 |
| Men | ||||||||||||
| People with AUD | 46.6 | 46.1 | 46.7 | 47.5 | 46.8 | 46.4 | 46.8 | 48.3 | 50.3 | 51.4 | 52.1 | 52.7 |
| General population | 72.3 | 72.8 | 74.0 | 75.0 | 71.7 | 73.1 | 74.5 | 75.8 | 75.0 | 76.2 | 77.3 | 78.4 |
| Difference† | 25.7 | 26.7 | 27.3 | 27.5 | 24.9 | 26.7 | 27.7 | 27.5 | 24.7 | 24.8 | 25.2 | 25.7 |
| Women | ||||||||||||
| People with AUD | 49.8 | 49.5 | 51.4 | 51.2 | 52.7 | 52.4 | 54.3 | 56.4 | 54.8 | 56.5 | 57.7 | 58.6 |
| General population | 77.9 | 77.9 | 78.7 | 79.6 | 79.7 | 80.7 | 81.7 | 82.6 | 80.7 | 81.4 | 82.1 | 82.7 |
| Difference† | 28.1 | 28.4 | 27.3 | 28.4 | 27.0 | 28.3 | 27.4 | 26.2 | 25.9 | 24.9 | 24.4 | 24.1 |
AUD, alcohol use disorder.
Difference: life expectancy in general population minus life expectancy in people with AUD.
Fig 3.
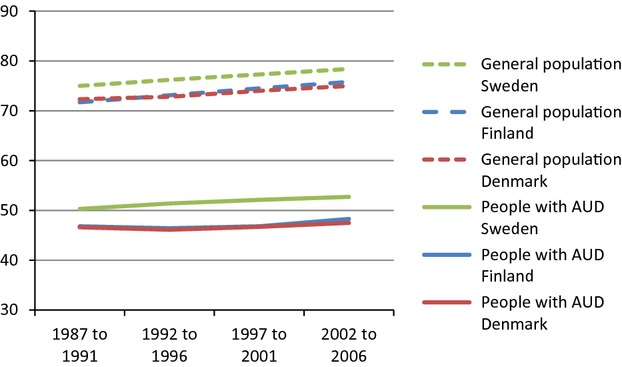
Life expectancy of people with alcohol use disorder (AUD) and people in the general population in Denmark, Finland and Sweden from 1987 to 2006. Men.
Fig 4.
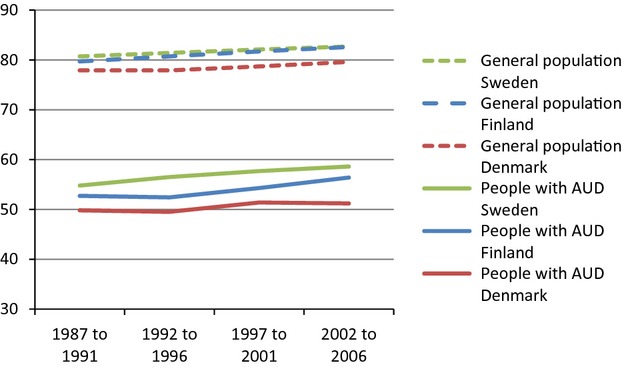
Life expectancy of people with alcohol use disorder (AUD) and people in the general population in Denmark, Finland and Sweden from 1987 to 2006. Women.
Age
In all three countries, mortality rate ratios in people with AUD were higher in young age groups. In Denmark, mortality rate ratios increased during the entire study in men and women for most age groups, especially ages 30–59 years (Table 3). In Finland, mortality rate ratios increased during the entire study period in men and women aged 30–44 years. In Sweden, mortality rate ratios increased during the entire study period in men aged 30–74 years and women aged 45–74 years (Table 3).
Table 3.
Mortality rate ratio for people with alcohol use disorder compared with people in the general population in Denmark, Finland and Sweden from 1987 to 2006
| Mortality rate ratio* | Denmark |
Finland |
Sweden |
|||||||||
|---|---|---|---|---|---|---|---|---|---|---|---|---|
| Study period | 1987–1991 | 1992–1996 | 1997–2001 | 2002–2006 | 1987–1991 | 1992–1996 | 1997–2001 | 2002–2006 | 1987–1991 | 1992–1996 | 1997–2001 | 2002–2006 |
| Men | ||||||||||||
| Age (years) | ||||||||||||
| 15–29 | 9.5 | 9.1 | 8.7 | 7.5 | 15.1 | 21.7 | 18.8 | 16.8 | 9.6 | 11.5 | 9.2 | 10.3 |
| 30–44 | 14.2 | 16.4 | 19.6 | 19.3 | 12.7 | 13.5 | 17.6 | 20.7 | 14.7 | 15.5 | 18.5 | 18.7 |
| 45–59 | 8.8 | 11 | 11.6 | 13.1 | 6.9 | 7.0 | 6.6 | 6.7 | 8.4 | 9.4 | 10.3 | 11.4 |
| 60–74 | 5.0 | 5.3 | 5.8 | 6.3 | 3.1 | 3.3 | 3.3 | 3.6 | 4.2 | 4.3 | 4.6 | 5.3 |
| ≥75 | 2.0 | 2.2 | 2.2 | 2.4 | 1.5 | 1.8 | 1.3 | 1.3 | 2.0 | 2.0 | 2.0 | 2.1 |
| Cause of death | ||||||||||||
| All causes | 4.0 | 4.4 | 4.6 | 4.9 | 3.2 | 3.2 | 3.0 | 3.0 | 3.5 | 3.6 | 3.7 | 4.0 |
| All diseases and medical conditions† | 3.7 | 4.0 | 4.2 | 4.6 | 2.3 | 2.3 | 2.3 | 2.3 | 3.1 | 3.1 | 3.2 | 3.4 |
| Suicide | 11.3 | 11.6 | 13.2 | 10.7 | 12.0 | 13.3 | 12.9 | 12.3 | 9.7 | 9.3 | 12.6 | 12.3 |
| Other external causes‡ | 8.6 | 9.3 | 9.5 | 11.5 | 12.3 | 13.5 | 10.0 | 11.0 | 10.2 | 11.4 | 11.0 | 12.0 |
| Women | ||||||||||||
| Age (years) | ||||||||||||
| 15–29 | 19.2 | 11.0 | 7.8 | 11.7 | 32.4 | 41.4 | 37.0 | 26.3 | 18.2 | 16.7 | 12.4 | 12.3 |
| 30–44 | 21.7 | 24.3 | 24.7 | 28.4 | 23.9 | 25.9 | 26.1 | 30.9 | 19.5 | 18.6 | 19.7 | 19.2 |
| 45–59 | 10.2 | 13.0 | 13.3 | 15.6 | 13.9 | 12.9 | 10.1 | 10.7 | 10.8 | 11.8 | 12.3 | 11.9 |
| 60–74 | 5.6 | 6.1 | 5.8 | 6.9 | 4.9 | 4.7 | 5.5 | 6.4 | 5.9 | 6.3 | 6.5 | 7.4 |
| ≥75 | 2.0 | 1.9 | 1.9 | 2.4 | 1.5 | 1.5 | 1.5 | 1.4 | 2.2 | 2.1 | 2.0 | 2.1 |
| Cause of death | ||||||||||||
| All causes | 4.4 | 4.6 | 4.5 | 5.2 | 4.0 | 3.7 | 3.5 | 3.6 | 4.2 | 4.1 | 4.1 | 4.2 |
| All diseases and medical conditions† | 3.7 | 4.1 | 4.0 | 4.8 | 3.0 | 2.6 | 2.6 | 2.8 | 3.6 | 3.6 | 3.5 | 3.6 |
| Suicide | 21.4 | 22.4 | 20.4 | 24.9 | 22 | 35.5 | 35.9 | 27.3 | 15.9 | 23.5 | 26.8 | 28.5 |
| Other external causes‡ | 13.5 | 13.4 | 13.1 | 15.0 | 23.8 | 20.2 | 16.9 | 16.3 | 17.2 | 15.1 | 15.5 | 15.6 |
Mortality rate ratio: Standardized mortality rate in people with AUD divided by standardized mortality rate in general population.
Excludes suicides and other external causes.
Other external causes exclude suicides.
Cause of death
In all three countries, people with AUD had higher mortality from all causes of death (Figs 5 and 6), all diseases and medical conditions, and suicide, than people in the general population (Table 3). In Denmark, mortality rate ratios in people with AUD increased from 1987 to 2006 from all diseases and medical conditions; mortality rate ratio from suicide was increased only in women during 2002 to 2006 (Table 3). In Finland, mortality rate ratios from all causes of death decreased during the entire study in both men and women; mortality rate ratios from all diseases and medical conditions were unchanged during the entire study for men and women, and mortality rate ratios from suicide increased in women but not men (Table 3). In Sweden, mortality rate ratios from all causes of death increased in men but was unchanged in women during the entire study; mortality rate ratio from suicide increased in both men and women (Table 3).
Fig 5.
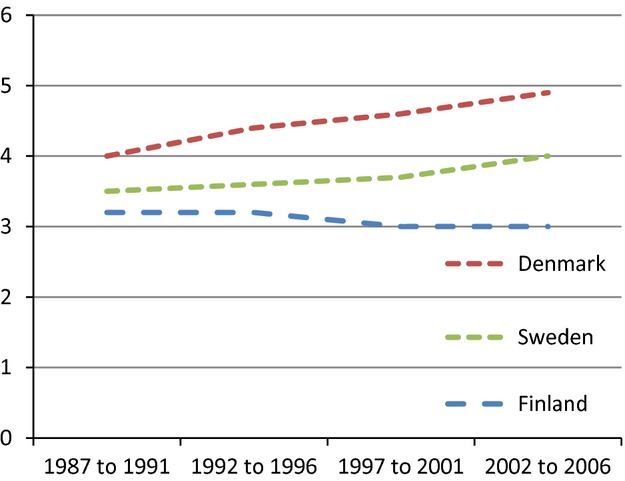
Mortality rate ratio for people with alcohol use disorder compared with people in the general population in Denmark, Finland and Sweden from 1987 to 2006. Men.
Fig 6.
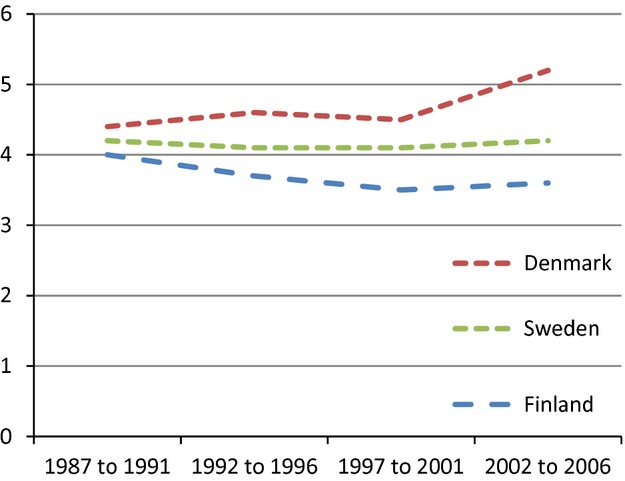
Mortality rate ratio for people with alcohol use disorder compared with people in the general population in Denmark, Finland and Sweden from 1987 to 2006. Women.
Alcohol consumption
During the entire study, registered alcohol consumption per capita was highest in Denmark and lowest in Sweden (Fig.7). In Denmark, registered alcohol consumption per capita decreased slightly after the year 2002. In Finland, registered alcohol consumption per capita peaked in the time period 2002–2006 in connection with an alcohol tax reduction. In Sweden, registered alcohol consumption per capita decreased slightly in the 90s and increased thereafter.
Fig 7.
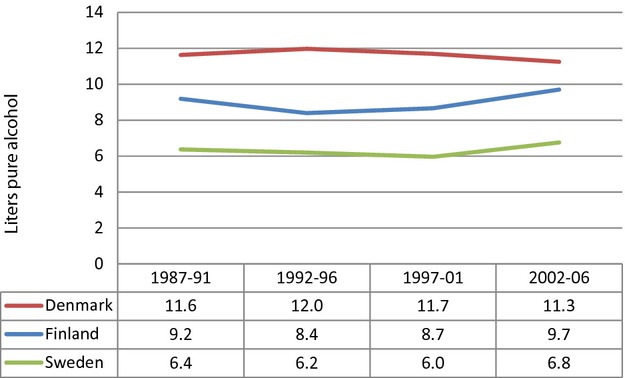
Registered total alcohol consumption in litres pure alcohol per capita in Denmark, Finland and Sweden from 1987 to 2006.
Discussion
Main findings
In this study, our main finding was a 24- to 28-year shorter life expectancy in people with AUD compared with the general population. Mortality associated with AUD was sex-dependent; men with AUD in all three countries had over time an increased difference in life expectancy, but women with AUD in Finland and Sweden (not Denmark) had a decreased difference in life expectancy. The changes in mortality and life expectancy during the study were most negative in Denmark and least negative in Sweden.
Strengths and limitations
A major strength of this study was the comparison of life expectancy and mortality in all people who had AUD diagnosed in three Nordic countries with different alcohol policies and patterns of alcohol consumption. The availability of nationwide health registers enabled us to follow the entire study population. The large population size (all people treated for AUD from three countries) provided highly reliable data. Much time and effort was invested in quality assurance of statistical analytical techniques, which made the data comparable between the different countries.
A major limitation of this study was the inclusion of patients from inpatient care only, which may have caused selection bias towards AUD patients with the most severe health problems. Patients with AUD who had only outpatient care were not included. The study was register-based and lacked clinical data about the type of treatment and adherence. In addition to disease prevalence in the population, patterns of hospitalization data including clinical diagnoses may be affected by other factors that were not analysed, such as changes in the number of hospital beds available, changes in hospital remuneration policies, and differences in clinical indications for hospital treatment. A common shortcoming in register studies is that they rarely can provide satisfactory answers on why the mortality is high or whether its decrease is due to policy changes, improved care or merely administrative decisions (15), although they can hint at the answer and provide directions (15, 16).
Another study limitation was that alcohol consumption per capita was determined from aggregate data and not from alcohol exposure for individuals. However, the World Health Organization data used in this study were supported by similar results from population surveys in Denmark, Finland and Sweden (17–19). In the aggregate data, neither age- nor sex-specific alcohol consumption data were available. The results based on aggregated data were exploratory and may not be used to draw definitive causative conclusions. In addition, data about illegal alcohol production and individual cross-border import were not included in the national statistics (6) and could not be evaluated in this study.
Life expectancy and mortality
The difference in life expectancy between people with AUD and the general population during the study increased in men in all three countries, decreased in women in Finland and Sweden, and was unchanged in women in Denmark (Table 2). However, the number of women hospitalized because of AUD increased during the study in all three countries (Table 1), consistent with documented increase in alcohol consumption in women (13). In addition, there has been a decrease in the perceived stigma associated with seeking treatment for AUD (20, 21). Therefore, diagnosis and treatment of AUD may be more common in women currently than 20 years ago. Nevertheless, only 1 in 3 people with AUD seek treatment (21).
This study showed that people with AUD had a four-fold greater risk of premature death than people in the general population, and people with AUD died on average 24–28 years earlier than people in the general population. Previous studies showed the mortality risk to be two- to six-fold greater in people with AUD (4, 22). In this study, people with AUD had a greater risk of death from all diseases and medical conditions, suicide, and other external causes of death, than people in the general population, consistent with findings from previous studies (2–4, 22, 23).
In men, the difference in mortality between patients with AUD and the general population increased more in Denmark and Finland than Sweden. These differences may be associated with the overall level of alcohol consumption, which is highest in Denmark and lowest in Sweden. The difference in mortality between people with AUD and the general population was smaller for both men and women in all study periods in Sweden than Denmark or Finland (Table 2). The number of deaths among women increased in all three countries during the study period, due to increasing numbers of women diagnosed with AUD in all countries, although standard morality ratios did not increase. The alcohol control policies of the countries are associated with total alcohol consumption; Sweden had the most restrictive, and Denmark had the least restrictive alcohol policies. Other studies have shown that the negative effects of the increased availability of alcohol in Finland mainly occurred in people with AUD (24–27). For example, in Finland, deaths from liver disease increased by 30% and alcohol-related sudden deaths increased by 17% after changes in alcohol regulations in 2004 (27–29).
Clinical implications
Findings from the present study show that AUD in the Nordic countries is associated with substantially increased mortality, even though alcohol control policies are restrictive compared with other countries. What might be important to add to the general restrictive alcohol policies would be selective efforts aimed at high alcohol consumers, to achieve preventive effects in terms of reducing the rate of high consumers converting to AUD. In this field, a wider focus is necessary including testing new preventive efforts, with the aim of reducing alcohol-related harm in people with AUD. In addition the somatic care of people with AUD should be substantially improved.
In summary, the present study of the entire populations of Denmark, Finland and Sweden showed that people hospitalized with AUD had an average life expectancy of 47–53 years for men and 50–58 years for women. People hospitalized with AUD had a 24- to 28-year shorter life expectancy than the general population. During the study, the difference in life expectancy between people with AUD and the general population increased in men but not in women. Mortality and life expectancy were associated with total alcohol consumption in the three countries. Furthermore, the comprehensive population data confirmed that AUD is a major public health problem that causes many years of lost life, also in countries with restrictive alcohol consumption policies.
Acknowledgments
This study was supported by a grant (no. 2008-0885) from the Swedish Council for Social and Working Life Research and a project grant (no. 20 120 263) from Stockholm County Council. The sponsors had no role in the design, conduct or reporting of the research. The statistical analyses were performed by TML, JH, MA at their institutions. The protocol can be obtained from jeanette.westman@ki.se.
Declarations of interest
Jeanette Westman, Kristian Wahlbeck, Thomas Munk Laursen, Mika Gissler, Merete Nordentoft, Jonas Hällgren, Martti Arffman, and Urban Ösby have no connections (direct or indirect) with the alcohol or pharmaceutical industries.
References
- 1.World Health Organization. 2011. Alcohol fact sheet. February; Available from http://www.who.int/mediacentre/factsheets/fs349/en/index.html. Accessed October 4, 2013.
- 2.Hiroeh U, Kapur N, Webb R, Dunn G, Mortensen PB, Appleby L. Deaths from natural causes in people with mental illness: a cohort study. J Psychosom Res. 2008;64:275–283. doi: 10.1016/j.jpsychores.2007.09.008. [DOI] [PubMed] [Google Scholar]
- 3.Hiroeh U, Appleby L, Mortensen PB, Dunn G. Death by homicide, suicide, and other unnatural causes in people with mental illness: a population-based study. Lancet. 2001;358:2110–2112. doi: 10.1016/S0140-6736(01)07216-6. [DOI] [PubMed] [Google Scholar]
- 4.Roerecke M, Rehm J. Alcohol use disorders and mortality: a systematic review and meta-analysis. Addiction. 2013;108:1562–1578. doi: 10.1111/add.12231. [DOI] [PubMed] [Google Scholar]
- 5.Lhachimi SK, Cole KJ, Nusselder WJ, et al. Health impacts of increasing alcohol prices in the European Union: a dynamic projection. Prev Med. 2012;55:237–243. doi: 10.1016/j.ypmed.2012.06.006. [DOI] [PubMed] [Google Scholar]
- 6.World Health Organization. European Health for All Database (HFA-DB). Updated July 2013; Available from http://www.euro.who.int/en/data-and-evidence/databases/european-health-for-all-database-hfa-db. Accessed October 4, 2013.
- 7.Bruun K, Edwards G, Lumio M, et al. Alcohol control policies in public health perspective. New Brunswick, NJ; Helsinki: The Finnish Foundation for Alcohol Studies; Rutgers University Center of Alcohol Studies; 1975. [Google Scholar]
- 8.Sutton C. Swedish alcohol discourse. Constructions of a social problem. Uppsala: Uppsala University; 1998. [Google Scholar]
- 9.Österberg E, Karlsson T. Alcohol policies in EU Member States and Norway. A collection of country reports. Helsinki: Stakes; 2002. [Google Scholar]
- 10.World Health Organization. International classification of diseases. 8th edn. Geneva: World Health Organization; 1968. (ICD-8) [Google Scholar]
- 11.World Health Organization. International classification of diseases. 9th edn. Geneva: World Health Organization; 1987. (ICD-9) [Google Scholar]
- 12.World Health Organization. International classification of diseases. 10th edn. Geneva: World Health Organization; 1992. (ICD-10) [Google Scholar]
- 13.NOMESCO. 2009. Health Statistics in the Nordic Countries. Copenhagen; Available from: http://nowbase.org/. Accessed October 4, 2013.
- 14.Verschuuren M, Gissler M, Kilpeläinen K, et al. Public health indicators for the EU: the joint action for ECHIM (European Community Health Indicators & Monitoring) Arch Public Health. 2013;71:12. doi: 10.1186/0778-7367-71-12. [DOI] [PMC free article] [PubMed] [Google Scholar]
- 15.Munk-Jørgensen P, Okkels N, Golberg D, Ruggeri M, Thornicroft G. Fifty years' development and future perspectives of psychiatric register research. Acta Psychiatr Scand. 2014;130:87–98. doi: 10.1111/acps.12281. [DOI] [PubMed] [Google Scholar]
- 16.Allebeck P. The use of population based registers in psychiatric research. Acta Psychiatr Scand. 2009;120:386–391. doi: 10.1111/j.1600-0447.2009.01474.x. [DOI] [PubMed] [Google Scholar]
- 17.Ramstedt M. Change and stability? Trends in alcohol consumption, harms and policy: Sweden 1990–2010. Nord Stud Alcohol Drugs. 2010;27:409–423. [Google Scholar]
- 18.Bjørk C, Vinther-Larsen M, Thygesen LC, Johansen D, Grønbaek MN. Alcohol consumption by middle-aged and elderly Danes from 1987 to 2003 [in Danish] Ugeskr Laeger. 2006;168:3317–3321. [PubMed] [Google Scholar]
- 19.Mäkelä P, Tigerstedt C, Mustonen H. The Finnish drinking culture: change and continuity in the past 40 years. Drug Alcohol Rev. 2012;31:831–840. doi: 10.1111/j.1465-3362.2012.00479.x. [DOI] [PubMed] [Google Scholar]
- 20.Pescosolido BA, Martin JK, Long JS, Medina TR, Phelan JC, Link BG. “A disease like any other”? A decade of change in public reactions to schizophrenia, depression, and alcohol dependence. Am J Psychiatry. 2010;167:1321–1330. doi: 10.1176/appi.ajp.2010.09121743. [DOI] [PMC free article] [PubMed] [Google Scholar]
- 21.Cunningham JA, Breslin FC. Only one in three people with alcohol abuse or dependence ever seek treatment. Addict Behav. 2004;29:221–223. doi: 10.1016/s0306-4603(03)00077-7. [DOI] [PubMed] [Google Scholar]
- 22.Harris EC, Barraclough B. Excess mortality of mental disorder. Br J Psychiatry. 1998;173:11–53. doi: 10.1192/bjp.173.1.11. [DOI] [PubMed] [Google Scholar]
- 23.Nordentoft M, Wahlbeck K, Hällgren J, et al. Excess mortality, causes of death and life expectancy in 270,770 patients with recent onset of mental disorders in Denmark, Finland and Sweden. PLoS One. 2013;8:e55176. doi: 10.1371/journal.pone.0055176. [DOI] [PMC free article] [PubMed] [Google Scholar]
- 24.Herttua K, Mäkelä P, Martikainen P. Changes in alcohol-related mortality and its socioeconomic differences after a large reduction in alcohol prices: a natural experiment based on register data. Am J Epidemiol. 2008;168:1110–1118. doi: 10.1093/aje/kwn216. [DOI] [PMC free article] [PubMed] [Google Scholar]
- 25.Herttua K, Mäkelä P, Martikainen P. An evaluation of the impact of a large reduction in alcohol prices on alcohol-related and all-cause mortality: time series analysis of a population-based natural experiment. Int J Epidemiol. 2011;40:441–454. doi: 10.1093/ije/dyp336. [DOI] [PMC free article] [PubMed] [Google Scholar]
- 26.Mäkelä P, Paljärvi T. Do consequences of a given pattern of drinking vary by socioeconomic status? A mortality and hospitalisation follow-up for alcohol-related causes of the Finnish Drinking Habits Surveys. J Epidemiol Community Health. 2008;62:728–733. doi: 10.1136/jech.2007.065672. [DOI] [PubMed] [Google Scholar]
- 27.Bloomfield K, Wicki M, Gustafsson NK, Mäkelä P, Room R. Changes in alcohol-related problems after alcohol policy changes in Denmark, Finland, and Sweden. J Stud Alcohol Drugs. 2010;71:32–40. doi: 10.15288/jsad.2010.71.32. [DOI] [PMC free article] [PubMed] [Google Scholar]
- 28.Koski A, Sirén R, Vuori E, Poikolainen K. Alcohol tax cuts and increase in alcohol-positive sudden deaths: a time-series intervention analysis. Addiction. 2007;102:362–368. doi: 10.1111/j.1360-0443.2006.01715.x. [DOI] [PubMed] [Google Scholar]
- 29.STAKES. Yearbook of alcohol and drug statistics 2006. Helsinki, Finland: STAKES; 2006. [Google Scholar]