Fig. 3.
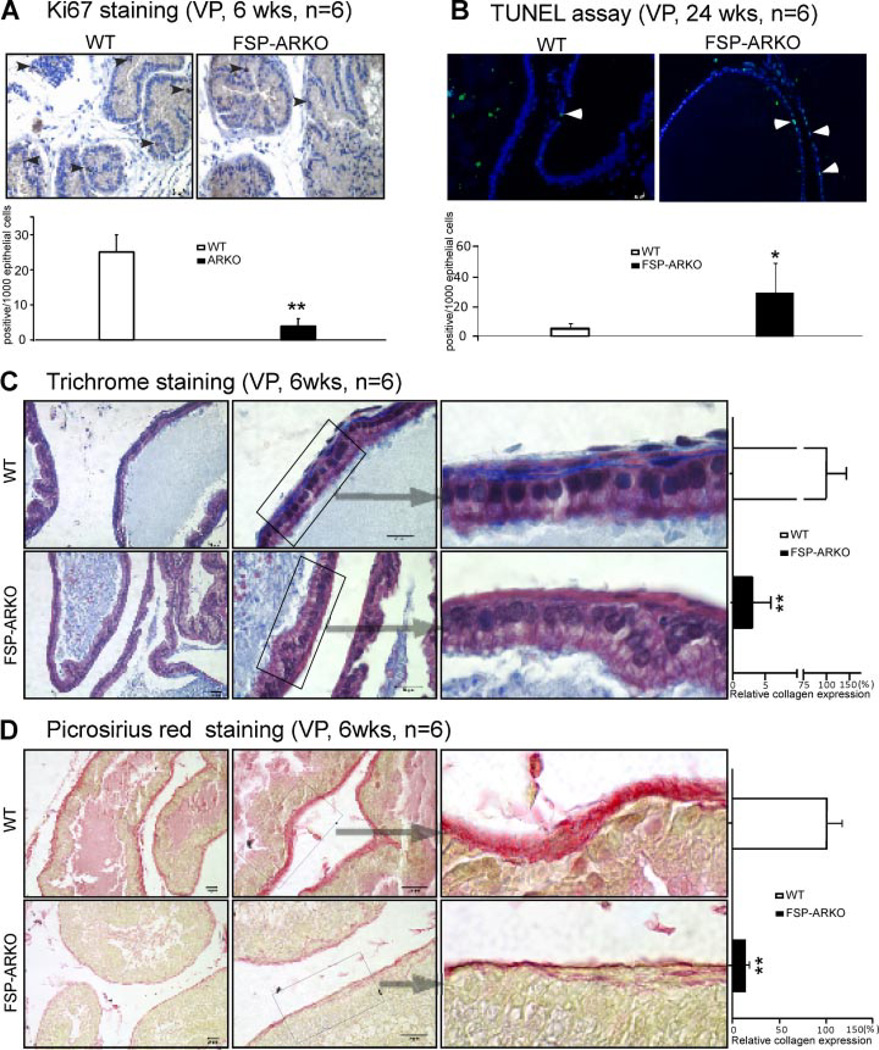
Alterations of proliferation, apoptosis, and collagen deposition in ventral prostates of FSP-ARKO mice. A: Ki67 IHC staining showed reduced proliferation rate in the prostate of FSP-ARKO mice as early as 6-weeks-old (arrowheads show positive Ki67 cells).Quantitative Ki67 signal was shown as the bar graph (Ki67 positive cells/1,000 epithelial cells). (**P < 0.01 vs. WT littermates, n = 6). B: TUNEL assay showed increased apoptosis signals (green) in the prostate of FSP-ARKO mice at 24 weeks. (Arrowheads show positive apoptosis signals) The DAPI staining (blue) was used to indicate the location of nuclei. Quantitatived at a were shown as the bar graph (positive apoptotic cells/1,000 epithelial cells). (*P < 0.05 vs. WT littermates, n = 6). C: Trichrome staining results suggested the reduced collagen surrounding the prostate ducts. Masson’s trichrome staining of ventral prostate of FSP-ARKO mice (lower) and WT littermates (upper) at 6-weeks-old: The collagen (blue areas) in extracellular matrix (ECM) surrounding the ventral prostate epithelial acini decreased dramatically in the FSP-ARKO mice compared to WT littermates. The relative expression level of the collagen in WT mice was 100.00 ± 43.04%, but in FSP-ARKO mice it was only 3.05 ± 2.82% (**P < 0.01vs. WT littermates, n = 6. Scale bar = 20 µm). D: Picrosirius Red staining showed the reduced collagen (red color) surrounding the prostate ducts at 6-weeks-old FSP-ARKO mice (lower). The quantitative data was shown on the right lane: The relative expression level of the collagen in WT mice was 100.00 ± 16.46%, but in FSP-ARKO mice, it was only 13.64 × 3.21% (**P < 0.01 vs. WT littermates, n = 6, Scale bar = 20 µm).

