

Abstract
Objectives
The purpose of this study was to compare the validity of Actigraph 2-regression models (2RM) and 1-regression models (1RM) for estimation of EE in children.
Design
The study used a cross-sectional design with criterion estimates from a metabolic cart
Methods
A total of 59 children (7–13yrs) performed 12 activities (randomly selected from a set of 24 activities) for 5min each, while being concurrently measured with an Actigraph GT3X and indirect calorimetry. METRMR (MET considering one's resting metabolic rate) for the GT3X was estimated applying 2RM with vector magnitude (VM2RM) and vertical axis (VA2RM), and four standard 1RMs. The validity of the 2RMs and 1RMs was evaluated using 95% equivalence testing and mean absolute percent error (MAPE).
Results
For the group-level comparison, equivalence testing revealed that the 90% confidence intervals for all 2RMs and 1RMs were outside of the equivalence zone (range: 3.63, 4.43) for indirect calorimetry. When comparing the individual activities, VM2RM produced smaller MAPEs (range: 14.5 to 45.3%) than VA2RM (range, 15.5 to 58.1%) and 1RMs (range, 14.5 to 75.1%) for most of the light and moderate activities.
Conclusions
None of the 2RMs and 1RMs were equivalent to indirect calorimetry. The 2RMs showed smaller individual-level errors than the 1RMs.
Keywords: Public health, Physical fitness, Accelerometer, Children, Calibration, Validation Studies
Introduction
The Actigraph (Actigraph, Pensacola, FL) is the most widely used activity monitoring device but there is still debate about the most appropriate way to reduce and process the data.1 A particularly challenging issue is to convert accelerometer counts into more useable units (a process typically referred to as calibration). Calibration equations are typically developed using regression analyses that link counts with corresponding energy expenditure (EE) values (metabolic equivalents: METs) measured from a criterion measure.2 Four independent calibration studies3-6 have proposed equations to estimate children's EE but cross-validation studies7, 8 have not supported their accuracy for assessing free living physical activity behavior.
The inherent limitation of these standard single regression models (referred to as 1RM hereafter) is that they are specific for the activities used in the calibration.9 Previous research by Crouter et al.10, 11 demonstrated the utility of a two-regression model (2RM) that allows for the use of separate regression equations for locomotive (i.e. running, walking) and non-locomotive activities. This enables separate predictions for these two distinct patterns. In subsequent independent validation studies, this method was shown to provide comparable EE values relative to doubly-labeled water12 and indirect calorimetry13 in adults. A set of 2RMs was developed to estimate EE in youth using the latest, tri-axial Actigraph GT3X model,14 but a subsequent cross-validation study7 yielded equivocal findings. This study7 reported significant underestimation of EE for the seven structured activities (performed for 5 min each) and considerable error across the more extended, free-living measurement session. The discrepant findings are difficult to reconcile considering the promising findings in adults13 and the favorable preliminary validation results.14 It is widely recommended that validity of accelerometry-based monitors should be examined using independent samples15, 16 and under various settings.2 The present study systematically evaluates the relative validity of two 2RM models compared to four different 1RM equations in an independent sample of youth.
Method
A total of 59 children between the ages of 7 and 13 volunteered to participate in the study. All of the participants and their parents signed an assent form and written informed consent, respectively, prior to participation. In Table 1, the demographic profiles of the participants were summarized. This study was approved by the Institutional Review Board at our institution.
Table 1. Physical characteristics of the participants (n=59).
| Variables | Values |
|---|---|
| Age (M ± SD, range) | 9.9 ± 1.8 yrs, 7-13 yrs |
| Gender | |
| Female (n=18) | 30.5% |
| Male (n=41) | 69.5% |
| Height (M ± SD) | 146.0 ± 12.9 cm |
| Weight (M ± SD) | 38.9 ± 13.8 kg |
| Body Mass Index (BMI) a | |
| Normal weight (n=51) | 79.7% |
| Overweight (n=6) | 13.6% |
| Obese (n=3) | 6.8% |
| Race | |
| Caucasian (n=56) | 93.2% |
| Asian (n=2) | 3.4% |
| African American (n=1) | 1.7% |
| Hispanic (n=1) | 1.7% |
| Resting Metabolic Rate | |
| All (n=59) | 4.89 ml⋅kg-1·min-1 |
| Female (n=18) | 4.75 ml⋅kg-1·min-1 |
| Male (n=41) | 4.96 ml⋅kg-1·min-1 |
BMI; 5th – 85th percentile as normal Weight, 85th – 95th percentile as overweight, ≥95th as obese
Each participant performed 12 activities randomly selected from a set of 24 activities designed to mimic free-living activities in children. The 24 activities were classified into four distinct intensity categories according to MET-derived criteria based on criterion MET values from the OM. The criteria were METRMR≤2.0 for sedentary, 2.0< METRMR ≤3.9 for light, 4.0≤METRMR ≤5.9 for moderate, and 6.0≤METRMR for vigorous intensity. We used adjusted METRMR values of 2.0 and 4.0 for the sedentary and moderate intensity, respectively, instead of traditional METRMR values of 1.5 and 3.0. The higher threshold of 4 METS for MVPA8 is well established based on the established evidence for higher RMR values in youth (∼5.0ml·kg-1·min-1) for children compared with adults (∼3.5ml·kg-1·min-1).17 The lower threshold of 2 METS to define Sedentary behavior preserves the same 2:1 ratio between MVPA and Sedentary in adults (i.e. 3.0 METS: 1.5 METS). Recent findings from our lab (manuscript in review) have supported the high classification accuracy of the 2.0 and 4.0 METRMR for classifying sedentary and moderate intensity in children.
The activities were completed in random order and in a semi-structured manner to capture natural variation in physical activity. The characteristics of the included activities by intensity along with corresponding means and standard deviations are presented (see Supplementary Table 1). Each activity was performed for 5 min, with a 1-min resting period between them. Participants wore an Actigraph GT3X for measurement of physical activity and were fitted with a portable metabolic analyzer (i.e. Oxycon Mobile (OM); CareFusion Corp, San Diego, CA) for measurement of pulmonary ventilation and gas exchange (for determination of oxygen uptake). The funding organization (i.e. National Institutes of Health) did not play any role in collecting data (including the analyses and interpretation) and in approving or disapproving the publication of this study.
The Actigraph GT3X is a compact (3.8×3.7×1.8cm) and lightweight (27g) tri-axial accelerometer that records acceleration ranging from 0.05g to 2.00g. The Actigraph GT3X was initialized at 30Hz and placed on the right hip at the level of iliac crest. Data were downloaded at 1s epoch and then reintegrated into 10s epochs and 60s for analyses. The ActiLife software (firmware version 6.5.1) was used for data management.
The OM, the criterion measure for determination of EE, is a portable gas analyzer that measures breath-by-breath respiratory gas exchange under free-living conditions. Volume and gas calibration were performed before each trial following the manufacturer's recommendations. The OM has been shown to be valid and reliable.18, 19
The Actigraph data were processed using 2 different 2RM approaches,14 one developed with vertical axis data (VA2RM) and one developed using vector magnitude data (VM2RM). The Actigraph data were also processed for the 1RM equations developed by Freedson/Trost et al. (FT1RM),3 Trost et al. (TR1RM),6 Puyau et al. (PU1RM),4 and Treuth et al. (TH1RM)5 to provide comparisons with previous results (see Supplementary Table 2). To ensure effective comparisons, all data were presented using equivalent outcome units of METRMR. METRMR is a MET value that incorporates one's resting metabolic rate (RMR). In this study, the Schofield equation20 was used to predict RMR of the children, which is the same methodology used in previous validation studies.21, 22, 8, 23 The specific METRMR value was calculated by dividing the measured activity VO2 value (i.e. ml·kg-1·min-1) by the predicted (Schofield20) RMR value (i.e. ml·kg-1·min-1).
The 2RM method by Crouter et al.14 predicts EE in METRMR. However, FT1RM and TH1RM yield MET3.5, which is a MET value based on a resting metabolic rate of 3.5ml·kg-1·min-1. Therefore, METRMR values for the FT1RM and TH1RM were obtained by first multiplying MET values predicted from the equations by 3.5ml·kg-1·min-1, then dividing by a RMR estimated using the Schofield equation.20 The TR1RM and PU1RM provide estimates of EE in Kcal·min-1 and Kcal·kg·min-1, respectively. Therefore, different conversions were needed to compute METRMR. An established conversion factor (1 L O2 = 4.825 kcal) was used to convert EE estimates into estimates of oxygen consumption in ml·kg-1·min-1. This was then divided by the weight (kg) and the estimated RMR value for TR1RM, and by the estimated RMR value for PU1RM to compute METRMR.23 For the OM data, METRMR values were calculated by dividing VO2 values (ml·kg-1·min-1) of performed activities by the estimated RMR value.20
A statistical “equivalence test”24, 25 was used to examine measurement agreement between the Actigraph equations (i.e. 2RMs and 1RMs) and the OM. In traditional analytic approaches, the null hypothesis is that the two methods are equal. Failure to reject the null suggests “no evidence of a difference”; however, this does not necessarily imply that there is “evidence of equivalence”.26 With an equivalence test, the null hypothesis is flipped to specify a difference between two means, thereby allowing a direct test of equivalence. In the context of the present study, a 95% equivalence test (i.e. α=5%) would conclude that Actigraph EE models (i.e. 2RMs and 1RMs) and the OM are considered to be significantly equivalent to each other if a 90% of confidence interval (CI) for a mean of the Actigraph EE model fell into a proposed equivalence zone (i.e. ±10% of the mean) of the OM.
To evaluate overall agreement between the Actigraph EE models and OM across all the activities, the 90%CIs for means of each Actigraph EE model were estimated from a mixed model ANOVA in which participants are included as a random effect to account for potential correlation of measurements from the same participant. Whether or not the Actigraph measurement for each of the 24 activities was significantly equivalent to the corresponding OM measurement was tested using an equivalence test with an alpha-level of 5%. The null hypothesis of non-equivalence was rejected when the 90% confidence interval for the mean Actigraph EE measurement fell inside the equivalence zone, which we defined as ±10% of the mean for OM. The equivalence testing and Pearson correlation coefficient were used to examine group-level agreement.
To examine individual-level measurement errors, mean absolute percent errors (MAPE) and Bland Altman plots were used. MAPE was calculated by dividing an absolute difference between a regression model and the OM by the OM, multiplied by 100%. Bland-Altman plots with corresponding 95% limits of agreement and fitted lines (from regression analyses between mean and difference) with their corresponding parameters (i.e. intercept, slope) were presented. Perfect agreement between the Actigraph and OM would be identified with a fitted line that provides a slope of 0 and an intercept of 0.
Results
Overall, none of the regression models (i.e. VM2RM, VA2RM, FT1RM, TR1RM, PU1RM, TH1RM) were significantly equivalent to the OM for the group-level comparisons as none of the 90%CIs of the 6 regression models were completely included within the equivalence zone of the OM (lower bound: 3.63, upper bound: 4.43). (See Table 2) Correlations for the VM2RM (r=0.53) and VA2RM (r=0.58) with the OM were all significant (P<0.0001), and higher than for the FT1RM (r=0.37), TR1RM (r=0.30), PU1RM (r=0.37) and TH1RM (r=0.35). MAPEs for the VM2RM, VA2RM, FT1RM, TR1RM, PU1RM and TH1RM were 28.2%, 34.2%, 31.5%, 40.2%, 61.7% and 36.6%, respectively.
Table 2.
Overall measurement agreement between Actigraph regression models and Oxycon Mobile in energy expenditure measurement.
| Method | 90% CI of Regression Models | Equivalence zone of OM | Correlations | MAPE (%) | ||||||
|---|---|---|---|---|---|---|---|---|---|---|
|
| ||||||||||
| Type | M | SE | Lower bound | Upper bound | Lower bound | Upper bound | r | P-value | M | SD |
| Criterion measure | ||||||||||
| OMa | 4.03 | 0.06 | - | - | 3.63 | 4.43 | - | - | - | - |
| Regression Models | ||||||||||
| VM2RMb | 2.88 | 0.05 | 2.79 | 2.97 | - | - | 0.53 | <0.0001 | 28.2 | 9.3 |
| VA2RMc | 2.64 | 0.04 | 2.57 | 2.71 | - | - | 0.58 | <0.0001 | 34.2 | 7.2 |
| FT1RMd | 2.76 | 0.06 | 2.65 | 2.86 | - | - | 0.37 | 0.0040 | 31.5 | 11.0 |
| TR1RMe | 2.46 | 0.10 | 2.29 | 2.62 | - | - | 0.30 | 0.0221 | 40.2 | 15.5 |
| PU1RMf | 1.54 | 0.04 | 1.47 | 1.60 | - | - | 0.37 | 0.0036 | 61.7 | 7.2 |
| TH1RMg | 2.55 | 0.06 | 2.44 | 2.65 | - | - | 0.35 | 0.0068 | 36.6 | 11.3 |
Note: Values are METRMR (metabolic equivalents taking into account resting metabolic rate) unless otherwise noted.
Oxycon Mobile;
Vector magnitude 2 regression model;
Vertical axis 2 regression model;
Freedson/Trost 1 regression model;
Trost 1 regression model;
Puyau 1 regression model;
Treuth 1 regression model
Regarding the agreement between the 2RMs and the OM, both VM2RM and VA2RM yielded non-equivalent underestimations for all 48 possible activity-specific comparisons (i.e., 2 methods×24 activities) (See Figure 1.(a)). Of the 96 possible comparisons (i.e. 4 methods×24 activities) between the 1RMs and OM, none of them were significantly equivalent with one another, except for the two comparisons between the FT1RM (i.e. 90%CI: 4.22, 4.84) and the OM (i.e. equivalence zone: 3.97, 4.85) for brisk walking, and between the PU1RM (i.e. 90%CI: 4.91, 5.64) and the OM (i.e. equivalence zone: 4.88, 5.96) for dribbling a basketball.
Figure 1.
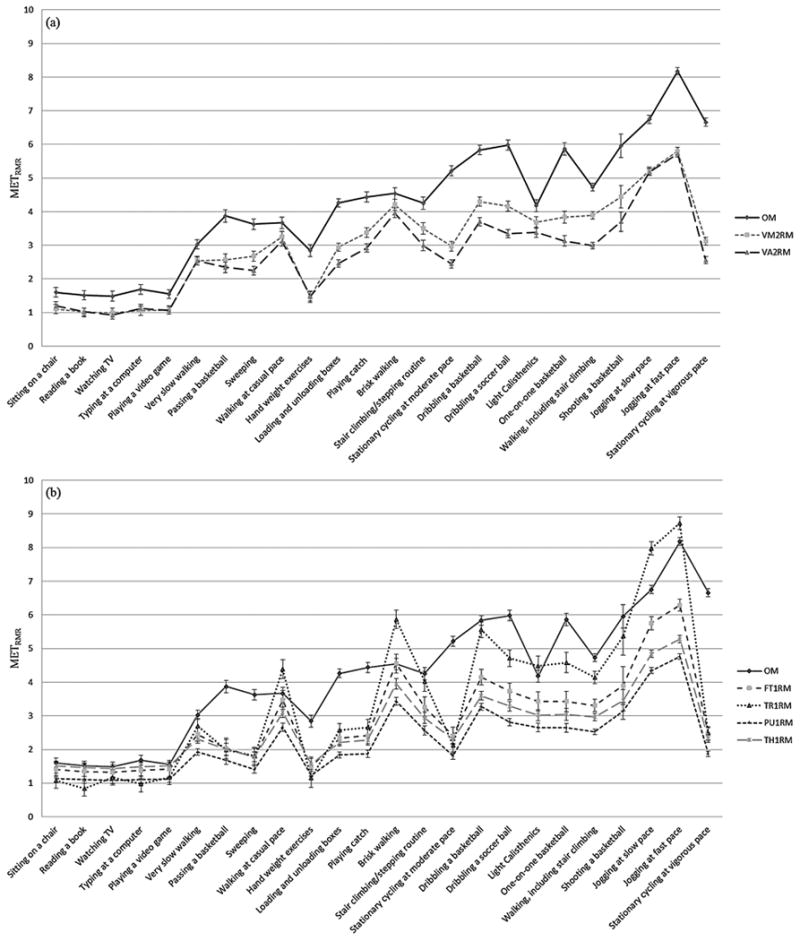
Means and standard errors of (a) two 2-regression models (VM2RM - Vector magnitude 2 regression model; VA2RM -Vertical axis 2 regression model) and (b) four 1-regression models (FT1RM - Freedson/Trost 1 regression model; TR1RM - Trost 1 regression model; PU1RM - Puyau 1 regression model; TH1RM - Treuth 1 regression model) and Oxycon Mobile for each activity type; Note - METRMR (metabolic equivalents taking into account resting metabolic rate).
The MAPE values for the 2RMs ranged from 32.5% to 39.4% for sedentary activities, from 14.5% to 42.9% for light intensity, from 15.0% to 58.1% for moderate intensity, and from 19.6% to 61.5% for vigorous intensity activities (See Supplementary Table 3). The MAPE values for the four 1RMs ranged from 17.3% to 67.2% for sedentary activities, from 14.5% to 70.3% for light intensity, from 17.3% to 75.1% for moderate intensity, and from 16.3% to 78.0% for vigorous intensity activities. The 2RMs, in particular VM2RM, produced relatively smaller (and/or comparable) MAPE values in comparison with (all or most of) the 1RMs for most of the 15 LPA (light physical activity) and MPA (moderate physical activity), the exception being “Hand weight exercises” compared with TH1RM.
The Bland-Altman plots showed that VM2RM (range of 95% limits of agreement = 1.68METRMR) (i.e., -1.99 to -0.31METRMR) and VA2RM (range: 1.50METRMR) showed relatively narrower ranges of 95% limits of agreement in comparison with FT1RM (range: 2.11METRMR), TR1RM (range: 3.05METRMR), PU1RM (range: 1.77METRMR), and TH1RM (range: 2.12METRMR). (See Supplementary Figure 1 and Supplementary Table 4) The slopes of the fitted line were not significant for VM2RM (P=0.286), FT1RM (P=0.655) and TH1RM (P=0.716). This implies that patterns of systematic bias were not significant in the VM2RM, FT1RM and TH1RM. However, significant patterns of systematic errors were found for VA2RM (P=0.001), TR1RM (P<0.001) and PU1RM (P=0.002).
Discussion
The present study examined the validity of two recently developed 2RMs and four standard 1RMs for physical activity EE estimation relative to the indirect calorimetry criterion measure in children. Overall, none of the six regression models were significantly equivalent to the criterion measure. All regression models provided considerably large underestimation of EE values measured by indirect calorimetry. Given that the 2RMs produced narrower ranges of 95% limits of agreement, less biased patterns of Bland-Altman plots and smaller MAPEs, the use of the 2RMs may result in less individual variation in measuring EE in comparison with the 1RMs.
We did not detect any particular pattern in the errors that may help to determine the underlying cause of the discrepancies. However, comparison of our results with prior related studies offers some insights into sources of error. To be specific, the findings on the validity of the 2RMs in children contrast with the original cross validation study14 but are consistent with the more recent independent validation study.7 In the original cross validation study of the 2RMs,14 the VM2RM and VA2RM yielded METRMR values comparable with indirect calorimetry (i.e. mean differences<0.8METRMR) for most of the performed activities. However, the favorable findings results may be attributable to the fact that the number, types, and duration of the activities performed were equivalent to those used to develop the VM2RM and VA2RM models. It should not be surprising to find good validity when a cross-validation study uses the exactly same general methodology that is used in a calibration study. The previous study14 also used relatively crude statistical methods (i.e. one-way ANOVA) to test for agreement, and had a relatively small sample size for the comparison group (n=39). In the current study, the 2RM method was evaluated in an independent, larger sample of children (n=59) and employed a more rigorous methodology (i.e. equivalence testing) than previous studies. A subsequent independent validation study by Crouter et al.7 evaluated the VM2RM and VA2RM using a more variable set of activities (i.e. 8 structured activities for 8 minutes each+1 free-living measurement session for approximately 2 hours) and a larger number of participants (i.e. 32 girls and 40 boys ages 11-15yrs) in comparison to their original calibration study.14 Consistent with the present study, that study7 demonstrated that the VM2RM and VA2RM underestimated EE measured with indirect calorimetry for the 8 structured activities (range of mean percent errors, 1.0%–23.1%) and free-living activity measurement (range of mean percent error, 26.3% and 27.2%, respectively). The convergent findings from the two independent validation studies (i.e. the current study and the study by Crouter et al.7), the 2RM method appears to underestimate EE values in children.
From a public health standpoint, it is important to establish procedures to more accurately estimate EE in youth. Because LPA and MPA are common outcome measures in contemporary physical activity research for youth,27 accurate calibration of EE equations is critical for accurately estimating EE in these two intensities. In this study, the resulting MAPE values for the 2RMs were comparable and/or relatively smaller in comparison with MAPEs for the 1RMs for the majority of the LPA and MPA. This suggests that the 2RMs may provide more accurate estimates of EE and/or activity time for LPA and MPA in comparison with the 1RMs. A similar result was reported by Crouter et al.7 who compared the VM2RM, VA2RM, and 5 standard 1RMs (i.e. by Freedson/Trost et al.,3 Treuth et al.,5 Trost et al.,6 Puyau et al.,4 and Evenson et al.28) against indirect calorimetry for estimating minutes spent during 4 categories of physical activity (i.e. sedentary, LPA, MPA, VPA). In the study by Crouter et al.,7 the VM2RM and VA2RM produced smaller ranges of 95% limits of agreement in comparison with the 5 1RMs in classifying LPA and MPA. This indicates that in measuring EE on LPA and MPA, the 2 RMs would have relatively smaller individual bias in comparison with the 1RMs. Another study conducted by Trost et al.8 evaluated activity classification accuracy of five 1RMs (Freedson/Trost et al.,3 Puyau et al.,4 Treuth et al.,5 Mattocks et al.,29 Evenson et al.28) using Receiver Operating Characteristic-area under the curve (ROC-AUC). In the Trost et al. study,8 all the five 1RMs demonstrated relatively low classification accuracy for LPA (ROC-AUC ranges from 0.43 to 0.70) and MPA (ROC-AUC ranges from 0.56 to 0.79) time in comparison to classification accuracy for sedentary (ROC-AUC ranges from 0.80 to 0.90) and VPA (ROC-AUC ranges from 0.54 to 0.84). This suggests that LPA and MPA are more difficult to evaluate using 1RM approaches. The present results do not directly support the 2RM approach but it is clear that it provides advantages over the traditional 1RM approach.
There are some key strengths of the present study. To our knowledge, this study is the first study to employ the novel method of equivalence testing in validation studies on physical activity measurement tools in children. Given that equivalence testing is intended to determine how closely one method equates to another method, it is a more appropriate analytic approach for this type of validation research. Another strength is that we included a wide variety of activities (i.e. a total of 24) designed to mimic the range of children's free-living activities.
However, the results of the current study still need to be interpreted with some caution. The current study used slightly different methodologies than that employed in the original 2RM development study.14 Most importantly, the activities of this study were performed in a random fashion whereas in the validation study,14 the 2RMs were developed and validated with activities being performed from the lowest to the highest intensity category. We view the random order of activities as an important design feature since it more directly captures free-living behavior. However, it is also possible that this fully randomized order could lead to overestimation of the “criterion” EE values for lower intensity activities if performed after more vigorous activities. Moreover, children's RMR was not measured, but estimated using the Schofield's equation.20 However, the Schofield's equation accurately estimated RMR values for pre-school children,30 and has been widely used in previous validation studies21, 22, 8, 23 to evaluate different sets of Actigraph EE equations for youth.
Conclusion
None of the two 2RMs and four 1RMs were significantly equivalent to the indirect calorimetry for both overall group comparisons and activity-specific comparisons (only except for 1 activity with the TH1RM). Relatively smaller individual variations were identified for the 2RMs in comparison with the 1RMs. In measuring estimates of EE for LPA and MPA, the 2RMs showed relatively smaller individual errors in comparison with the 1RMs. Future studies using the Actigraph to measure EE should be informed of the smaller potential biases inherent in the use of the 2RMs than the 1RMs.
Supplementary Material
Supplementary Figure 1. Bland-Altman plots with 95% limits of agreement for two 2-regression models (VM2RM - Vector magnitude 2 regression model; VA2RM - Vertical axis 2 regression model) and four 1-regression models (FT1RM - Freedson/Trost 1 regression model; TR1RM - Trost 1 regression model; PU1RM - Puyau 1 regression model; TH1RM - Treuth 1 regression model) in relation to Oxycon Mobile (OM); Note - METRMR (metabolic equivalents taking into account resting metabolic rate)
Practical Implications.
Researchers would be informed of the relative validity of different types of prediction equations for Actigraph accelerometers to estimate energy expenditure in youth.
Epidemiological surveillance and/or intervention studies would utilize prediction equations (i.e. two-regression models) in order to obtain accurate estimates of energy expenditure levels for youth.
Relatively more accurate estimation of energy expenditure for light and moderate activities could be achieved with the use of the two regression models.
Acknowledgments
We would like to thank all the participants and their parents for their participation in the current study. We also would like to thank Yang Bai and Cassandra Weickert for their remarkable help with the data collection. All the authors declare no conflicts of interest. The present study was supported by the National Institute of Health grant (R01 HL091006).
Footnotes
Publisher's Disclaimer: This is a PDF file of an unedited manuscript that has been accepted for publication. As a service to our customers we are providing this early version of the manuscript. The manuscript will undergo copyediting, typesetting, and review of the resulting proof before it is published in its final citable form. Please note that during the production process errors may be discovered which could affect the content, and all legal disclaimers that apply to the journal pertain.
References
- 1.Matthews CE, Hagstromer M, Pober DM, et al. Best Practices for Using Physical Activity Monitors in Population-Based Research. Med Sci Sport Exer. 2012;44:S68–S76. doi: 10.1249/MSS.0b013e3182399e5b. [DOI] [PMC free article] [PubMed] [Google Scholar]
- 2.Welk GJ. Principles of design and analyses for the calibration of accelerometry-based activity monitors. Med Sci Sports Exerc. 2005;37(11 Suppl):S501–511. doi: 10.1249/01.mss.0000185660.38335.de. [DOI] [PubMed] [Google Scholar]
- 3.Freedson P, Pober D, Janz KF. Calibration of accelerometer output for children. Med Sci Sports Exerc. 2005;37(11 Suppl):S523–530. doi: 10.1249/01.mss.0000185658.28284.ba. [DOI] [PubMed] [Google Scholar]
- 4.Puyau MR, Adolph AL, Vohra FA, et al. Validation and calibration of physical activity monitors in children. Obes Res. 2002 Mar;10(3):150–157. doi: 10.1038/oby.2002.24. [DOI] [PubMed] [Google Scholar]
- 5.Treuth MS, Schmitz K, Catellier DJ, et al. Defining accelerometer thresholds for activity intensities in adolescent girls. Med Sci Sports Exerc. 2004 Jul;36(7):1259–1266. [PMC free article] [PubMed] [Google Scholar]
- 6.Trost SG, Ward DS, Moorehead SM, et al. Validity of the computer science and applications (CSA) activity monitor in children. Med Sci Sports Exerc. 1998 Apr;30(4):629–633. doi: 10.1097/00005768-199804000-00023. [DOI] [PubMed] [Google Scholar]
- 7.Crouter SE, Horton M, Bassett DR., Jr Validity of ActiGraph child-specific equations during various physical activities. Med Sci Sports Exerc. 2013 Jul;45(7):1403–1409. doi: 10.1249/MSS.0b013e318285f03b. [DOI] [PMC free article] [PubMed] [Google Scholar]
- 8.Trost SG, Loprinzi PD, Moore R, et al. Comparison of accelerometer cut points for predicting activity intensity in youth. Med Sci Sports Exerc. 2011 Jul;43(7):1360–1368. doi: 10.1249/MSS.0b013e318206476e. [DOI] [PubMed] [Google Scholar]
- 9.Kim Y, Beets MW, Welk GJ. Everything you wanted to know about selecting the “right” Actigraph accelerometer cut-points for youth, but…: a systematic review. J Sci Med Sport. 2012 Jul;15(4):311–321. doi: 10.1016/j.jsams.2011.12.001. [DOI] [PubMed] [Google Scholar]
- 10.Crouter SE, Clowers KG, Bassett DR., Jr A novel method for using accelerometer data to predict energy expenditure. J Appl Physiol. 2006 Apr;100(4):1324–1331. doi: 10.1152/japplphysiol.00818.2005. [DOI] [PubMed] [Google Scholar]
- 11.Crouter SE, Kuffel E, Haas JD, et al. Refined two-regression model for the ActiGraph accelerometer. Med Sci Sports Exerc. 2010 May;42(5):1029–1037. doi: 10.1249/MSS.0b013e3181c37458. [DOI] [PMC free article] [PubMed] [Google Scholar]
- 12.Rothney MP, Brychta RJ, Meade NN, et al. Validation of the ActiGraph two-regression model for predicting energy expenditure. Med Sci Sports Exerc. 2010 Sep;42(9):1785–1792. doi: 10.1249/MSS.0b013e3181d5a984. [DOI] [PMC free article] [PubMed] [Google Scholar]
- 13.Kuffel EE, Crouter SE, Haas JD, et al. Validity of estimating minute-by-minute energy expenditure of continuous walking bouts by accelerometry. Int J Behav Nutr Phys Act. 2011;8:92. doi: 10.1186/1479-5868-8-92. [DOI] [PMC free article] [PubMed] [Google Scholar]
- 14.Crouter SE, Horton M, Bassett DR., Jr Use of a two-regression model of estimating energy expenditure in children. Med Sci Sports Exerc. 2012;44(6):1177–1185. doi: 10.1249/MSS.0b013e3182447825. [DOI] [PMC free article] [PubMed] [Google Scholar]
- 15.Bassett DR, Rowlands A, Trost SG. Calibration and Validation of Wearable Monitors. Med Sci Sport Exer. 2012;44:S32–S38. doi: 10.1249/MSS.0b013e3182399cf7. [DOI] [PMC free article] [PubMed] [Google Scholar]
- 16.Strath SJ, Pfeiffer KA, Whitt-Glover MC. Accelerometer Use with Children, Older Adults, and Adults with Functional Limitations. Med Sci Sport Exer. 2012;44:S77–S85. doi: 10.1249/MSS.0b013e3182399eb1. [DOI] [PMC free article] [PubMed] [Google Scholar]
- 17.Harrell JS, McMurray RG, Baggett CD, et al. Energy costs of physical activities in children and adolescents. Med Sci Sports Exerc. 2005 Feb;37(2):329–336. doi: 10.1249/01.mss.0000153115.33762.3f. [DOI] [PubMed] [Google Scholar]
- 18.Hodges LD, Brodie DA, Bromley PD. Validity and reliability of selected commercially available metabolic analyzer systems. Scand J Med Sci Sports. 2005 Oct;15(5):271–279. doi: 10.1111/j.1600-0838.2005.00477.x. [DOI] [PubMed] [Google Scholar]
- 19.Rosdahl H, Gullstrand L, Salier-Eriksson J, et al. Evaluation of the Oxycon Mobile metabolic system against the Douglas bag method. Eur J Appl Physiol. 2010 May;109(2):159–171. doi: 10.1007/s00421-009-1326-9. [DOI] [PubMed] [Google Scholar]
- 20.Schofield WN. Predicting basal metabolic rate, new standards and review of previous work. Hum Nutr Clin Nutr. 1985;39(Suppl 1):5–41. [PubMed] [Google Scholar]
- 21.Janssen X, Cliff DP, Reilly JJ, et al. Predictive Validity and Classification Accuracy of ActiGraph Energy Expenditure Equations and Cut-Points in Young Children. Plos One. 2013 Nov 11;8(11) doi: 10.1371/journal.pone.0079124. [DOI] [PMC free article] [PubMed] [Google Scholar]
- 22.Reilly JJ, Kelly LA, Montgomery C, et al. Validation of Actigraph accelerometer estimates of total energy expenditure in young children. Int J Pediatr Obes. 2006;1(3):161–167. doi: 10.1080/17477160600845051. [DOI] [PubMed] [Google Scholar]
- 23.Trost SG, Way R, Okely AD. Predictive validity of three ActiGraph energy expenditure equations for children. Med Sci Sport Exer. 2006 Feb;38(2):380–387. doi: 10.1249/01.mss.0000183848.25845.e0. [DOI] [PubMed] [Google Scholar]
- 24.Dixon PM, Pechmann JHK. A statistical test to show negligible trend. Ecology. 2005 Jul;86(7):1751–1756. [Google Scholar]
- 25.Wellek S. Testing statistical hypotheses of equivalence. Boca Raton, Fla: Chapman & Hall/CRC; 2003. [Google Scholar]
- 26.Hauck WW, Anderson S. A new statistical procedure for testing equivalence in two-group comparative bioavailability trials. J Pharmacokinet Biopharm. 1984 Feb;12(1):83–91. doi: 10.1007/BF01063612. [DOI] [PubMed] [Google Scholar]
- 27.Janssen I, Leblanc AG. Systematic review of the health benefits of physical activity and fitness in school-aged children and youth. Int J Behav Nutr Phys Act. 2010;7:40. doi: 10.1186/1479-5868-7-40. [DOI] [PMC free article] [PubMed] [Google Scholar]
- 28.Evenson KR, Catellier DJ, Gill K, et al. Calibration of two objective measures of physical activity for children. J Sports Sci. 2008 Dec;26(14):1557–1565. doi: 10.1080/02640410802334196. [DOI] [PubMed] [Google Scholar]
- 29.Mattocks C, Leary S, Ness A, et al. Calibration of an accelerometer during free-living activities in children. Int J Pediatr Obes. 2007;2(4):218–226. doi: 10.1080/17477160701408809. [DOI] [PubMed] [Google Scholar]
- 30.Firouzbakhsh S, Mathis RK, Dorchester WL, et al. Measured Resting Energy-Expenditure in Children. J Pediatr Gastroenterol Nutr. 1993 Feb;16(2):136–142. doi: 10.1097/00005176-199302000-00007. [DOI] [PubMed] [Google Scholar]
Associated Data
This section collects any data citations, data availability statements, or supplementary materials included in this article.
Supplementary Materials
Supplementary Figure 1. Bland-Altman plots with 95% limits of agreement for two 2-regression models (VM2RM - Vector magnitude 2 regression model; VA2RM - Vertical axis 2 regression model) and four 1-regression models (FT1RM - Freedson/Trost 1 regression model; TR1RM - Trost 1 regression model; PU1RM - Puyau 1 regression model; TH1RM - Treuth 1 regression model) in relation to Oxycon Mobile (OM); Note - METRMR (metabolic equivalents taking into account resting metabolic rate)