

Abstract
Eukaryotic cells coordinately control anabolic and catabolic processes to maintain cell and tissue homeostasis. The mechanistic target of rapamycin complex 1 (mTORC1) promotes nutrient-consuming anabolic processes, such as protein synthesis1. Here, we show that accompanying an increase in protein synthesis, mTORC1 activation also promotes an increased capacity for protein degradation. Cells with activated mTORC1 exhibited elevated levels of intact and active proteasomes through a global increase in the expression of genes encoding proteasome subunits. The increase in proteasome gene expression, cellular proteasome content, and rates of protein turnover downstream of mTORC1 were all dependent on induction of the transcription factor nuclear factor erythroid-derived 2-related factor 1 (NFE2L1 or NRF1). Genetic activation of mTORC1 through loss of the tuberous sclerosis complex tumor suppressors or physiological activation of mTORC1 in response to growth factors or feeding resulted in increased NRF1 expression in cells and tissues. We find that this NRF1-dependent elevation of proteasome levels serves to increase the intracellular pool of amino acids, which thereby influences rates of new protein synthesis. Therefore, mTORC1 signaling increases the efficiency of proteasome-mediated protein degradation for both quality control and as a mechanism to supply substrate for sustained protein synthesis.
In response to growth signals, mTORC1 promotes anabolic processes, such as protein synthesis, and its chronic activation is believed to underlie a variety of complex human diseases, including cancer and metabolic diseases, as well as pathologies associated with aging1,2. Cells must possess mechanisms to coordinate protein synthesis with protein turnover to maintain amino acid and protein homeostasis, as even a small persistent imbalance between these processes can disrupt cell and tissue physiology3,4. Given the ubiquitous role of mTORC1 in stimulating protein synthesis, we sought to assess the effects of mTORC1 activation on protein degradation.
A protein complex comprised of TSC1, TSC2, and TBC1D7 (the TSC complex) serves as a central negative regulator of mTORC1, with loss of its components resulting in growth factor-independent activation of mTORC11. Tsc2−/− mouse embryonic fibroblasts (MEFs) exhibit growth factor-independent activation of mTORC1, as scored by phosphorylation of S6K1 and S6 (Extended Data Fig. 1a), which is blocked by the mTORC1 inhibitor rapamycin or reconstitution with human TSC2. Both TSC1- and TSC2-deficient MEFs displayed a 20 to 25% increase in the rate of de novo protein synthesis, which was abolished by rapamycin (Fig. 1a and Extended Data Fig. 1b). To analyze relative turn-over rates of newly synthesized proteins, the percent of total labeled protein remaining over time was measured in a pulse-chase experiment (Extended Data Fig. 1c). Both TSC1- and TSC2-deficient cells displayed a rapamycin-sensitive increase in the rate of protein degradation (Fig. 1b and Extended Data Fig. 1d-f). This was surprising given the well-established role of mTORC1 in inhibiting autophagy, a lysosome-dependent mechanism of degrading organelles and proteins5. While the lysosome inhibitor chloroquine slowed the rate of protein degradation, cells lacking TSC2 maintained a rapamycin-sensitive increase in protein turnover, and rapamycin also slowed rates of protein degradation in autophagy-deficient (Atg7−/−)6 MEFs (Fig. 1c and Extended Data Fig. 2a-c).
Figure 1. mTORC1 enhances protein degradation through an increase in proteasome levels.

a, Tsc2−/− MEFs expressing TSC2 or empty vector (Vec) were serum starved 16 h with vehicle or 20 nM rapamycin, and protein synthesis was measured with 35S-Met incorporation (20 min). Data are mean ± s.e.m. (n=3). **P<0.01, #P<0.05. b, Cells treated as in a were pulse labeled 30 min and chased in medium containing vehicle or rapamycin. The rate of protein degradation is shown as the fraction of radiolabeled protein remaining over time. c–d, Cells were treated as in b, except that c, 10 μM chloroquine or d, 0.02 μM bortezomib was present in the chase media. b–d, Data are means ± s.e.m (n=3, note: small error bars are masked by line symbols). *P<0.05, **P<0.01, at 48h. e, The cells from a were serum starved 16 h with vehicle or 20 nM rapamycin, or treated for 2 h with MG132 (0.1 μM) or bortezomib (0.2 μM). Proteasome activity is presented as mean ± s.e.m. relative to vehicle-treated cells expressing TSC2 (n=3). *P<0.05, ##P<0.01. f, Cells were serum starved 24 h with vehicle, 20 nM rapamycin, or 2.5 μM PP242. Intact proteasome levels are presented as mean ± s.e.m. relative to vehicle-treated TSC2-expressing cells (n=3). Graphs labeled as in e; *P<0.05, #P<0.05, ##P<0.01. a–e, Statistical significance for pairwise comparisons evaluated with a two-tailed Student’s t test.
A role for the proteasome as the other major cellular mechanism of proteolysis was examined. As with rapamycin, two structurally distinct proteasome inhibitors, bortezomib and MG132, blocked the enhanced rate of protein degradation in TSC2-deficient cells (Fig. 1d and Extended Data Fig. 2d-f). TSC2-deficient cells possessed significantly higher proteasome activity, which was attenuated by rapamycin and abolished with proteasome inhibitors (Fig. 1e). The levels of intact proteasomes were measured in four distinct isogenic pairs of cells, including Tsc2−/− MEFs and a TSC2−/− human angiomyolipoma-derived cell line expressing either empty vector or human TSC2, and HeLa and MCF10A cells stably expressing control or TSC2-targeting shRNAs. TSC2 loss and mTORC1 activation resulted in a significant increase in cellular proteasome content in all four lines, which was reversed by rapamycin or the mTOR kinase inhibitor PP242 (Fig. 1f and Extended Data Fig. 2g,h)
To determine the mechanism of proteasome increase downstream of mTORC1, we focused on transcriptional regulation, as induced expression of proteasome (PSM) genes has been established as a major mechanism controlling cellular proteasome content7,8. Interestingly, in a previous transcriptional profiling study, gene set enrichment analysis of mTORC1-induced transcripts found that the most enriched gene set was ‘Parkin disorder under Parkinson disease’9. In examining the genes driving this enrichment score, we found that ten PSM genes scored as being significantly stimulated by mTORC1 (Extended Data Fig. 3a). We confirmed that mTORC1 activation induced the expression of mRNAs encoding subunits of both the 20S core and 19S regulatory complex of the proteasome in two independent sets of Tsc2 null MEFs and in HeLa cells with stable knockdown of TSC2, as well as wild-type MEFs stimulated with serum (Fig. 2a and Extended Data Fig. 3b-e). NRF1 has been demonstrated to induce the global expression of PSM genes through direct binding of shared regulatory elements in their promoters7,8. Importantly, siRNA knockdown of NRF1, but not the closely related NRF2 (NFE2L2), blocked the mTORC1-dependent induction of PSM genes and increase in intact proteasome levels in multiple TSC2-deficient cell lines (Fig. 2b,c and Extended Data Fig. 4a-d). Reciprocally, exogenous overexpression of two different NRF1 cDNA constructs led to elevated levels of intact proteasomes, which unlike control cells were resistant to the effects of rapamycin (Fig. 2d and Extended Data Fig. 4e). Like rapamycin, NRF1 knockdown blocked the enhanced rate of protein turnover in TSC2-deficient cells (Fig. 2e and Extended Data Fig. 4f,g). Collectively, these data indicate that NRF1 functions downstream of mTORC1 in promoting proteasome-mediated protein degradation.
Figure 2. mTORC1 induces proteasome gene expression and protein degradation through NRF1.

a, Tsc2−/− MEFs expressing TSC2 or empty vector (Vec) were serum starved 16 h with vehicle or 20 nM rapamycin. Transcript levels are shown as mean ± s.e.m. relative to vehicle-treated TSC2-expressing cells (n=3). *P<0.05 or **P<0.01 compared to vehicle-treated TSC2-expressing cells; #P<0.05, ##P<0.01, or ###P<0.001 compared to vehicle-treated vector-expressing cells. b, siRNA-transfected cells were serum starved 16 h. Transcript levels are presented as mean ± s.e.m. relative to TSC2-expressing cells with control siRNAs (n=3). *P<0.05, ##P<0.01. c, Proteasome levels for cells treated as in b are presented as in b (n=3). **P<0.01, #P<0.05. d, Proteasome levels in HEK293 cells transfected with indicated plasmids and serum starved 16 h with vehicle or 20 nM rapamycin are shown as mean ± s.e.m relative to vehicle-treated vector-expressing cells. **P<0.01. e, Rates of protein degradation in serum-starved siRNA-transfected cells (control or Nrf1) treated with vehicle or rapamycin are shown as the fraction of radiolabeled protein remaining over time, presented as mean ± s.e.m (n=3, note: small error bars are masked by line symbols). **P<0.01 at 48h. a–e, Statistical significance for pairwise comparisons evaluated with a two-tailed Student’s t test.
A rapamycin-sensitive increase in NRF1, but not NRF2, protein levels was observed in multiple mouse and human cell lines lacking TSC2, as well as HEK293 cells overexpressing Rheb, the downstream target of the TSC complex that activates mTORC11 (Fig. 2b and Extended Data Fig. 4b,c,f and 5a-c). In wild-type cells, mTORC1 signaling is dependent on growth factors, and NRF1, but not NRF2, was upregulated in a rapamycin-sensitive manner over a time course of growth factor stimulation (serum, EGF, or insulin) in wild-type MEFs, MCF10A, and HeLa cells (Fig. 3a and Extended Data Fig. 5b,c). The mTORC1-mediated induction of NRF1, through either growth factors or TSC2 loss, was reflected in an increase in both the unprocessed (p120) and processed (p110) isoforms of NRF110, as seen most clearly on a NuPage gradient gel (Extended Data Fig. 5d). Rapamycin also decreased the protein levels of individual proteasome subunits, as well as an insulin-stimulated increase in intact 26S proteasomes (Extended Data Fig. 5e,f).
Figure 3. Growth factors stimulate an increase in NRF1 through mTORC1, which induces NRF1 transcription in an SREBP1-dependent manner.

a, Tsc2−/− MEFs expressing TSC2 were serum starved 16 h and stimulated with 10% serum, 10 ng/ml EGF, or 100 nM insulin for the indicated durations with vehicle or 20 nM rapamycin. b, Nrf1 and Nrf2 transcript levels from cells serum starved 16 h with vehicle, 20 nM rapamycin, or 250 nM Torin1 are shown as mean ± s.e.m. relative to vehicle-treated TSC2-expressing cells (n=3). ***P<0.001 compared to vehicle-treated TSC2-expressing cells; ##P<0.01 or ###P<0.001 compared to vehicle-treated vector-expressing cells. c, siRNA transfected cells were treated as in b (Rap = 20 nM rapamycin). Nrf1 transcript levels are presented as mean ± s.e.m. relative to Tsc2-expressing cells with control siRNAs (n=3). ***P<0.001 compared to TSC2-expressing cells, ###P<0.001 compared to vector-expressing cells with control siRNAs. d, NRF1 protein levels from cells treated as in c or e, in HEK293 cells transfected with mature Flag-SREBP1c or empty vector and serum starved 16 h with vehicle or 20 nM rapamycin. f, ChIP from HEK293 cells transfected as in e with anti-Flag (SREBP1c) or Pol II. Bound DNA was measured by qRT-PCR for indicated promoter regions (left: 1, 2, 3) and normalized to control IgG immunoprecipitations. Data are mean ± s.e.m (n=3). b,c, Statistical significance for pairwise comparisons evaluated with a two-tailed Student’s t test.
Chronic mTORC1 signaling can cause endoplasmic reticulum (ER) stress and activate the unfolded protein response (UPR)11, an adaptive response that includes increased proteasomal degradation of ER proteins12. Indeed, Tsc2-deficient cells displayed a rapamycin-sensitive increase in phosphorylation of the UPR effector PERK (Extended Data Fig. S6a). However, classical chemical inducers of ER stress, tunicamycin and thapsigargin, failed to induce NRF1 in wild-type cells. Consistent with previous studies7,8, treatment of cells with proteasome inhibitors led to increased NRF1 protein levels, comparable to those seen in TSC2-deficient cells. However, in contrast to TSC2 depletion, Rheb overexpression, and growth factor stimulation, the proteasome inhibitor-induced increase in NRF1 levels was not reversed by rapamycin. Therefore, mTORC1 signaling increases NRF1 levels in a manner that is independent of both the UPR and the proteasome recovery pathway. Finally, we failed to detect effects of mTORC1 on the nuclear and cytosolic distribution of NRF1 (Extended Data Fig. 6b,c).
The timing of NRF1 induction upon mTORC1 activation (6 to 12h) and the fact that expression of NRF1 from an exogenous promoter led to elevated levels of NRF1 and proteasomes that were no longer sensitive to rapamycin suggested that mTORC1 might regulate NRF1 through transcriptional control mechanisms. Indeed, Nrf1 transcript levels were elevated and sensitive to mTORC1 inhibitors in Tsc2 null cells (Fig. 3b). Amongst transcription factors identified to be downstream of mTORC19, we found that the sterol regulatory element binding protein 1 (SREBP1) regulated Nrf1 gene expression. SiRNA-mediated knockdown of SREBP1, but not SREBP2, decreased Nrf1 transcript levels to a similar extent as rapamycin in both TSC2-deficient MEFs (Fig. 3c) and human angiomyolipoma-derived cells (Extended Data Fig. 7a), and SREBP1 depletion also decreased NRF1 protein levels (Fig. 3d). Reciprocally, exogenous expression of mature, active SREBP1c upregulated NRF1 and rendered its expression resistant to rapamycin (Fig. 3e). Analysis of previous genomic data sets from studies aimed at identifying targets of SREBP1, including genome-wide expression13 and chromatin immunoprecipitation (ChIP)14, further suggested that the NFE2L1/NRF1 gene is directly regulated by SREBP1. Bioinformatic analysis of the human and rodent NRF1 loci identified four consensus and conserved sterol regulatory elements in proximity to the two predicted transcriptional start sites (Extended Data Fig. 7b). A ChIP assay demonstrated that mature SREBP1c bound to the NRF1 promoter, where Pol II binding was also enriched (Fig. 3f). As controls, SREBP1c also bound to the promoter of its established target SCD but not to the promoters of GAPDH or NRF2/NFE2L2 (Extended Data Fig. 7c). As mTORC1 signaling increases the accumulation of active SREBP19, these collective findings indicate that SREBP1 lies downstream of mTORC1 in the induction of Nrf1 expression.
We next examined mouse models of both genetic and physiological activation of mTORC1 signaling in the brain and liver, respectively. A brain model of the TSC disease involving a conditional hypomorphic allele of Tsc2 (Tsc2c-del3) was used, in which exon 3 is deleted in neurons through Cre expression from the synapsinI promoter (SynICre)15. Brain lysates from Tsc2+/+, Tsc2c-del3/- (heterozygotes), and Tsc2c-del3/c-del3SynICre (neuron-specific deletion) mice were compared. This allelic series showed a graded loss of TSC2 protein with a corresponding increase in mTORC1 signaling, elevated NRF1 protein and mRNA levels, with no change in Nrf2 expression, and a corresponding increase in PSM transcript and protein levels (Fig. 4a-c and Extended Data Fig. 8a). NRF1 has been shown to control PSM gene expression in hepatocytes16. mTORC1 signaling is strongly activated in the liver upon feeding17. This stimulation was associated with an increase in the protein and mRNA levels of NRF1, but not NRF2, as well as representative PSM transcripts, and these were blocked with a single dose of rapamycin just prior to feeding (Fig. 4d,e and Extended Data Fig. 8b). These data provide in vivo support for NRF1 activation and proteasome induction downstream of mTORC1 signaling.
Figure 4. NRF1 is induced upon mTORC1 activation in tissues and influences cellular amino acid levels and protein synthesis.

a, Protein from indicated brain lysates are shown, with NRF1 levels normalized to actin below. b, Nrf1 and Nrf2 and c, PSM gene transcript levels from brain tissues in a are shown as mean ± s.e.m. of triplicate samples relative to Tsc2+/+ sample 1. d, Mice fasted overnight were refed (6 h) following 30-min pretreatment with vehicle or rapamycin (10 mg/kg). Protein from liver lysates are shown, with NRF1 levels normalized to actin graphed as mean ± s.e.m. relative to fasted mice (n=4 per condition). *P<0.05, ##P<0.01. e, Transcript levels from liver tissues in d are shown as mean ± s.e.m. relative to fasted mice. *P<0.05, #P<0.05. f, Tsc2−/− MEFs expressing TSC2 or empty vector transfected with Nrf1 (a and b) or control siRNAs were serum starved 16 h with vehicle or 20 nM rapamycin or treated 1 h with 100 nM bortezomib. Amino acid levels are shown as mean ± s.e.m. of triplicate samples relative to TSC2-expressing cells. *P<0.05 compared to TSC2-expressing cells, ##P<0.01 or ###P<0.001 compared to vehicle-treated vector-expressing cells. g, Rates of protein synthesis in cells treated as in f are shown as mean ± s.e.m relative to TSC2-expressing cells (n=3). **P<0.01 compared to TSC2-expressing cells; #P<0.05 or ##P<0.01 compared to vehicle-treated vector-expressing cells. h, Cells treated as in f were switched to low or high amino acid media overnight, and rates of protein synthesis are shown as the mean ± s.e.m relative to vehicle-treated cells (n=3). ***P<0.001 compared to vehicle-treated low AA cells; #P<0.05 or ##P<0.01 compared to vehicle-treated high AA cells. d–h, Statistical significance for pairwise comparisons evaluated with a two-tailed Student’s t test.
We hypothesized that, in addition to serving as a quality control mechanism for newly translated proteins, the increased proteasome activity upon mTORC1 activation could serve to maintain adequate pools of amino acids to sustain protein synthesis. Indeed, while inhibition of translation with rapamycin or cycloheximide increased amino acids, proteasome inhibitors significantly depleted intracellular amino acids (Fig. 4f and Extended Data Fig. 9a). Likewise, two distinct siRNAs targeting Nrf1 elicited a significant decrease in intracellular amino acids, similar to bortezomib treatment (Fig. 4f and Extended Data Fig. 9b). Depletion of intracellular amino acids upon Nrf1 knockdown or bortezomib treatment was also reflected in a decreased rate of protein synthesis, which was much more pronounced under conditions of lower exogenous amino acids (Fig. 4g,h and Extended Data Fig. 9c,d). However, the differences in protein synthesis under low and high amino acids were not reflected in differences in mTORC1 signaling (Extended Data Fig. 9e). Finally, TSC2-deficient MEFs and MCF10As exhibited increased sensitivity to NRF1 knockdown (Extended Data Fig. 10a,b), indicating the importance of NRF1 induction for viability in the context of mTORC1 activation. Collectively, our findings suggest a model whereby the mTORC1-stimulated expression of NRF1 and subsequent increase in cellular proteasome activity serve as a delayed, but pre-programmed, adaptive response accompanying increased protein synthesis downstream of mTORC1 (Extended Data Fig. 10c).
Full Methods
Materials
Reagents were obtained from the following sources. Antibodies to TSC2 (#4308), phospho-T389 S6K1 (#9234), phospho-S240/S244 S6 (#5364), phospho-T980 PERK (#3179), PERK (#3192), Psma5 (#2457), Psmb5 (#11903), Psmd14 (#4197), FLAG (#2368), normal rabbit IgG (#2729), and horseradish-peroxidase-labelled anti-rabbit (#7074S) and anti-mouse (#7076S) secondary antibodies from Cell Signaling Technology; antibodies to NRF1 (sc-13031) and SREBP1 (sc-8984) from Santa Cruz; antibody to NRF2 (#2178-1) and Psma1 (3759-1) from Epitomics; antibodies to β-actin (A-5316) and α-tubulin (T-5168) from Sigma. 35S-methionine, cell labeling grade, from PerkinElmer Life Sciences; L-methionine, chloroquine, MG132, tunicamycin, thapsigargin, cycloheximide, trichloroacetic acid, sodium salicylate, protease inhibitor cocktail, Dulbecco’s modified Eagle’s medium (DMEM)/F12, insulin, hydrocortisone, cholera toxin, and fetal bovine serum from Sigma; methionine-free DMEM, Basal Medium Eagle (BME), 50X amino acids solution, horse serum, transfection reagents Lipofectamine® 2000 and Lipofectamine® RNAiMAX, and NuPAGE® Novex® 4-12% Bis-Tris protein gel from Life Technologies Corporation; rapamycin and bortezomib from LC Laboratories; Torin1 and PP242 from Tocris; EGF from Peprotech.
DNA Constructs
The following plasmids were used. pcDNA3.1, pcDNA3.1-2xFLAG-SREBP1c (Addgene plasmid 26802)18 and pShuttle-CMV (Addgene plasmid 16403)19. A pCMV-Sport6 vector encoding the mouse Nrf1 cDNA (GenBank accession: BC047283.1) was acquired from Open Biosystems (ThermoScientific). The Nrf1 cDNA was PCR amplified with the addition of tag elements incorporated onto its 5′ (his) or 3′ (flag or myc) ends, along with suitable restriction sites, which were then utilized to subclone into the pShuttle-CMV vector.
Cell lines
MEF, HeLa, and HEK293 lines were maintained in DMEM with 4.5 g/liter glucose containing 10% fetal bovine serum and were mycoplasma free. The isogenic pair of Tsc2−/− MEFs reconstituted with human TSC2 or empty vector were described previously20. The littermate-derived pairs of Tsc2+/+ and Tsc2−/− MEFs (both p53−/−) and Tsc1+/+ and Tsc1−/− MEFs were described previously21,22. The TSC2 null human cell line derived from a renal angiomyolipoma23 expressing either empty vector or human TSC2 was a kind gift from E. P. Henske (Brigham and Women’s Hospital, Boston, MA). HeLa cell line stably expressing control shRNAs or those targeting TSC2 was also previously described20. MCF10A cell line stably expressing control shRNAs or those targeting TSC2 was maintained in DMEM/F12 containing 5% horse serum, human EGF (20 ng/ml), hydrocortisone (0.5 μg/ml), cholera toxin (100 ng/ml), Insulin (10 μg/ml), and puromycin (0.5 μg/ml) for selection purpose. To generate HEK293 cells stably expressing the tagged NRF1 constructs, the pShuttle-CMV construct encoding NRF1 was transfected into HEK293 cells, which then underwent G418 (500 μg/ml) selection for 2 weeks.
siRNAs
The siRNAs used in this study were bought from ThermoScientific as ON-TARGETplus siRNA pools unless otherwise specified. The catalog numbers are as follows: mouse NRF1, L-062252-01; human NRF1, L-019733-00; mouse NRF2, L-040766-00; human NRF2, L-003755-00; mouse SREBP1, L-040814-01, human SREBP1, L-006891-00; mouse SREBP2, L-050073-01; human SREBP2, L-009549-00; control siRNA, D-001810-10; individual NRF1 siRNA a, J-062252-12; individual Nrf1 siRNA b, J-062252-11; For siRNA knockdowns, cells were transfected with 20 nM ON-TARGETplus siRNA pools and 2 μl (per ml media) Lipofectamine RNAiMAX, except in Fig. 4f-h and Extended Data Fig. 9b-d where individual Nrf1 siRNAs (a and b) were used instead of pools. Cells were harvested 48 to 72 h post-transfection.
Mice
The neuron-specific Tsc2 hypomorphic mutant mice used in this study were described previously15. Two mice of each genotype were used for this qualitative analysis. Immediately following euthanasia, brains were harvested and sections of frontal cortex were flash-frozen in liquid nitrogen. Total time between euthanasia and freezing was kept below 5 min for all samples. For fasting-refeeding studies in wild-type mice, the experimental procedure was detailed previously17. Briefly, twelve 8-week old C57BL/6J male mice were fasted overnight and either euthanized (n=4) or refed normal chow for 6 h (n=8). Vehicle (5% Tween-80, 5% PEG-400 in PBS; n=4) or rapamycin (10 mg/kg; n+4) was administered via i.p. injection 30 min prior to refeeding. These experiments were performed in an unblinded fashion. Procedures were carried out in accordance with the Guide for the Humane Use and Care of Laboratory Animals, and the research protocol was approved by the Animal Care and Use Committees of Boston Children’s Hospital and Harvard Medical School.
Protein synthesis and degradation with metabolic radiolabeling
Cells were serum starved for 16 h in the presence of vehicle (DMSO) or 20 nM rapamycin in 6-well plate. To assess protein synthesis, cells were starved for 30 min with methionine-free DMEM and radiolabeled for 20 to 30 min with 35S-Met before lysis and SDS-PAGE. To compare the effects of exogenous amino acid levels (Fig. 4h), 16 h prior to radiolabeling, cells were switched to either BME media, which contains physiological concentrations of amino acids (low AAs), or BME media supplemented with amino acids to a final concentration that is 8-fold higher, which is equal to twice that of DMEM (high AAs). To assess protein degradation, cells were starved for 30 min with methionine-free DMEM and pulse-labeled for 30 min with 0.5 ml of medium containing 0.1 mCi of 35S-Met. Cells were then washed with Met-free DMEM and chased for various periods in DMEM containing 1 mM Met. After washing in cold PBS, lysis was conducted in 200 μl of RIPA buffer (50 mM Tris-HCl, pH 7.4, 1% Sodium deoxycholate, 0.1% SDS, 1% NP-40, 150 mM NaCl, 1 mM EDTA, 10 mM sodium pyrophosphate, 10 mM glycerol 2-phosphate, 50 mM NaF, 0.5 mM sodium orthovanadate, and protease inhibitor cocktail). Following centrifugation at 10,000 g, supernatants were boiled with SDS sample buffer and analyzed by SDS-PAGE (10% gel) followed by fluorography. The entire lane of each sample was quantified using ImageJ (NIH) on scanned films. Backgrounds were subtracted by quantifying a blank area of the film corresponding in size to that of the gel lane of interest, and the results were normalized to cell numbers in a parallel set of cells with the same treatment. The graphed data were quantified from three independent experiments performed on separate occasions, with representative films from one such experiment per condition also provided in the extended data.
Immunoblotting
Cells were lysed in an NP-40 lysis buffer (40 mM HEPES, pH 7.4, 120 mM NaCl, 1 mM EDTA, 1% NP-40, 5% glycerol, 10 mM sodium pyrophosphate, 10 mM glycerol 2-phosphate, 50 mM NaF, 0.5 mM sodium orthovanadate, and protease inhibitors) or, in experiments where transcription factors were to be detected, RIPA buffer. For animal studies, freshly resected tissues, snap-frozen in liquid nitrogen, were homogenized in NP-40 lysis buffer containing 1 mM DTT. Tissue or cell debris was cleared by subsequent 30 min centrifugations at 16,000 rpm. Normalized protein lysates were separated by SDS-PAGE, transferred onto an Immobilon-P membrane (Millipore Corp.), subjected to immunoblotting with the given antibodies, and detected by ECL (Amersham Biosciences). The immunoblots in Extended Data Fig. 5d are from lysates run on a 4–12% continuous gradient NuPAGE gel.
Proteasome activity assay
Cells were serum starved for 16 h in the presence of vehicle (DMSO) or 20 nM rapamycin, or treated for the final 2 h with MG132 (0.1 μM) or bortezomib (0.2 μM). Proteasome activities were measured in cell lysates. The fluorogenic substrate Suc-LLVY-AMC (Promega, G8660) was used to measure the chymotrypsin-like proteasome activity in both 20S and 26S proteasomes. Assays were carried out in a 200 μl reaction volume according to the manufacturer’s instructions. Proteasome activity was determined as the rate of cleavage of the fluorescent substrate over 10 minutes and activity was expressed as arbitrary fluorescence units after normalizing to the total protein concentration. Fluorescence was measured on a BioTek Synergy 2 Multi-Mode Microplate Reader (BioTek Instruments, Inc.) at excitation and emission wavelengths of 380 nm and 460 nm, respectively.
Proteasome quantification assay
Fig. 1f: cells were serum starved for 24 h in the presence of vehicle (DMSO), 20 nM rapamycin, or 2.5 μM PP242. Fig. 2c: cells were transfected with siRNAs targeting Nrf1 or Nrf2 or non-targeting control siRNAs, and 72 h post-transfection, were serum starved for 16 h. Fig. 2d: HEK293 cells were transfected with constructs expressing his-Nrf1-flag, Nrf1-myc, or empty vector and were serum starved for 16 h in the presence of vehicle or 20 nM rapamycin. Two distinct ELISA kits were used for mouse and human proteasome quantification, with the mouse version being specific for the 26S proteasome and the human version being specific for the 20S proteasome. To determine 20S proteasome concentrations in human cell lysates, we utilized a proteasome ELISA kit according to the manufacturer’s instructions (BML-PW0575, Enzo Life Sciences). Briefly, cells were lysed at a concentration of approximately 1×10⁷ cells/ml. Cell lysates were diluted 1:100, and 100 μl of the diluted lysates were incubated for 1 h at room temperature in 96-well plates pre-coated with the anti-proteasome antibody. Standard curves for quantification were established, using purified proteasomes in a concentration range from 0 to 1.6 μg/ml. After washing, 100 μl detection antibody was added and incubated for 1 h at room temperature. Wells were washed again and bound antibodies were detected after labeling with secondary antibody. The plates were washed and read at 450 nm after 10 minutes of incubation with substrate solution. The 26S proteasome concentration in MEFs was determined by a mouse 26S proteasome ELISA kit (E03A0669, BlueGene Biotech), following manufacturers protocol. The procedure was the same as that described above except that cells were lysed by freeze-thaw cycles and cell lysates were diluted 1:10.
qRT-PCR
For gene expression analyses, RNA was isolated from cultured cells using the RNeasy Mini Kit (QIAGEN) and from mouse tissue using TRIzol (Life Technologies Corporation), according to the manufacturers’ instructions. cDNA was prepared using the Superscript III First-Strand Synthesis System for RT-PCR kit (Life Technologies Corporation). Transcript abundance was determined using SYBR Green PCR mix (Applied Biosystems) and primers specific for each transcript. qRT-PCR was performed using an Applied Biosystems 7300 Real-Time PCR System. Triplicate samples were collected for each experimental condition, and measurements were then normalized to Rplp0 (m36b4) mRNA to determine relative expression levels. Oligonucleotides used for qPCR of mouse mRNAs are as follows. Psma1: forward 5′-CCTCAGGGCAGGATTCATCAA-3′, reverse 5′-GAGCGGCAAGCTCTGACTG-3′; Psmb1: forward 5′-TTCCACTGCTGCTTACCGAG-3′, reverse 5′-CGTTGAAGGCATAAGGCGAAAA-3′; Psmb2: forward 5′-CCCAGACTATGTCCTCGTCG-3′, reverse 5′-CCGTGTGAAGTTAGCTGCTG-3′; Psmb5: forward 5′-CCACAGCAGGTGCTTATATTGC-3′, reverse 5′-GCTCATAGATTCGACACTGCC-3′; Psmc3: forward 5′-GCGCACACGGTTGTTAGAC-3′, reverse 5′-TACGGCAGGGTTTTGTTCACT-3′; Psmc6: forward 5′-ATGGCGGACCCTAGAGATAAG-3′, reverse 5′-TCTGTCCAACACTTTGTAGTGC-3′; Psmd1: forward 5′-TGAATGCAGTCGTGAATGACTT-3′, reverse 5′-GTGATAAAACACTTTCGAGGCCA-3′; Psmd12: forward 5′-GATGGGCGCATTGTGAAGATG-3′, reverse 5′-GGGTTTCGATGACTTCTTGAAGC-3′; Psmd14: forward 5′-AGGCCACCTACAGATGCTC-3′, reverse 5′-ACTCTGACGGTGTAATCATCAAC-3′; Psme4: forward 5′-AGCGTCAACAAGATAAGAATGCT-3′, reverse 5′-GCCCGATTCCTATATGCTCAAA-3′; Nrf1: forward 5′-CCCTACTCACCCAGTCAGTATG-3′, reverse 5′-CATCGTGCGAGGAATGAGGA-3′; Nrf2: forward 5′-GCCCACATTCCCAAACAAGAT-3′, reverse 5′-CCAGAGAGCTATTGAGGGACTG-3′; Rplp0: forward 5′-AGATGCAGCAGATCCGCAT-3′, reverse 5′-GTTCTTGCCCATCAGCACC-3′. Oligonucleotides used for qPCR of human mRNAs are as follows. Psma1: forward 5′-TAAACAAGGTTCAGCCACAGTT-3′, reverse 5′-GCTCTGATTGCGCCCTTTTC-3′; Psmb1: forward 5′-CCTCTACAGCCATGTATTCGGC-3′, reverse 5′-CGTTGAAAACGTAGGGCGAAAAT-3′; Psmb2: forward 5′-ATCCTCGACCGATACTACACAC-3′, reverse 5′-GAACACTGAAGGTTGGCAGAT-3′; Psmb5: forward 5′-AGGAACGCATCTCTGTAGCAG-3′, reverse 5′-AGGGCCTCTCTTATCCCAGC-3′; Psmc3: forward 5′-CGAGCAAGATGGAATTGGGGA-3′, reverse 5′-GCTCATGGGTGACTCTCAACA-3′; Psmd1: forward 5′-TCCGAGTCCGTAGACAAAATAGA-3′, reverse 5′-CCACACATTGTTTGGTGTAGTGA-3′; Psmd14: forward 5′-AAGTTATGGGTTTGATGCTTGGA-3′, reverse 5′-ATACCAACCAACAACCATCTCC-3′; Psme4: forward 5′-ATTTGGAGTTACCCTGGAGACC-3′, reverse 5′-GCAGCTTTTCACGAGTGTTTTG-3′; Nrf1: forward 5′-CATTCTGCTGAGTTTGATTGGGG-3′, reverse 5′-TTGTGGAACTGGGTCTGAGTAT-3′; Nrf2: forward 5′-TCAGCGACGGAAAGAGTATGA-3′, reverse 5′-CCACTGGTTTCTGACTGGATGT-3′; RPLP0: forward 5′-AGATGCAGCAGATCCGCAT-3′, reverse 5′-GTTCTTGCCCATCAGCACC-3′.
Bioinformatic analysis of NRF1 promoter
In order to identify putative binding elements for SREBP1 in the promoter region of the Nrf1 genes from human and rodents, a python script that uses the Biopython package to search for sterol regulatory elements in a given promoter was created. ENTREZ was used to acquire the promoter sequence of human, mouse and rat NRF1 from PubMed, and the motif module was used to look for sterol regulatory elements24. The motif search was based on a position weight matrix from 20 established SREBP targets developed by Zerenturk et al25. The visual representation of the sterol regulatory element position weight matrix, and its reverse complement, were created using WebLogo26. The promoter sequences were aligned using the ClustalX program27 in order to identify the conserved motifs.
Chromatin immunoprecipitation (ChIP)
HEK293 cells were transfected with flag-tagged active SREBP1c or empty vector, followed by 7 days of selection in G418. ChIP assays were performed using a ChIP kit (Thermo Scientific) according to the manufacturer’s instructions with minor modifications. Briefly, cells were fixed with 1% formaldehyde for 10 min at room temperature to cross-link existing protein/DNA interactions. The fixed cells were harvested and lysed in the provided lysis buffer with protease inhibitors added. The nuclei were collected by centrifugation, and chromatin was sheared to fragments of 400–1000 bp using micrococcal nuclease (37°C, 30 min). Nuclei were resuspended in nuclear lysis buffer containing phosphatase and protease inhibitors and debris was removed by centrifugation. 10% of the chromatin was kept as input and the remaining was diluted ten-fold with dilution buffer. Immunoprecipitation was performed with antibodies against the Flag epitope, RNA polymerase II, or nonspecific control IgG overnight at 4°C. The IgG/protein/DNA complexes were captured with protein A/G agarose for 1 h and the beads were washed. Bound DNA was eluted with elution buffer and, along with the input DNA, was subjected to reverse crosslinking at 65°C for 2 h with shaking. Following proteinase K treatment, DNA was recovered using the DNA Clean-Up Column and was subjected to qRT-PCR with specific primers for different promoter regions. Primers against the SCD and GAPDH promoters served as positive and negative controls, respectively. The relative occupancy of SREBP1c at the given locus was calculated by sequential normalization to the input and to the DNA present in IPs with control IgG. Primer sequences used for qRT-PCR of promoter regions of human genes are as follows. NRF1 #1: forward 5′-GGCTGTTGTCAGGGATAGGA-3′, reverse 5′-AGAAGCCCCTCACAGACTCA-3′; NRF1 #2: forward 5′-AACGTGGCCATATCCTTCTG-3′, reverse 5′-GGGCAACAAGAGCAAAACTC-3′; NRF1 #3: forward 5′-ACATGGCAAAACCCTGTCTC-3′, reverse 5′-AGATGGAGTCGCTCTGTGGT-3′; SCD: forward 5′-CTCAGGAAACAGTGGTGAACCC-3′, reverse 5′-GCAGAGCCATTGTTCGCAGG-3′; GAPDH: forward 5′-TACTAGCGGTTTTACGGGCG-3′, reverse 5′-TCGAACAGGAGGAGCAGAGAGCGA-3′; NRF2: forward 5′-GAAGGTCTGGGGACTGAGC-3′, reverse 5′-CCCGTGACTAGGCACATTTT-3′.
Measuring intracellular amino acid levels
Cells were serum starved for 16 h and treated 1 h with the specified compounds in 96-well plates. Amino acid levels were quantified in triplicate using an L-Amino Acid Assay Kit (Abcam) following the manufacturer’s instructions. Briefly, cells were washed with PBS and lysed in an Assay Buffer. A standard curve for quantification was established, using L-Amino Acid Standards in a concentration range from 0 to 80 nmol/ml. 50 μl of the Reaction Mix was added to each well containing the L-Amino Acid standard or test samples and the reaction was incubated for 30 min at 37°C. The L-amino acid levels were quantified using fluorometric analysis on a BioTek Synergy 2 Multi-Mode Microplate Reader (BioTek Instruments, Inc.) at excitation and emission wavelengths of 535 nm and 590 nm, respectively, and were normalized to cell numbers in parallel wells.
Subcellular fractionation
Cells were serum starved for 24 h in the presence of vehicle or rapamycin and nuclear/cytoplasmic fractionation was performed using the Nuclear Extract Kit (Active Motif) as per the manufacturer’s instructions. In brief, cells were collected, resuspended in Hypotonic Buffer, and incubated on ice for 15 min. Cells were lysed and the nuclei were pelleted by centrifugation, with the supernatant corresponding to the cytoplasmic fraction. To isolate nuclear proteins, the nuclei were lysed in Complete Lysis Buffer and the debris was removed by centrifugation.
Viable cell counts
TSC2-expressing or deficient MEFs (TSC2 addback or vector) or MCF10As (control or TSC2 shRNAs) were transfected with siRNAs targeting NRF1 or non-targeting control siRNAs. At 48 h post-transfection, 1 × 10⁵ cells were reseeded per well in 6-well plates and grown in serum-free DMEM for 24 h. Triplicate samples were counted using trypan blue exclusion, and the mean viable cell numbers ± s.e.m. for a representative experiment (n=2) are shown.
Statistical Analyses
Statistical analysis was used to support the main conclusions in this study. Unless otherwise specified, all experiments were performed at least three times. The sample size for each experiment is provided in the relevant figure legends and/or in the methods above, and unless otherwise specified, represents biological replicates/independent experiments performed on different days, each with technical triplicates. All values were reported as mean ± s.e.m.. Statistical significance for all pairwise comparisons was evaluated with a two-tailed Student’s t test, and a P value 0.05 was considered significant. To our knowledge and observation, all of the biochemical measurements made provide data that is of the normal distribution and there is a similar variance among the groups.
Extended Data
Extended Data Figure 1. mTORC1 activation increases protein degradation.

a, Immunoblots of lysates from Fig. 1a are shown. b, The same experiment as in Fig. 1a except Tsc1+/+ and Tsc1−/− MEFs were used. Data are mean ± s.e.m. (n=3). *P < 0.05, #P < 0.05. c, Schematic diagram of the experimental design for the pulse-chase measurements of protein turnover. d, An autoradiograph gel image representative of the three independent experiments quantified in Fig. 1b. e, The same experiment in Fig. 1b was performed, except with Tsc1+/+ and Tsc1−/− MEFs. Data are mean ± s.e.m (n=3). *P < 0.05 for the 48-hour data point comparison. f, An autoradiograph gel image representative of the three independent experiments quantified in e. b,e, Statistical significance for pairwise comparisons evaluated with a two-tailed Student’s t test.
Extended Data Figure 2. mTORC1 activation enhances protein degradation in a proteasome-dependent manner.

a, An autoradiograph gel image representative of the three independent experiments quantified in Fig. 1c. b, The same experiment as Fig. 1b was performed, except a pair of wild-type and Atg7−/− MEFs were used. Data are means ± s.e.m (n=3, note: small error bars are masked by line symbols). ***P<0.001 for 48 h time point. c,d Autoradiograph gel images representative of the three independent experiments quantified and graphically represented in either c, panel b or d, Fig. 1d. e The same experiment in Fig. 1d was performed, except MG132 was used instead of bortezomib. f, The autoradiograph gel image quantified in e. g, Immunoblots demonstrating TSC2 loss and mTORC1 activation in the cells used in Fig. 1f and panel h. The indicated cells were starved for 16 h in the presence of vehicle (DMSO) or 20 nM rapamycin, prior to lysis. h, The same experiments in Fig. 1f were performed, except MCF10A and HeLa cells expressing non-targeting shRNAs (shCtl) or shRNAs targeting human TSC2 (shTSC2) were used. Data are presented as mean ± s.e.m. relative to vehicle-treated TSC2-expressing cells (n=3). *P<0.05, #P<0.05, ##P<0.01. b,h, Statistical significance for pairwise comparisons evaluated with a two-tailed Student’s t test.
Extended Data Figure 3. mTORC1 signaling promotes PSM gene transcription.

a, PSM gene expression from a previous microarray experiment comparing expression in Tsc2−/− MEFs, over a time course of rapamycin treatment, to those in littermate Tsc2+/+ MEFs. Log2 expression levels provided are the average obtained from triplicate samples per time point of rapamycin treatment normalized to the expression levels in vehicle treated wild-type cells. b, The expression levels of two additional PSM genes from the experiment in Fig. 2a are shown. Data are mean ± s.e.m (n=3). *P<0.05 compared to vehicle-treated TSC2-expressing cells; #P<0.05, ##P<0.01 compared to vehicle-treated TSC2-deficient cells. c, The same experiment as Fig. 2a, except that PSM gene expression was analyzed in the same littermate-derived pair of Tsc2+/+ p53−/− and Tsc2−/− p53−/− MEFs use in a. Data are mean ± s.e.m. (n=3) relative to vehicle-treated TSC2+/+ cells. *p < 0.05 or **p < 0.01 compared to vehicle-treated TSC2+/+ cells; #p < 0.05, ##p < 0.01, or ###p < 0.001 compared to vehicle-treated TSC2−/− cells. d, The same experiment shown in Fig. 2a, except that PSM gene expression was analyzed in HeLa cells stably expressing shRNAs targeting firefly luciferase (shLUC) or those targeting human TSC2 (shTSC2). Data are mean ± s.e.m. (n=3) relative to vehicle-treated shLUC-expressing cells. *p < 0.05 or **p < 0.01 compared to vehicle-treated shLUC-expressing cells; #p < 0.05, ##p < 0.01, or ###p < 0.001 compared to vehicle-treated shTSC2-expressing cells. e, Cells were serum starved 16 h then stimulated with 10% serum in the presence of vehicle (DMSO), 20 nM rapamycin, or 250 nM Torin1. Transcript levels are shown as mean ± s.e.m. relative to vehicle (n=3). b–d, Statistical significance for pairwise comparisons evaluated with a two-tailed Student’s t test.
Extended Data Figure 4. NRF1 knockdown decreases the mTORC1-stimulated expression of PSM genes and protein degradation.

a, The expression levels of an additional PSM gene from the experiment in Fig. 2b is shown. *P<0.05 compared to vehicle-treated TSC2-expressing cells; ##P<0.01 compared to vehicle-treated vector-expressing cells. Data are mean ± s.e.m (n=3). b, The same experiment shown in Fig. 2b, except the littermate-derived pair of Tsc2+/+ p53−/− and Tsc2−/− p53−/− MEFs were used. Data are shown as the means ± s.e.m. (n=3). *p < 0.05 or **p < 0.01; ##p < 0.01, or ###p < 0.001. c, MEF cell lysates obtained from the experiment in Fig. 2c were subjected to immunoblotting. d, The same experiment in Fig. 2c was performed, except HeLa cells expressing non-targeting shRNAs (shLUC) or shRNAs targeting human TSC2 (shTSC2) were used. Data are presented as mean ± s.e.m. relative to vehicle-treated shLUC-expressing cells (n=3). *P<0.05, #P<0.05. e, f, Cell lysates obtained from the experiment in Fig. 2d and 2e, respectively, were subjected to immunoblotting. g, Autoradiograph of gel, representative of three independent experiments, corresponding to the data graphically represented in Fig. 2e. a,b,d, Statistical significance for pairwise comparisons evaluated with a two-tailed Student’s t test.
Extended Data Figure 5. Genetic and growth factor-stimulation of mTORC1 signaling increases the protein levels of NRF1.

a, HEK293 cells were transfected with Rheb or empty vector and serum starved for 16 h in the presence of vehicle or rapamycin (Rap, 20 nM) before lysis and immunoblotting. b, The same experiment shown in Fig. 3a, except MCF10A cells expressing non-targeting shRNAs (-) or shRNAs targeting human TSC2 (+) were used and were stimulated with full serum (10% FBS) or EGF (10 ng/ml) for the indicated durations after 16 h serum starvation. c, Same as b, except HeLa cells were used and were stimulated with insulin (100 nM). d, The normalized cell lysates from the experiment shown in Fig. 3a, with just the starved and 24 h-stimulated samples, along with the vector-expressing Tsc2 null cells, were run on a 4–12% continuous gradient NuPAGE gel, followed by immunoblotting. e, Lysates from the insulin-stimulated cells obtained in Fig. 3a were subjected to additional immunoblotting. f, Tsc2 null MEFs reconstituted with wild-type TSC2 were stimulated with insulin (100 nM for 24 h), and intact proteasome levels were measured by ELISA and are presented as the mean ± s.e.m (n=3). **p < 0.01, ##p < 0.01. f, Statistical significance for pairwise comparisons evaluated with a two-tailed Student’s t test.
Extended Data Figure 6. NRF1 activation downstream of mTORC1 is independent of ER stress, proteasome inhibition, and distribution between the cytosol and nucleus.

a, MCF10A cells stably expressing non-targeting shRNAs (-) or shRNAs targeting human TSC2 (+) were serum starved for 24 h in the presence of vehicle or the compounds indicated (tunicamycin, 0.5 μg/ml; thapsigargin, 1 μM; MG132, 0.5 μM; bortezomib, 0.5 μM). Whole-cell lysates were immunoblotted with the indicated antibodies. b, The same cells in a were serum starved for 24 h in the presence of vehicle or rapamycin. Cytoplasmic and nuclear extracts were isolated and immunoblotted. c, HEK293 cells transiently expressing his-Nrf1-flag were serum starved for 24 h in the presence of vehicle or rapamycin, and subject to cytoplasmic/nuclear fractionation and immunoblotting.
Extended Data Figure 7. mTORC1 activates NRF1 gene expression through SREBP1.

a, The same experiment shown in Fig. 3c, except with human TSC2−/− angiomyolipoma cells reconstituted with human TSC2 or empty vector (EV). Data are shown as the means ± s.e.m. (n = 3). *p < 0.05 compared to TSC2-expressing cells transfected with control siRNAs; #p < 0.05 compared to vector-expressing cells transfected with control siRNAs. Statistical significance for pairwise comparisons evaluated with a two-tailed Student’s t test. b, Consensus sterol regulatory elements (SREs) are conserved in the promoters of the human and rodent NRF1 genes. Forward (top left) and reverse (top right) position weight matrices based on SREs of twenty established SREBP targets are shown and were used to find putative SREs in the NRF1 promoter. The human, mouse and rat NRF1 promoters are aligned and numbered with their distance from the conserved translation start site. The two possible transcription start sites are depicted with a numbered arrow above the aligned sequences. Four SREs were found to be conserved in all three promoters in the region of these start sites. c, In the same samples described in Fig. 3f, ChIP analysis for SREBP1c and Pol II promoter occupancy of the given genes was performed using HEK293 cells expressing flag-tagged mature SREBP1c or empty vector. Known SREBP1 target sites on SCD served as a positive control, with GAPDH and NFE2L2/NRF2 promoters as negative controls. Data were normalized to the levels of bound DNA in control IgG IPs and are shown as mean ± s.e.m (n=3).
Extended Data Figure 8. mTORC1 signaling influences proteasome subunit expression in vivo.

a, Some individual proteasome subunits are shown in the same brain lysates obtained in Fig. 4a. b, Expression of transcripts from representative PSM genes in the livers of the mice described in Fig. 4d,e were measured by qRT-PCR and are presented as mean ± s.e.m relative to fasted controls. (n=4). *p < 0.05 compared to fasted mice, #p < 0.05 compared to refed, vehicle-treated mice. Statistical significance for pairwise comparisons evaluated with a two-tailed Student’s t test.
Extended Data Figure 9. NRF1 and the proteasome influence intracellular amino acid levels and rates of protein synthesis.

a, Tsc2−/− MEFs reconstituted with human TSC2 or empty vector were serum starved for 16 h and treated 1 h with the indicated compound. The total pool of intracellular amino acids was measured and is shown as mean ± s.e.m. of triplicate samples relative to untreated samples (veh). *p < 0.05 or **p < 0.01 compared to vehicle-treated TSC2-expressing cells; #p < 0.05 or ##p < 0.01 compared to vehicle-treated vector-expressing cells. Statistical significance for pairwise comparisons evaluated with a two-tailed Student’s t test. b, Immunoblot control for the experiment shown in Fig. 4g. c,d, Autoradiographs of gels, representative of three independent experiments each, corresponding to the protein synthesis data graphically represented in Fig. 4g and h, respectively. e, Tsc2−/− MEFs were grown in media containing increasing concentrations of amino acids for 16 h in the presence or absence of rapamycin. Immunoblots of lysates are shown. The physiological concentration of amino acids is indicated as 1x and represents the concentration in BME (“Low AAs” in Fig. 4h and panel d), with DMEM being 4x and twice that (8x) being the concentration denoted as “High AAs” in Fig. 4h and panel d.
Extended Data Figure 10. TSC2-deficient MEFs and MCF10As exhibited increased sensitivity to NRF1 knockdown relative to their isogenic wild-type counterparts.
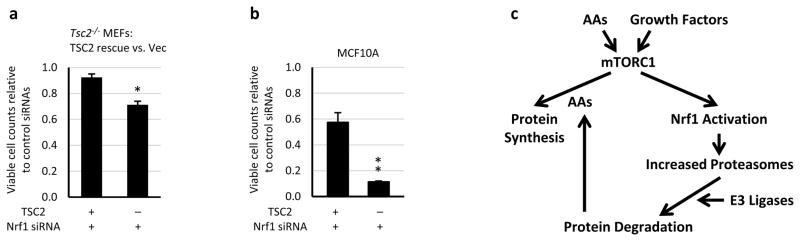
a, b, Viable counts of TSC2-expressing and -deficient a, MEFs and b, MCF10As transfected with siRNAs targeting Nrf1 are shown as mean ± s.e.m. relative to the same cells expressing control siRNAs (n=3 technical replicates, representative of two independent experiments each). a, *P<0.02; b, **p<0.005. a,b, Statistical significance for pairwise comparisons evaluated with a two-tailed Student’s t test. c, Model of the parallel regulation of protein synthesis and degradation by mTORC1 described in this study.
Acknowledgments
We thank I. Ben-Sahra and L. Yang for technical assistance. This work was supported in part by the DOD Tuberous Sclerosis Complex Research Program grant W81XWH-10-1-0861 (B.D.M), NIH grants CA122617 (B.D.M.) and CA120964 (B.D.M. and D.J.K.), the Ellison Medical Foundation (B.D.M.), NSF fellowship DGE-1144152 (S.J.H.R.), and a CIHR fellowship (S.W.).
Footnotes
Supplemental information, including full methods and associated references and supplemental figures and legends, are also included.
Author Contributions: B.D.M. and Y.Z. designed and interpreted the experiments and wrote the manuscript. Y.Z., J.N., J.R.D, S.J.H.R, and S.B.W. performed the experiments. G.S.H. and D.J.K provided key materials and technical guidance.
References
- 1.Dibble CC, Manning BD. Signal integration by mTORC1 coordinates nutrient input with biosynthetic output. Nat Cell Biol. 2013;15:555–64. doi: 10.1038/ncb2763. [DOI] [PMC free article] [PubMed] [Google Scholar]
- 2.Cornu M, Albert V, Hall MN. mTOR in aging, metabolism, and cancer. Curr Opin Genet Dev. 2013;23:53–62. doi: 10.1016/j.gde.2012.12.005. [DOI] [PubMed] [Google Scholar]
- 3.Suraweera A, Munch C, Hanssum A, Bertolotti A. Failure of amino acid homeostasis causes cell death following proteasome inhibition. Mol Cell. 2012;48:242–53. doi: 10.1016/j.molcel.2012.08.003. [DOI] [PMC free article] [PubMed] [Google Scholar]
- 4.Fonseca R, Vabulas RM, Hartl FU, Bonhoeffer T, Nagerl UV. A balance of protein synthesis and proteasome-dependent degradation determines the maintenance of LTP. Neuron. 2006;52:239–45. doi: 10.1016/j.neuron.2006.08.015. [DOI] [PubMed] [Google Scholar]
- 5.Singh R, Cuervo AM. Autophagy in the cellular energetic balance. Cell Metab. 2011;13:495–504. doi: 10.1016/j.cmet.2011.04.004. [DOI] [PMC free article] [PubMed] [Google Scholar]
- 6.Ebato C, et al. Autophagy is important in islet homeostasis and compensatory increase of beta cell mass in response to high-fat diet. Cell Metab. 2008;8:325–32. doi: 10.1016/j.cmet.2008.08.009. [DOI] [PubMed] [Google Scholar]
- 7.Radhakrishnan SK, et al. Transcription factor Nrf1 mediates the proteasome recovery pathway after proteasome inhibition in mammalian cells. Mol Cell. 2010;38:17–28. doi: 10.1016/j.molcel.2010.02.029. [DOI] [PMC free article] [PubMed] [Google Scholar]
- 8.Steffen J, Seeger M, Koch A, Kruger E. Proteasomal degradation is transcriptionally controlled by TCF11 via an ERAD-dependent feedback loop. Mol Cell. 2010;40:147–58. doi: 10.1016/j.molcel.2010.09.012. [DOI] [PubMed] [Google Scholar]
- 9.Duvel K, et al. Activation of a metabolic gene regulatory network downstream of mTOR complex 1. Mol Cell. 2010;39:171–83. doi: 10.1016/j.molcel.2010.06.022. [DOI] [PMC free article] [PubMed] [Google Scholar]
- 10.Radhakrishnan SK, den Besten W, Deshaies RJ. p97-dependent retrotranslocation and proteolytic processing govern formation of active Nrf1 upon proteasome inhibition. Elife. 2014;3:e01856. doi: 10.7554/eLife.01856. [DOI] [PMC free article] [PubMed] [Google Scholar]
- 11.Ozcan U, et al. Loss of the tuberous sclerosis complex tumor suppressors triggers the unfolded protein response to regulate insulin signaling and apoptosis. Mol Cell. 2008;29:541–51. doi: 10.1016/j.molcel.2007.12.023. [DOI] [PMC free article] [PubMed] [Google Scholar]
- 12.Schroder M, Kaufman RJ. The mammalian unfolded protein response. Annu Rev Biochem. 2005;74:739–89. doi: 10.1146/annurev.biochem.73.011303.074134. [DOI] [PubMed] [Google Scholar]
- 13.Rome S, et al. Microarray analyses of SREBP-1a and SREBP-1c target genes identify new regulatory pathways in muscle. Physiol Genomics. 2008;34:327–37. doi: 10.1152/physiolgenomics.90211.2008. [DOI] [PubMed] [Google Scholar]
- 14.Reed BD, Charos AE, Szekely AM, Weissman SM, Snyder M. Genome-wide occupancy of SREBP1 and its partners NFY and SP1 reveals novel functional roles and combinatorial regulation of distinct classes of genes. PLoS Genet. 2008;4:e1000133. doi: 10.1371/journal.pgen.1000133. [DOI] [PMC free article] [PubMed] [Google Scholar]
- 15.Yuan E, et al. Graded loss of tuberin in an allelic series of brain models of TSC correlates with survival, and biochemical, histological and behavioral features. Hum Mol Genet. 2012;21:4286–300. doi: 10.1093/hmg/dds262. [DOI] [PMC free article] [PubMed] [Google Scholar]
- 16.Lee CS, Ho DV, Chan JY. Nuclear factor-erythroid 2-related factor 1 regulates expression of proteasome genes in hepatocytes and protects against endoplasmic reticulum stress and steatosis in mice. FEBS J. 2013;280:3609–20. doi: 10.1111/febs.12350. [DOI] [PMC free article] [PubMed] [Google Scholar]
- 17.Yecies JL, et al. Akt stimulates hepatic SREBP1c and lipogenesis through parallel mTORC1-dependent and independent pathways. Cell Metab. 2011;14:21–32. doi: 10.1016/j.cmet.2011.06.002. [DOI] [PMC free article] [PubMed] [Google Scholar]
- 18.Toth JI, Datta S, Athanikar JN, Freedman LP, Osborne TF. Selective coactivator interactions in gene activation by SREBP-1a and -1c. Mol Cell Biol. 2004;24:8288–300. doi: 10.1128/MCB.24.18.8288-8300.2004. [DOI] [PMC free article] [PubMed] [Google Scholar]
- 19.He TC, et al. A simplified system for generating recombinant adenoviruses. Proc Natl Acad Sci U S A. 1998;95:2509–14. doi: 10.1073/pnas.95.5.2509. [DOI] [PMC free article] [PubMed] [Google Scholar]
- 20.Huang J, Dibble CC, Matsuzaki M, Manning BD. The TSC1-TSC2 complex is required for proper activation of mTOR complex 2. Mol Cell Biol. 2008;28:4104–15. doi: 10.1128/MCB.00289-08. [DOI] [PMC free article] [PubMed] [Google Scholar]
- 21.Kwiatkowski DJ, et al. A mouse model of TSC1 reveals sex-dependent lethality from liver hemangiomas, and up-regulation of p70S6 kinase activity in Tsc1 null cells. Hum Mol Genet. 2002;11:525–34. doi: 10.1093/hmg/11.5.525. [DOI] [PubMed] [Google Scholar]
- 22.Zhang H, et al. Loss of Tsc1/Tsc2 activates mTOR and disrupts PI3K-Akt signaling through downregulation of PDGFR. J Clin Invest. 2003;112:1223–33. doi: 10.1172/JCI17222. [DOI] [PMC free article] [PubMed] [Google Scholar]
- 23.El-Hashemite N, Zhang H, Henske EP, Kwiatkowski DJ. Mutation in TSC2 and activation of mammalian target of rapamycin signalling pathway in renal angiomyolipoma. Lancet. 2003;361:1348–9. doi: 10.1016/S0140-6736(03)13044-9. [DOI] [PubMed] [Google Scholar]
- 24.Cock PJ, et al. Biopython: freely available Python tools for computational molecular biology and bioinformatics. Bioinformatics. 2009;25:1422–3. doi: 10.1093/bioinformatics/btp163. [DOI] [PMC free article] [PubMed] [Google Scholar]
- 25.Zerenturk EJ, Sharpe LJ, Brown AJ. Sterols regulate 3beta-hydroxysterol Delta24-reductase (DHCR24) via dual sterol regulatory elements: cooperative induction of key enzymes in lipid synthesis by Sterol Regulatory Element Binding Proteins. Biochim Biophys Acta. 2012;1821:1350–60. doi: 10.1016/j.bbalip.2012.07.006. [DOI] [PubMed] [Google Scholar]
- 26.Crooks GE, Hon G, Chandonia JM, Brenner SE. WebLogo: a sequence logo generator. Genome Res. 2004;14:1188–90. doi: 10.1101/gr.849004. [DOI] [PMC free article] [PubMed] [Google Scholar]
- 27.Larkin MA, et al. Clustal W and Clustal X version 2.0. Bioinformatics. 2007;23:2947–8. doi: 10.1093/bioinformatics/btm404. [DOI] [PubMed] [Google Scholar]