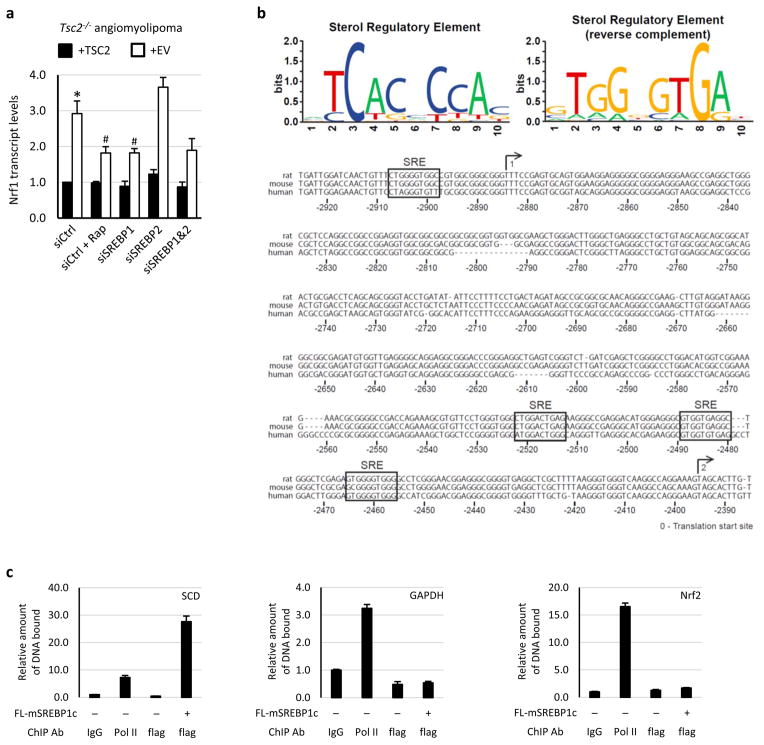
Extended Data Figure 7. mTORC1 activates NRF1 gene expression through SREBP1.
a, The same experiment shown in Fig. 3c, except with human TSC2−/− angiomyolipoma cells reconstituted with human TSC2 or empty vector (EV). Data are shown as the means ± s.e.m. (n = 3). *p < 0.05 compared to TSC2-expressing cells transfected with control siRNAs; #p < 0.05 compared to vector-expressing cells transfected with control siRNAs. Statistical significance for pairwise comparisons evaluated with a two-tailed Student’s t test. b, Consensus sterol regulatory elements (SREs) are conserved in the promoters of the human and rodent NRF1 genes. Forward (top left) and reverse (top right) position weight matrices based on SREs of twenty established SREBP targets are shown and were used to find putative SREs in the NRF1 promoter. The human, mouse and rat NRF1 promoters are aligned and numbered with their distance from the conserved translation start site. The two possible transcription start sites are depicted with a numbered arrow above the aligned sequences. Four SREs were found to be conserved in all three promoters in the region of these start sites. c, In the same samples described in Fig. 3f, ChIP analysis for SREBP1c and Pol II promoter occupancy of the given genes was performed using HEK293 cells expressing flag-tagged mature SREBP1c or empty vector. Known SREBP1 target sites on SCD served as a positive control, with GAPDH and NFE2L2/NRF2 promoters as negative controls. Data were normalized to the levels of bound DNA in control IgG IPs and are shown as mean ± s.e.m (n=3).

