

Abstract
Type I IFNs are a family of cytokines with antiviral and immunomodulatory properties. While the antiviral effects of IFNs are well characterized, their immunomodulatory properties are less clear. To specifically address the effects of type I IFNs on Treg, we studied mixed bone morrow (BM) chimeras between wild-type (WT) and IFNα/βR (IFNAR) knockout (KO) mice, and heterozygous female mice expressing a Treg-specific deletion of the IFNAR. In these two models, IFNAR signaling promotes the development of the Treg lineage in the thymus and their survival in the periphery. IFNAR KO Treg had a higher expression of the pro-apoptotic gene Bim and higher frequency of active caspase positive cells. IFNAR KO Treg from chimeric mice displayed a more naïve phenotype, accompanied by lower levels of CD25 and phosphorylated STAT5. Therefore, in Treg IFNAR signaling may directly or indirectly affect phosphorylation of STAT5. In mixed chimeras with Scurfy fetal liver, Treg derived from IFNAR KO BM were unable to control T effector cell activation and tissue inflammation. Under stress conditions or in a competitive environment, IFNAR signaling may be required to maintain Treg homeostasis and function.
Introduction
Type I IFNs are a family of cytokines that possess diverse properties. Type I IFNs, consisting of multiple IFNα subtypes and a single IFNβ subtype, are derived from a single ancestral gene and are structurally related (1). They bind to a common receptor, IFNα/β receptor (IFNAR), which is expressed on most cell types (2). IFNAR consists of two subunits, IFNAR 1 and IFNAR 2, and is associated with Janus protein tyrosine kinases (Tyk2 for IFNAR 1 and Jak1 for IFNAR2) (3, 4). Signaling through IFNAR induces a cascade of protein phosphorylation (STAT1 and STAT2) that recruits the IFN regulatory factor 9 (IRF-9) to form the heterotrimeric complex, IFN-stimulated gene factor 3 (ISGF3) (5). ISGF3 translocates to the nucleus and binds to IFN-stimulated response elements (ISRE) to initiate the transcription of IFN gene (6, 7).
Type I IFNs were initially defined by their antiviral properties, but are also potent immunomodulators that can act directly on components of the innate and adaptive immune systems. Type I IFN, acting directly on T cells, can modulate their activation and/or survival (8, 9). It was reported that treatment with IFNα/β in vitro prolonged the survival of activated T cells and increased clonal expansion and effector differentiation of CD8+ T cells (10–13). Similarly, Type I IFNs were required in vivo for clonal expansion of antigen specific CD4+ and CD8+ T cells during T cell priming (14, 15). Given the diverse effects of IFNα/β in the innate and adaptive immune system, it is not surprising that these cytokines play a role in several autoimmune diseases. Psoriasis and systemic lupus erythematosus are improved by the inhibition of Type I IFNs (16, 17), while arthritis and multiple sclerosis benefit from the administration of Type I IFNs (18). Although the associations between Type I IFN and these diseases are established, the mechanisms responsible for the differential effects of IFN have not yet been elucidated.
A number of recent studies have examined the role of Type I IFNs on Foxp3+ T regulatory (Treg) cells in different experimental models of autoimmunity and inflammation and reached conflicting conclusions. In the classic adoptive transfer model of inflammatory bowl disease (IBD), one study (19) demonstrated that signaling via the IFNAR was essential for maintenance of Foxp3 expression and Treg suppressor function, while a second study (20) demonstrated that IFNAR knockout (KO) Treg were fully competent suppressor cells. Similarly, the transfer of the combination of wild-type (WT) CD45RBhi and WT Treg, but not IFNAR KO CD45RBhi and IFNAR KO Treg, induced colitis in RAG KO Trex 1 KO mice that express high levels of endogenous cytoplasmic DNAs that trigger type I IFN production. Development of disease depended on expression of the IFNAR on the WT effector cells, and not on the Treg, as IFNAR KO Teff cells did not cause disease (21). In contrast, in the tumor microenvironment, signaling via the IFNAR was required for the activation of tumor infiltrating Tregs to produce IL-10 resulting in suppression of angiogenesis and lymphoangiogenesis induced by tumor infiltrating Th17 cells (22). Lastly, a recent study (23) demonstrated that type I IFNs directly inhibit Treg cell activation, proliferation, and function in vivo during acute infection with lymphocytic choriomeningitis virus (LCMV) and that a failure of this inhibitory effect results in impaired function of virus specific CD4+ and CD8+ T cells and defective viral clearance.
Taken together, these studies suggest that the effects of Type I IFNs on Tregs are complex and likely context dependent. Here, we have examined the effects of type I IFNs on Treg homeostasis and suppressor function. We demonstrate that Type I IFNs are essential for the development, survival, and function of Tregs in a competitive or stressed environment.
Materials and Methods
Mice
WT C57BL/6, Mx1-Cre, Rosa/eYFP, Foxp3YFP-Cre and Scurfy mice were obtained from Jackson Laboratories (Bar Harbor, ME). Congenic C57BL/6 (CD45.1), IFNAR KO, and RAG1 KO mice were obtained from Taconic Farms (Germantown, NY). IFNARfl/fl mice were kindly provided by (Ulrich Kalinke, Paul-Ehrlich Institut, Langen, Germany) and crossed to Foxp3YFP-Cre. All other mice were bred in house. The Animal Care and Use Committee (ACUC) of the National Institute of Allergy and Infectious Diseases (NIAID) approved all experiments.
Bone morrow (BM) chimeras
Recipient mice were lethally irradiated with two doses of 550 Rads of total body irradiation. Recipients were injected i.v on the same d with BM cells (1×10⁶) or fetal liver cells (2 × 10⁵) from donor mice and allowed to reconstitute for 6 to 8 weeks. The fetal liver cells were obtained at 15 d gestation; the cells were screened for the Scurfy mutation by PCR.
Flow cytometry and cell sorting
A single cell suspension was generated from spleens or thymus. Cell surface staining was performed with the following directly conjugated anti–murine antibodies (from BD Bioscience or eBioscience unless otherwise specified): anti-CD4 (RM4-5), -CD8 (53-6.7), -CD19 (1D3), -CD25 (7D4), -CD44 (IM7), -CD45.1 (A20), -CD45.2 (104), -CD62L (MEL-14), -CD69 (H1.2F3), -CD101 (IGSF2), -CD103 (2E7), -ICOS (7E.17G9). For intracellular staining, cells were surface stained and then permeabilized with FixPerm buffer (eBioscience). Cells were then washed and stained with antibodies against Foxp3 (FJK-16s), -GFP (life Technology). For IFNγ (XMG1.2) staining, cells were stimulated for 4 hours with cell stimulation cocktail plus protein transport inhibitor (eBioscience) and stained intracellularly. A kit to detect active pan-caspase was purchased from eBioscience. 1×10⁶/ml splenocytes were stained with FITC-Z-VAD-FMK or APC-Z-VAD-FMK for 45 minutes in a 37°C incubator with 5% CO2. The data were acquired on an LSRII instrument (BD Bioscience) and analyzed using FlowJo software (TreeStar). For cell sorting experiments, cells were labeled with anti-CD4 (L3T4) beads and purified on the AutoMACS Cell Separator (Miltenyi Biotec), stained for desired cell surface markers, and sorted using a FACSAria flow cytometers (BD Biosciences).
Phospho STAT staining
To assess phosphor (p) STAT5 levels directly ex vivo, spleens were immediately disrupted and fixed with Cytofix/Cytoperm buffer (BD). After incubation for 12 min in a 37°C incubator with 5% CO2, the cells were washed, resuspended in 1ml Perm Buffer II (BD), and incubated on ice for 30 min. After an additional wash, cells were stained for surface and intracellular antigens, including pSTAT5 (pY694; Cell Signaling Technology) or pSTAT1 (pY701; CST), for 45 min on ice. In some experiments, cells were stimulated with different concentrations of mouse IFNβ (PBL Interferon Source) and mouse IFNα2 (eBioscience) for 15 min.
BrdU staining
Mice were injected with 1mg BrdU i.p. and sacrificed 24h later. BrdU incorporation was detected in splenocytes using BrdU Flow kit (BD Bioscience) and Ki-67 staining was performed with Flow kit (BD Bioscience).
ELISA
Mice were injected i.p. with 100μg of the synthetic double-stranded RNA homolog poly (I:C) (InvivoGen) and sacrificed 24h later. The IFNα level was measured in serum using a Mouse IFNα ELISA kit (PBL Interferon Source).
mRNA isolation, cDNA production, and real-time PCR
RNA extraction was performed using RNeasy columns (QIAGEN), and cDNA was generated using iScript cDNA synthesis kit (BIO-RAD) according to the manufacturer’s instructions. Pre-synthesized Taqman Gene Expression Assays (Applied Biosystems) were used to amplify Bim (Mm00437796_m1), Bcl-2 (Mm00477631_m1), PUMA (Mm00519268_m1), Bax (Mm00432051_m1), Mcl-1 (Mm00725832_s1), Bcl-xL (Mm00437783_m1), Bad (Mm00432042_m1), and Bak-1 (Mm00432045_m1). Actb was used as an internal control, and target gene values are expressed relative to Actb. Real-time PCR was conducted with the ABI Prism 7900HT, using TaqMan Universal PCR Master Mix (Applied Biosystems).
IL-2 immune complex treatment
WT + IFNAR KO chimeras and IFNARfl/fl x Foxp3YFP-Cre/YFP-Cre mice were treated with IL-2 immune complexes, as previously described (24). Briefly, IL-2/anti–IL-2 mAb complexes were prepared by mixing recombinant murine IL-2 (1μg; PeproTech) with JES6-1 (5 μg) at the optimal 1:2 molar ratio and incubated for 10 min at room temperature. Immune complexes were then diluted in PBS and injected i.p. for 5 d consecutively. Expansion of T cells was assessed 2h after the last injection in the spleen and the thymus.
Hematoxylin and eosin (H&E) staining
Organs were fixed in 10% neutral buffered formalin (SIGMA) for 24h and then transferred to a solution of 70% ethanol. Fixed tissue were embedded in paraffin and stained with hematoxylin and eosin by American Histolabs (Gaithersburg, MD).
Statistical Analysis
Data were statistically analyzed, as indicated in the figure legends using GraphPad Prism. Values were considered statistically significant when P < 0.05. All data are presented as the mean values ± SD.
Results
Treg respond to Type I IFN in vitro and in vivo
The ability of both CD4+ and CD8+ T effector (Teff) cells to respond to Type I IFN is well established (25, 26), but the role of Type I IFN in Treg function remains poorly understood. While all cells express the IFNAR and can potentially respond to type I IFNs, we initially assessed the ability of Treg to directly respond to Type I IFN ex vivo by measuring the phosphorylation of STAT1 following a 15-min stimulation with recombinant IFN-α2 or IFN-β. The response of Treg was similar to CD4+ and CD8+ Teff over a range of cytokine concentrations (data not shown).
We then addressed a potential role for Type I IFN signaling in Treg function by assessing the relative ability of different T cell subpopulations to respond to Type I IFN in vivo. Injection of mice with the synthetic double-stranded RNA homolog poly (I:C) has been shown to induce large amounts of Type I IFN in a Toll-like receptor-3-dependent manner (27). Previous studies have shown that stimulation of lymphocytes with Type I IFN rapidly induces the expression of CD69 (28, 29). We initially measured CD69 expression on various T lymphocyte subpopulations 24h following poly (I:C) injection as a readout for the response to Type I IFN. CD4+, CD8+ and CD4+Foxp3+ T cells uniformly expressed high levels of CD69 (Fig. 1A) following treatment of the mice with poly (I:C). As a negative control, CD69 up-regulation was not observed in any cell population following treatment of IFNAR KO mice with poly (I:C) (data not shown). IFNα was detected in the serum at 24h following poly (I:C) injection, but not 72h after injection indicating that the secretion of IFNα was transient with this dose of poly (I:C) (Fig. 1B).
FIGURE 1. WT Treg respond to Type I IFN in vivo.
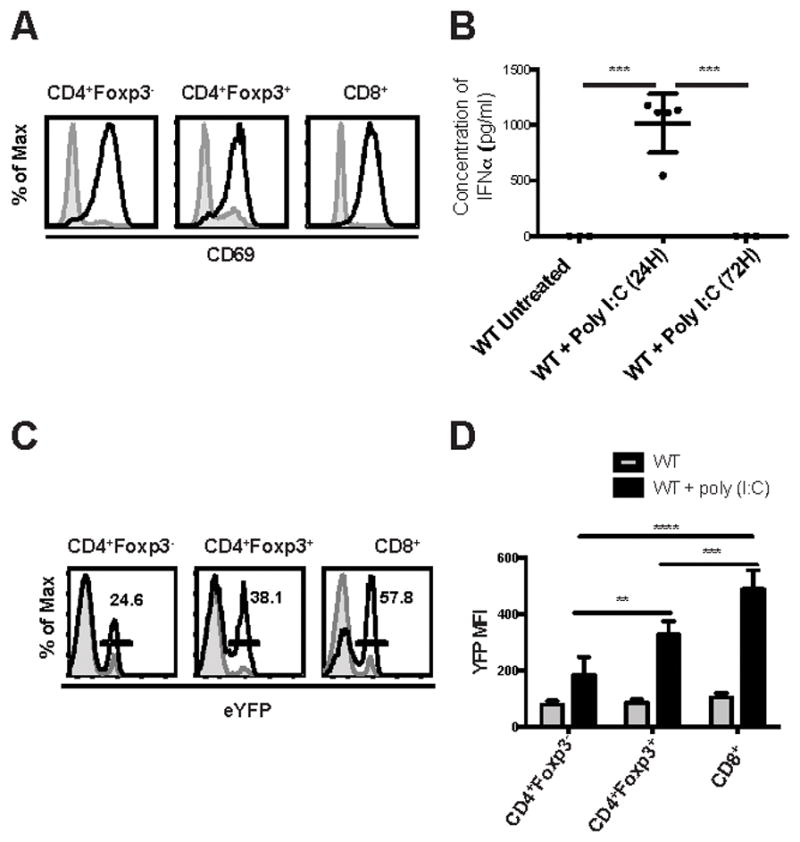
WT C57BL/6 and Mx-1/Cre x ROSA/eYFP mice were injected with poly (I:C). (A) WT mice were sacrificed 24 h later, and spleen cells from non-injected (shaded histogram) and injected (black line) mice were analyzed by flow cytometry (n=5) for expression of CD69 on CD4+Foxp3-, Foxp3+, and CD8+. (B) The concentration of IFNα was measured by ELISA in the serum of mice treated or not with poly (I:C) at 24 h and 72 h (each symbol represents data from 1 animal). (C) Mx-1/Cre x ROSA/eYFP mice were injected with poly (I:C) every other day for 5 days and sacrificed two days later. Spleen cells from non-injected (shaded histogram) and injected (black line) mice were analyzed by flow cytometry (n=5) for expression of eYFP gated on CD4+Foxp3-, Foxp3+, and CD8+. (D) The average MFI of eYFP expression on T cells. Data in (B) were analyzed by one-way ANOVA with P value = 0.0002. Data in (D) were analyzed by two-way ANOVA. *** P < 0.0001. Data are representative of one experiment from three independent experiments with 3 to 5 mice per group. Error bars in all panels represent the mean ± SD.
Finally, we generated mice in which cells that had responded to Type I IFN could be identified by detection of a fluorescent marker. We crossed mice expressing the Cre-recombinase under the control of the Mx-1 gene promoter to mice expressing a LoxP-Stop-LoxP-eYFP cassette inserted into the ROSA26 gene locus (termed Mx-1/Cre x ROSA/eYFP). Because Mx-1 is a Type I IFN inducible gene (30), cells that have responded to Type I IFN will excise the stop codon and be permanently marked by eYFP expression. Injection of poly (I:C) into Mx-1/Cre x ROSA/eYFP mice resulted in eYFP expression in all T cell subpopulations (Fig. 1C). In this assay, the highest level of induction of YFP expression was seen in CD8+ (57%) T cells, but Foxp3+ Treg (38%) responded to a greater extent than CD4+Foxp3- (25%) T cells, suggesting that Treg may be more sensitive to Type I IFN in this model. The average MFI for eYFP expression was also significantly different (Fig. 1D).
Treg from WT, IFNAR KO and IFNARfl/fl x Foxp3YFP-Cre/YFP-Cre are similar in terms of phenotype and number
We next compared the numbers and phenotype of Treg in WT, IFNAR KO and IFNARfl/fl x Foxp3YFP-cre/YFP-cre mice. All strains had equal percentages of splenic CD4+ T cells that expressed the Treg markers CD25 and Foxp3 (Fig. 2A), and the absolute numbers of Treg were also similar (Fig. 2B). The absolute numbers of Treg were also similar in the thymus of these mice (Fig. 2C). Furthermore, Treg from WT and IFNARfl/fl x Foxp3YFP-cre/YFP-cre mice were similar in terms of the levels of expression of various other T cell markers (namely, CD44, CD62L, CD69, CD101, CD103, ICOS, CD25 and pSTAT5) (Fig. 2D). Since type I IFNs may regulate the survival of CD4+ and CD8+ T cells, we also compared the expression of several pro- and anti- apoptotic genes (Bim, Puma, Bax, Bad, Bak-1, Bcl-2, Bcl-xL, and Mcl-1 (31) in WT Treg and Treg with a selective deletion of the IFNAR. The only significant difference observed was that IFNAR KO Treg had elevated levels Bim expression (Fig. 2E) raising the possibility that the elevated levels of Bim may increase the susceptibility of these cells to apoptosis.
FIGURE 2. Treg from WT, IFNAR KO and IFNARfl/fl x Foxp3YFP-Cre/YFP-Cre are similar in terms of phenotype and number.

(A) Spleen cells from WT, IFNAR KO, IFNARfl/fl and IFNARfl/fl x Foxp3YFP-Cre/YFP-Cre were isolated, and CD4+ T cells were analyzed for Foxp3 and CD25 expression by flow cytometry. (B) Absolute number of CD4+Foxp3+ T cells per spleen/mouse. (C) Absolute number of CD4+Foxp3+ T cells per thymus/mouse. (D) Expression of activation markers CD44, CD62L, CD69, CD103, CD101, ICOS, CD25 and pSTAT5 gating on splenic CD4+Foxp3+ cells from WT (shaded histogram) and IFNARfl/fl x Foxp3YFP-Cre/YFP-Cre (black line) mice. Dashed lines are isotype control for pSTAT5 staining. (D) Relative expression of apoptotic genes in sorted CD4+CD25+ Treg from IFNARfl/fl and IFNARfl/fl x Foxp3YFP-Cre/YFP-Cre (Data are representative of three biological replicates with 5 mice each time). Statistical significance was determined using two-way ANOVA. **** P < 0.0001. Data are representative of one experiment from three independent experiments with 5 mice per group. Error bars in all panels represent the mean ± SD.
IFNAR KO Tregs are at a competitive disadvantage in a mixed BM chimera
We set up a model to test the fitness of IFNAR KO Treg in a competitive environment using mixed BM chimeras. We reconstituted lethally irradiated RAG KO mice with an equal mixture of IFNAR KO and WT BM cells that could be differentiated by a congenic marker. Control mice were reconstituted with two congenically marked WT BM populations. When we examined the thymus of chimeric mice 8 weeks after reconstitution, we noted a decrease in the ratio (< 1) of IFNAR KO T cells to WT T cells in all T cell compartments (double positive, CD4+Foxp3+, CD4+Foxp3- single positive (SP), and CD8+ SP thymocytes) indicating that the reduction in IFNAR KO T cells was not Treg-specific (Fig. 3A). In the spleen of the WT (CD45.2) + WT (CD45.1) chimeric mice, equal levels of reconstitution were seen in all lymphocyte compartments (Fig. 3B). In the IFNAR KO (CD45.2) + WT (CD45.1) reconstituted mice, all cell populations were significantly skewed toward WT (indicated by a ratio < 1). The average level of skewing for total splenocytes, B cells, CD4+, and CD8+ was approximately 2-fold. However, IFNAR KO Treg were underrepresented by ~8-fold compared to WT Treg in these same mice. Taken together, these results suggest that type I IFNs play a role in the development of all T cell subpopulations in the thymus and also play a major role in the survival of Treg in the periphery in the competitive environment of the mixed chimera.
FIGURE 3. IFNAR KO Tregs are at a competitive disadvantage in a mixed BM chimera.

RAG KO mice were lethally irradiated and reconstituted for 8 weeks with a 1:1 mixture of WT and IFNAR KO congenically marked BM. (A) Thymic cells from CD45.1 WT+CD45.2 WT (black dots) and CD45.1 WT+CD45.2 IFNAR KO (white dots) chimera were stained for CD4+CD8+, CD4+Foxp3-, CD4+Foxp3+, and CD4-CD8+. The graph represents the ratio of CD45.2 WT or IFNAR KO to CD45.1 WT (each dot represents 1 mouse). (B) Spleen cells were also stained for B cells (CD19+) and CD4+Foxp3-, CD4+Foxp3+, and CD8+ T cells and the ratio of CD45.2 WT or IFNAR KO CD45.1 was determined. (C) Active pan-caspase activity was measured by staining with a FITC-labeled general caspase inhibitor (Z-VAD-FMK) on CD4+Foxp3-, CD4+Foxp3+ and CD8+ cells. Black dots represent WT cells and white dots IFNAR KO cells (each dot represents a single chimeric mouse). (D) Relative expression of apoptotic genes in sorted CD4+CD25+ Treg from WT and IFNAR KO mixed chimeras (Data are representative of three biological replicates with 10 mice each time). (E) Expression of activation markers CD44, CD62L, CD69, CD103, CD101, ICOS, CD25 and pSTAT5 on WT (shaded histogram) and IFNAR KO (black line) gated splenic CD4+Foxp3+ T cells. Dashed lines are isotype control for pSTAT5 staining. (F) Average MFI expression of different markers of activation on CD4+Foxp3+ cells from WT + IFNAR KO chimera. (G) Chimeric mice were injected with 1 mg BrdU 24h prior to sacrifice. Level of BrdU incorporation and Ki-67 positivity were determined in CD4+Foxp3+ CD45.1WT and CD45.2 IFNAR KO in the spleen. Statistical significance was determined using two-way ANOVA. ** P ≥ 0.001, *** P ≥ 0.0001, **** P < 0.0001. Data are representative of one experiment from at least three independent experiments with 5 to 8 mice per group. Error bars in all panels represent the mean ± SD.
To further analyze the mechanisms responsible for the decreased survival of the IFNAR KO Treg, we measured the level of apoptosis directly ex vivo in the various T cell compartments of the chimeric mice. We measured active pan-caspase activity in cells by staining with a FITC-labeled general caspase inhibitor (Z-VAD-FMK). IFNAR KO Treg had a significantly higher percentage of active pan-caspase positive cells than WT Treg in the same chimeric mouse (Fig. 3C). Importantly, the percentages of active pan-caspase positive cells WT CD4+ and CD8+ T cells and IFNAR KO CD4+ and CD8+ T cells in these same mice were similar, suggesting that IFNAR KO Treg were unique in their requirement for Type I IFN signaling in the periphery. As it has recently been shown that Treg require the anti-apoptotic factor Mcl-1 in a Treg repopulation model following diphtheria toxin-induced depletion (32), we also tested the expression of a panel of pro- and anti- apoptotic molecules. The only difference observed between the WT and IFNAR KO Treg isolated from the chimeric mice was that IFNAR KO Treg expressed higher levels of the pro-apoptotic gene, Bim. This result is similar to that seen in Treg derived from the parental IFNAR KO mice (Fig. 3D).
As major pro-survival effects of Type I IFN signaling on Teff are mediated during the process of T cell activation (13) and Treg display an activated phenotype in naïve mice based on CD44 expression, we evaluated the possibility that the pronounced underrepresentation of IFNAR KO Treg in the chimeric environment was secondary to preferential death of activated Treg. IFNAR KO Treg displayed a more naïve phenotype with lower levels CD44 and higher levels CD62L expression than WT Treg. Furthermore, the percentages of IFNAR KO Treg expressing the activation markers CD69, CD101, CD103 and ICOS were also lower than WT Treg. Most importantly, IFNAR KO Treg expressed lower levels of CD25 and displayed markedly lower levels of pSTAT5 (Fig. 3E). The average MFI was also significantly different for the markers of activation, demonstrating a more naïve phenotype of IFNAR KO cells in the chimeras (Fig. 3F). The decreased survival of the IFNAR KO Treg was not compensated by an increase in homeostatic proliferation, as the levels of Ki-67 staining and BrdU incorporation were identical in WT and IFNAR KO Treg derived from the chimeric mice (Fig. 3G). Collectively, these studies are consistent with a requirement for a type I IFN mediated signal which is required for the survival of activated Treg in the competitive environment and it also raises the possibility that IFNAR KO Treg that develop in a chimeric environment may be functionally defective.
IFNARfl/fl x Foxp3YFP-Cre/WT Treg display the same development and survival defect as IFNAR KO Treg from the chimeric mice
One problem with interpretation of the above studies is that they were performed in irradiated chimeras. To further examine the phenotype of the IFNAR KO Treg under more physiologic conditions, we crossed female IFNARfl/fl x Foxp3YFP-Cre/YFP-Cre mice to male IFNARfl/fl x Foxp3WT/WT mice to produce heterozygous IFNARfl/fl x Foxp3YFP-Cre/WT female mice. As genes on the X chromosome are subject to random inactivation of one allele, female mice that are IFNARWT/WT and heterozygous for YFP-Cre have 50% of Treg cells that use the WT allele and 50% of Treg cells that use the Foxp3YFP-cre allele and thus, are marked by YFP in both the thymus and peripheral lymphoid tissues (Fig. 4A, B). A marked defect in the development of IFNAR KO (YFP+) Treg in the thymus of IFNARfl/fl x Foxp3YFP-Cre/WT mice was observed (Fig. 4A). Similarly, in secondary lymphoid tissues, IFNAR KO (YFP+) Tregs represented only ~20% of total Tregs as early as 2 mo of age (Fig. 4B). Thus, in this competitive, but physiologically normal, environment a marked defect in Treg cell development and/or survival was seen in the absence of type I IFN signaling. Survival of IFNAR KO Treg in the periphery was also impaired as IFNAR KO (YFP+) Treg had a significantly higher percentage of active pan-caspase positive cells than WT (YFP-) Treg in the same mouse and the increase in cell death was also associated with higher level of Bim expression (Fig. 4C). Similar to the results seen in the mixed chimera studies, IFNAR KO Treg in the heterozygous female mice displayed a more naïve phenotype with lower levels of CD44 and higher levels of CD62L expression and lower levels of CD101 and ICOS expression. Lower levels of CD25 and markedly lower levels of pSTAT5 were also seen in the IFNAR KO Treg (Fig. 4D). The average MFI expression was significantly different for CD44, CD62-L, and pSTAT5 demonstrating a more naïve phenotype of IFNAR KO cells in the heterozygous females (Fig. 4E).
FIGURE 4. IFNARfl/fl x Foxp3YFP-cre/wt Treg display the same development and survival defect as IFNAR KO Treg from the chimeric mice.

(A) Thymic and (B) spleen cells were isolated from IFNARfl/fl x Foxp3YFP-cre/wt and IFNARWT/WT x Foxp3YFP-Cre/WT female mice, and CD4+ T cells were analyzed for YFP and Foxp3 expression by flow cytometry (left). Graph displays the absolute number of Foxp3+ cells (right) from YFP- WT and YFP+ IFNAR KO. (C) Active pan-caspase activity was measured (left) by staining with an APC-labeled general caspase inhibitor on YFP- WT (black dots) and YFP+ IFNAR KO (white dots) Treg cells (each dot represents a single mouse). Relative expression of apoptotic gene Bim in sorted CD4+CD25+ Treg from YFP- WT and YFP+ IFNAR KO Treg (right) (Data are representative of three biological replicates with 5 mice each time). (D) Expression of activation markers CD44, CD62L, CD69, CD103, CD101, ICOS, CD25 and pSTAT5 on YFP- WT (shaded histogram) and YFP+ IFNAR KO (black line) gated splenic CD4+Foxp3+ T cells. Dashed lines are isotype control for pSTAT5 staining. (E) Average MFI expression of different markers of activation on CD4+Foxp3+ cells from IFNARfl/fl x Foxp3YFP-cre/wt mice. Data in (A), (B), and (C) were analyzed by unpaired Student t tests. ** P ≥ 0.001, **** P < 0.0001. Data in (E) were analyzed by two-way ANOVA. ** P ≥ 0.001, **** P < 0.0001. Data are representative of one experiment from three independent experiments with 5 to 6 mice per group. Error bars in all panels represent the mean ± SD.
IFNAR KO Treg fail to control T cell activation and tissue inflammation in a Scurfy disease model
We assessed the function of IFNAR KO Treg in an autoimmune disease model by testing their capacity to rescue the Scurfy disease phenotype. Scurfy mice lack Treg because of a mutation in foxp3 and are known to develop a fatal lymphoproliferative syndrome with multi-organ inflammation (33, 34). The Scurfy disease phenotype can be induced in adult mice by transfer of fetal liver cells from a d 15 Scurfy fetus into lethally irradiated RAG KO mice. Co-transfer of a source of functional Treg (e.g. WT BM) controls disease development in this model. We therefore compared the capacity of CD45.1 WT and CD45.1 IFNAR KO BM to prevent disease when co-transferred with CD45.2 scurfy fetal liver cells. After 4 weeks of reconstitution, splenocytes were stained for CD44 to measure the overall level of T cell activation. The levels of CD44 expression were high on CD4+ and CD8+ T cells in the group that received Scurfy fetal liver cells alone (Fig. 5A). Reconstitution with WT BM prevented this level of Teff cell activation, but reconstitution with IFNAR KO BM failed to control the Teff cell activation. Surprisingly, the absolute numbers of Treg were similar in the groups reconstituted with WT or IFNAR KO BM (Fig. 5B). Using congenic markers we were able to distinguish between the effectors derived from the Scurfy and WT or IFNAR KO donors. IFNAR KO Tregs were much less efficient at controlling the expansion of Scurfy cells (Fig. 5C). Mice reconstituted with IFNAR KO BM also exhibited higher levels of inflammation in liver and lung (Fig. 5D). Although this result is consistent with a functional defect of the IFNAR in Treg, interpretation of the experiment is confounded because the Teff cells also lack expression of the IFNAR. To demonstrate a specific defect of the IFNAR in Treg, we co-transferred Scurfy fetal liver with BM from IFNARfl/fl x Foxp3YFP-cre/YFP-cre mice (Fig. 5E). Treg with a conditional deletion of the IFNAR were also much less efficient in controlling Teff cell activation in the chimera as measured by CD44 expression, by expansion of CD4+ or CD8+ Teff cells or by suppression of IFNγ production (Fig. 5F, G) even though the absolute number of Foxp3+ T cells was the same in mice reconstituted with WT and IFNAR KO Treg (Fig. 5H).
FIGURE 5. IFNAR KO Treg fail to control T cell activation and tissue inflammation in a Scurfy disease model.

RAG KO mice were lethally irradiated and reconstituted with Scurfy fetal liver cells alone or with a mixture of Scurfy fetal liver and WT, IFNAR KO or IFNARfl/fl x Foxp3YFP-Cre/YFP-Cre BM. (A) Spleen cells were isolated from the three chimeras (Scurfy alone, Scurfy+WT and Scurfy+IFNAR KO), and CD44 expression was measured on CD4+ and CD8+ T cells. (B) Absolute number of CD4+Foxp3+ cells from Scurfy+WT and Scurfy+IFNAR KO chimeras (C) Absolute number of CD4+Foxp3- and CD8+ Scurfy cells in the three different groups. (D) Representative H&E staining of transverse-sections of liver and lung (original magnification X20, bars 50 μm). (E) Spleen cells were isolated from the three chimeras Scurfy alone, Scurfy+WT and Scurfy+IFNARfl/fl x Foxp3YFP-Cre/YFP-Cre, and CD44 expression was measured on CD4+ and CD8+ T cells (F) Total number of CD4+Foxp3- and CD8+. (G) Spleen cells were stimulated for 4h, and percentage of IFNγ+ cells was measured on CD4+Foxp3- and CD8+ cells. (H) Absolute number of CD4+Foxp3+ cells from Scurfy+WT and Scurfy+IFNARfl/fl x Foxp3YFP-Cre/YFP-Cre chimeras. Statistical significance was determined using two-way ANOVA. ** P ≥ 0.001, *** P ≥ 0.0001, **** P < 0.0001. Data are representative of one experiment from at least three independent experiments with 5 mice per group. Error bars in all panels represent the mean ± SD.
IFNAR KO Treg fail to phosphorylate STAT5 following exposure to poly (I:C)
One of the most prominent abnormalities of the IFNAR KO Treg derived from either mixed BM chimeras or from heterozygous female mice was a decrease in the basal level of pSTAT5 and CD25. It was also of interest to determine if a similar abnormality existed in the Scurfy treatment model in which the absolute numbers of Treg were similar in mice reconstituted with WT or IFNAR KO BM or BM from mice with a Treg-specific deletion of the IFNAR (Fig. 5B, F). Expectedly, Treg derived from Scurfy chimeras reconstituted with IFNAR KO BM or BM from IFNARfl/fl x Foxp3YFP-cre/YFP-cre donors both displayed lower levels of pSTAT5 and CD25 when compared to Treg from mice reconstituted with WT BM (Fig. 6A, B).
FIGURE 6. IFNAR KO Tregs have diminished pSTAT5 and CD25 expression in Scurfy disease model.

(A–B) Spleen cells from Scurfy+WT (shaded histogram) and Scurfy+IFNAR KO (A) and Scurfy+IFNARfl/fl x Foxp3YFP-Cre/YFP-Cre (black line) (B) were isolated, and CD4+Foxp3+ cells were analyzed for ex vivo pSTAT5 and CD25. Dashed lines are isotype control for pSTAT5 staining. Data are representative of one experiment from three independent experiments with 5 mice per group.
STAT1 and STAT2 are the most important mediators of the response to Type I IFNs. However, type I IFNs can also activate both STAT3 and STAT5 (35–37). We initially assessed the ability of Treg to directly phosphorylate STAT5 ex vivo following a 15-min stimulation with different concentration of recombinant IFN-β. We were not able to detect any difference in the levels of pSTAT5 on WT or IFNAR KO Tregs (data not shown). We then directly tested whether type I IFNs might mediate STAT5 phosphorylation in vivo by injecting both WT and IFNAR KO mice with poly (I:C) and measured the levels of pSTAT5 on Treg 6h later. Although the basal level of STAT5 phosphorylation was identical in Treg derived from WT or IFNAR KO mice when injected with PBS (Fig. 7A), a marked increase in pSTAT5 was seen in WT Treg, but not in IFNAR KO Treg following injection with poly (I:C) (Fig. 7B). WT, but not IFNAR KO Treg were able to phosphorylate STAT1 following poly (I:C) injection. Taken together, these results suggest that under certain conditions in vivo, type I IFNs can augment the ability of Treg to respond to IL-2, and positively modulate the survival and function of Treg.
FIGURE 7. WT Treg phosphorylate STAT5 following poly (I:C) injection.
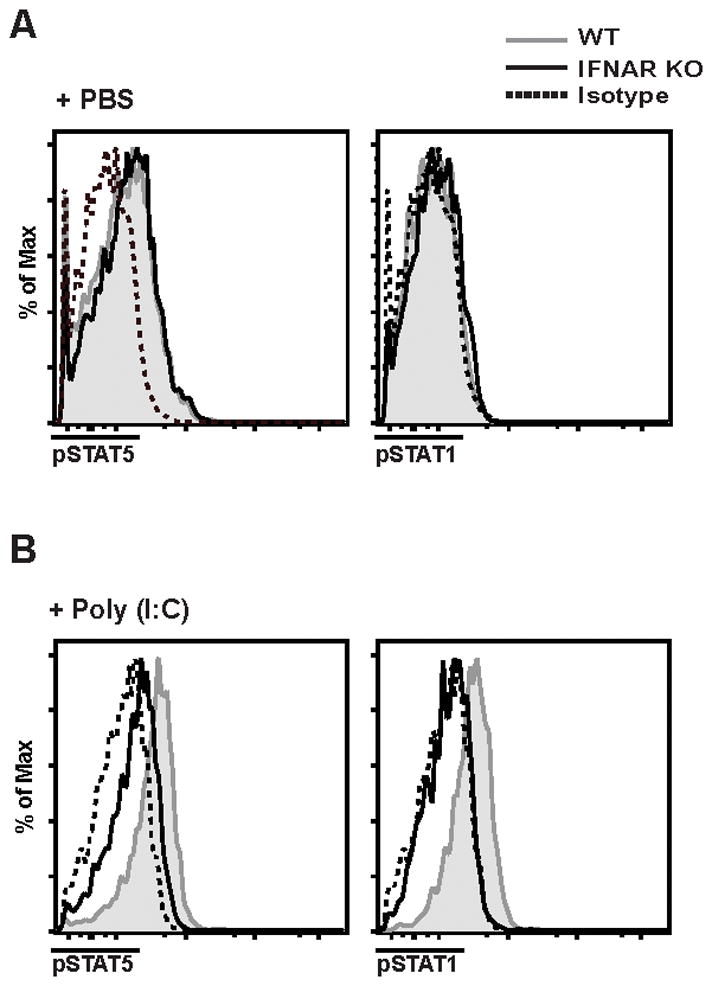
Spleen cells from WT (shaded histogram) or IFNAR KO (black line) mice injected with PBS (A) or with Poly (I:C) (B) were isolated, and CD4+Foxp3+ cells were analyzed ex vivo for pSTAT1 and pSTAT5. Dashed lines are isotype control for pSTAT5 staining from respective mice. Data are representative of one experiment from three independent experiments with 4 mice per group.
IFNAR KO Treg cells expand following IL-2 immune complex treatment in the thymus, but not in the spleen
As the defective homeostasis of IFNAR KO Treg appeared to be secondary to a decrease in the activation of STAT5, we next evaluated whether treatment with IL-2 immune complexes in vivo could rescue the defective survival of IFNAR KO T cells in WT + IFNAR KO mixed BM chimeras. Mice were treated with IL-2 immune complexes for 5d (24, 38) and the ratio of WT and IFNAR KO T cells was measured in the thymus and the spleen of the treated mice. Surprisingly, IL-2 complex treatment completely restored the defect in thymic development of not only Treg, but also resulted in reconstitution of all the other T lymphocyte compartments (Fig. 8A). While short term IL-2 immune complex treatment also normalized the percentages of IFNAR KO CD4+Foxp3- and CD8+ T cells in the periphery, it failed to modulate the numbers of IFNAR KO Treg in the spleen (Fig. 8B). IL-2 immune complex treatment also restored Treg development in the thymus of heterozygous female IFNARfl/fl x Foxp3YFP-Cre/WT mice (Fig. 8C), but had no effect on IFNAR KO Treg in the spleen (Fig. 8D). These data demonstrate that treatment with IL-2 complexes can completely restore the developmental defect of IFNAR KO T cells in the thymus, but failed to enhance Treg survival in the periphery.
FIGURE 8. IFNAR KO Treg cells expand following IL-2 immune complex treatment in the thymus, but not in the spleen.

(A–B) Chimeric mice were treated with IL-2 immune complexes (white dots) or PBS (black dots) for 5 days. The ratio of CD45.2 IFNAR KO to CD45.1 WT of T cells was measured from thymic (A) and spleen cells (B). Each dot represents a single chimeric mouse. (C–D) IFNARfl/fl x Foxp3YFP-cre/wt mice were treated with IL-2 (white dots) complex or PBS (black dots). The ratio YFP+ IFNAR KO to YFP- WT of CD4+Foxp3+ cells was measured from the thymic (C) spleen cells (D). Data in (A), and (B) were analyzed by two-way ANOVA. **** P < 0.0001. Data in (C) and (D) were analyzed by unpaired Student t tests. *** P ≥ 0.0001. Data are representative of one or two experiments with 5 to 8 mice per group. Error bars in all panels represent the mean ± SD.
Discussion
Previous studies have suggested that the effects of type I IFNs on both conventional T cells and Treg are complex and potentially context dependent. While we and others (19) have shown the phenotype and in vitro suppressor function (data not shown) of Tregs from mice with a global deletion of the IFNAR is normal, it is likely that any defect in Treg function would be offset by the defect in type I IFN signaling in Teff cells in IFNAR KO mice. To specifically address the effects of type I IFNs on Tregs, we studied mixed BM chimeras between WT and IFNAR KO mice and heterozygous female mice expressing a Treg-specific deletion of the IFNAR. Taken together, studies in all of these models suggest that under conditions of stress and competition (irradiated chimeras) or competition alone (heterozygous females), IFNAR signaling is required for development of the Treg lineage in the thymus and potentially for survival of Treg in the periphery.
Although some of our data is compatible with a requirement for Type I IFN signaling only for the development of Treg in the thymus, our analysis of the phenotype of the IFNAR KO peripheral Treg suggests an additional role for signaling via the IFNAR for survival in the periphery in a competitive environment. First, surviving IFNAR KO Treg in both the mixed chimeras and the heterozygous females express high active pan-caspase and the pro-apoptotic factor, Bim, consistent with a propensity of the IFNAR KO T cells to undergo apoptotic cell death. More importantly, the surviving IFNAR KO Treg display a less activated phenotype that is markedly different from the subsets of Treg present in normal mice. A number of studies (39, 40) have suggested that Tregs can be divided into two phenotypically distinct subpopulations based on the differential expression of CD44 and CD62L: “naïve-like” Treg (CD44loCD62Lhi) and “effector memory” Tregs (CD44hiCD62Llo). Other groups have termed these subsets central Treg and effector Treg (41, 42). In addition, to CD44 and CD62L, a number of other markers can be used to characterize these two populations. The naïve Tregs express higher levels of CD25 and Bcl2 and higher levels of pSTAT5 (42), while the effector Tregs are undergoing cell cycling, and express higher level of several activation antigens, including CD69, ICOS, PD-1 and CD103. The IFNAR KO Tregs isolated from the competitive environments in many respects resemble the naïve Treg subpopulation with the notable exception being that they express lower levels of CD25 and pSTAT5. It has recently been demonstrated that TCR signals are required for the transition from the naïve Treg state to the effector Treg state and that only effector Treg manifest suppressor function in vivo (43). Our data suggest that in the absence of type I IFN signaling naïve Treg cannot respond to TCR signaling and transition to the fully activated suppressor-effector Treg, or die when they become activated.
In general, type I IFNs signal via STAT1 or STAT2; however, other studies (36, 37, 44) suggest that type I IFNs signal via STAT3 or STAT5. The decreased expression of CD25 and pSTAT5 on the surviving IFNAR KO Treg in our chimera and heterozygous female models raised the possibility that one role of type I IFNs was to complement the pro-survival effects of IL-2 in certain situations by signaling through STAT5 directly or by increasing the ability of Treg to respond to IL-2 resulting in enhanced activation of the STAT5 signaling pathway. Indeed, we could directly demonstrate that injection of poly (I:C) into WT, but not IFNAR KO mice resulted in induction of pSTAT5. As an alternative approach, we tested whether short-term administration of IL-2 immune complexes would restore Treg homeostasis. Surprisingly, IL-2 treatment of the WT + IFNAR KO chimeras completely restored the developmental defect of all thymic lineages and restored peripheral CD4+ and CD8+ percentages to that seen in WT + WT chimeras, but had no effect on the defect in Treg percentages in the periphery. Similar results were observed in heterozygous females although the reconstitution of Treg development in the thymus was less complete. It is unclear whether our failure to enhance Treg numbers in the periphery is secondary to the short course of therapy we used or whether type I IFNs impart a pro-survival effect in addition to that mediated by IL-2.
Absence of the IFNAR on Tregs had no effect on the in vitro suppressive function of Tregs (unpublished observations). We therefore utilized what we believe is a very sensitive model to assay for a defect in the suppressive function of Tregs by generating mixed chimeras between Scurfy fetal liver and WT, IFNAR KO, or Treg conditional IFNAR KO BM. IFNAR KO Tregs were much less efficient in their ability to suppress Scurfy cells than Tregs derived from WT BM, but certainly had some suppressive capacity as the chimeras did not develop as severe of a disease as that seen in Scurfy mice. The defective function of the Treg in the Scurfy + IFNAR KO chimeras was not secondary to a developmental defect of the Treg lineage as the absolute numbers of Treg were identical in Scurfy + WT and Scurfy + IFNAR KO chimeras. It is likely that the inflammatory environment in these chimeras, including the production of IL-2, compensated for some of the defects present in the development and/or survival of the IFNAR KO Tregs. These results are consistent with the observation that Treg from IFNAR KO mice failed to protect mice from the development of colitis when co-transferred with CD45RBhi cells into RAG1 KO recipients and that the administration of type I IFN reduced colitis by increasing the number of Foxp3+ Tregs (19). In contrast, we (unpublished observations) and (20) have shown that IFNAR KO Treg were able to protect mice from developing IBD in the same experimental model. The difference between these studies may be explained by differences in endogenous commensal bacteria and a high level of stress induced by inflammation in the studies of (19). Indeed, in our animal facility, which is identical to that used by (20), we failed to observed induction of Mx-1 gene expression following transfer of CD45RBhi cells to RAG KO recipients suggesting that type I IFNs are not induced under our experimental conditions and hence play no role in Treg function in IBD in our animal facility.
Collectively, our studies and the study of the effects of type IFNs in a tumor model (22) support the concept that type I IFNs primarily promote Treg suppressor function. The one experimental model in which type I IFNs appear to abrogate Treg suppressor function is acute LCMV infection (23). In this model, a marked depletion of Tregs was observed between d 2–7 post infection and this depletion of Tregs was required for optimal CD4+ and CD8+ T responses to the virus. The addition of type I IFN also reduced the suppressor function of Treg in the standard co-culture assay, although this effect appeared to be secondary to the death of the Treg cells rather than a modulatory effect on a known suppressor mechanism. The one major difference between the studies of (23) and our studies is that this group observed equal reconstitution of WT and IFNAR KO Treg populations in mixed BM chimeras. Although they used TCR-β/δ KO mice as recipients of the BM, while we used RAG KO mice, it is unlikely that this could account for the differences between the two studies. Furthermore, our results in unmanipulated heterozygous female mice with a Treg-specific deletion of the IFNAR are identical to the results we observed in the mixed BM chimeras. More importantly, it appears that the target Treg subpopulation that was susceptible to the effects of type I IFNs was different in the two studies. As noted above, we believe our data indicate a requirement for type I IFNs signaling in the maturation of Tregs from the naïve state to the activated effector state. In contrast, in the studies of (23) the population targeted by type I IFNs was the activated, cycling CD44hi effector Treg. Thus, the effects of type I IFNs on Tregs may be Treg subset specific.
Our findings could have important therapeutic implications for a variety of diseases. IFN-β has been one of the major therapies for MS and numerous mechanisms have been proposed for its therapeutic effects including a shift in cytokine balance from a Th1 to a Th2 response (45). However, in EAE, the animal model of MS, the major protective effects of IFNAR signaling were mediated by the IFNAR expressed on myeloid cells and not on B or T lymphocytes (46). In preliminary studies we have observed that mice with a Treg-specific deletion of the IFNAR are highly susceptible to EAE induced by MOG35-55 and frequently succumb from disease by d 15 post-induction. Lastly, two recent studies have demonstrated that inhibition of IFNAR signaling either genetically or by antibody blockade in chronic infection with LCMV led to a substantial reduction in virus titers and enhanced anti-viral CD4+ T cell responses (47, 48). Although the cellular target for the negative immunoregulatory effects of IFN in the chronic infection model were not determined, one possibility that is consistent with our results is that IFN in chronic viral infection potentiates Foxp3+ Treg function. Taken together, the role of type I IFNs in differentially regulating the function of both Teff and Treg is certainly context dependent and careful studies will be needed to determine the optimum situations for the positive or negative manipulation of IFNAR signaling in T cells in different diseases.
Acknowledgments
This work was supported by funds from the Intramural Program of the National Institute of Allergy and Infectious Diseases
We thank Dr. Robert Schreiber (Washington University School of Medicine) for providing the IFNARfl/fl mice fully backcrossed on to the C57BL/6 background.
Abbreviations
- IFNAR
Type I Interferon Receptor
- Teff
effector T cell
- Treg
regulatory T cell
- WT
wild-type
- KO
knockout
- IBD
inflammatory bowl disease
- BM
bone morrow
References
- 1.Gonzalez-Navajas JM, Lee J, David M, Raz E. Immunomodulatory functions of type I interferons. Nature reviews Immunology. 2012;12:125–135. doi: 10.1038/nri3133. [DOI] [PMC free article] [PubMed] [Google Scholar]
- 2.Pogue SL, Preston BT, Stalder J, Bebbington CR, Cardarelli PM. The receptor for type I IFNs is highly expressed on peripheral blood B cells and monocytes and mediates a distinct profile of differentiation and activation of these cells. Journal of interferon & cytokine research: the official journal of the International Society for Interferon and Cytokine Research. 2004;24:131–139. doi: 10.1089/107999004322813372. [DOI] [PubMed] [Google Scholar]
- 3.Doly J, Civas A, Navarro S, Uze G. Type I interferons: expression and signalization. Cell Mol Life Sci. 1998;54:1109–1121. doi: 10.1007/s000180050240. [DOI] [PMC free article] [PubMed] [Google Scholar]
- 4.Stetson DB, Medzhitov R. Type I interferons in host defense. Immunity. 2006;25:373–381. doi: 10.1016/j.immuni.2006.08.007. [DOI] [PubMed] [Google Scholar]
- 5.Schafer SL, Lin R, Moore PA, Hiscott J, Pitha PM. Regulation of type I interferon gene expression by interferon regulatory factor-3. The Journal of biological chemistry. 1998;273:2714–2720. doi: 10.1074/jbc.273.5.2714. [DOI] [PubMed] [Google Scholar]
- 6.Honda K, Taniguchi T. IRFs: master regulators of signalling by Toll-like receptors and cytosolic pattern-recognition receptors. Nature reviews. Immunology. 2006;6:644–658. doi: 10.1038/nri1900. [DOI] [PubMed] [Google Scholar]
- 7.Platanias LC. Mechanisms of type-I- and type-II-interferon-mediated signalling. Nature reviews. Immunology. 2005;5:375–386. doi: 10.1038/nri1604. [DOI] [PubMed] [Google Scholar]
- 8.Muller U, Steinhoff U, Reis LF, Hemmi S, Pavlovic J, Zinkernagel RM, Aguet M. Functional role of type I and type II interferons in antiviral defense. Science. 1994;264:1918–1921. doi: 10.1126/science.8009221. [DOI] [PubMed] [Google Scholar]
- 9.Durbin JE, Fernandez-Sesma A, Lee CK, Rao TD, Frey AB, Moran TM, Vukmanovic S, Garcia-Sastre A, Levy DE. Type I IFN modulates innate and specific antiviral immunity. Journal of immunology. 2000;164:4220–4228. doi: 10.4049/jimmunol.164.8.4220. [DOI] [PubMed] [Google Scholar]
- 10.Curtsinger JM, Valenzuela JO, Agarwal P, Lins D, Mescher MF. Type I IFNs provide a third signal to CD8 T cells to stimulate clonal expansion and differentiation. Journal of immunology. 2005;174:4465–4469. doi: 10.4049/jimmunol.174.8.4465. [DOI] [PubMed] [Google Scholar]
- 11.Kolumam GA, Thomas S, Thompson LJ, Sprent J, Murali-Krishna K. Type I interferons act directly on CD8 T cells to allow clonal expansion and memory formation in response to viral infection. The Journal of experimental medicine. 2005;202:637–650. doi: 10.1084/jem.20050821. [DOI] [PMC free article] [PubMed] [Google Scholar]
- 12.Le Bon A, Durand V, Kamphuis E, Thompson C, Bulfone-Paus S, Rossmann C, Kalinke U, Tough DF. Direct stimulation of T cells by type I IFN enhances the CD8+ T cell response during cross-priming. Journal of immunology. 2006;176:4682–4689. doi: 10.4049/jimmunol.176.8.4682. [DOI] [PubMed] [Google Scholar]
- 13.Marrack P, Kappler J, Mitchell T. Type I interferons keep activated T cells alive. The Journal of experimental medicine. 1999;189:521–530. doi: 10.1084/jem.189.3.521. [DOI] [PMC free article] [PubMed] [Google Scholar]
- 14.Havenar-Daughton C, Kolumam GA, Murali-Krishna K. Cutting Edge: The direct action of type I IFN on CD4 T cells is critical for sustaining clonal expansion in response to a viral but not a bacterial infection. Journal of immunology. 2006;176:3315–3319. doi: 10.4049/jimmunol.176.6.3315. [DOI] [PubMed] [Google Scholar]
- 15.Thompson LJ, Kolumam GA, Thomas S, Murali-Krishna K. Innate inflammatory signals induced by various pathogens differentially dictate the IFN-I dependence of CD8 T cells for clonal expansion and memory formation. Journal of immunology. 2006;177:1746–1754. doi: 10.4049/jimmunol.177.3.1746. [DOI] [PubMed] [Google Scholar]
- 16.Crow MK. Type I interferon in organ-targeted autoimmune and inflammatory diseases. Arthritis Res Ther. 2010;12(Suppl 1):S5. doi: 10.1186/ar2886. [DOI] [PMC free article] [PubMed] [Google Scholar]
- 17.Kirou KA, Lee C, George S, Louca K, Peterson MG, Crow MK. Activation of the interferon-alpha pathway identifies a subgroup of systemic lupus erythematosus patients with distinct serologic features and active disease. Arthritis Rheum. 2005;52:1491–1503. doi: 10.1002/art.21031. [DOI] [PubMed] [Google Scholar]
- 18.Passos de Souza E, Evangelista Segundo PT, Jose FF, Lemaire D, Santiago M. Rheumatoid arthritis induced by alpha-interferon therapy. Clin Rheumatol. 2001;20:297–299. doi: 10.1007/pl00011206. [DOI] [PubMed] [Google Scholar]
- 19.Lee SE, Li X, Kim JC, Lee J, Gonzalez-Navajas JM, Hong SH, Park IK, Rhee JH, Raz E. Type I interferons maintain Foxp3 expression and T-regulatory cell functions under inflammatory conditions in mice. Gastroenterology. 2012;143:145–154. doi: 10.1053/j.gastro.2012.03.042. [DOI] [PMC free article] [PubMed] [Google Scholar]
- 20.Kole A, He J, Rivollier A, Silveira DD, Kitamura K, Maloy KJ, Kelsall BL. Type I IFNs regulate effector and regulatory T cell accumulation and anti-inflammatory cytokine production during T cell-mediated colitis. Journal of immunology. 2013;191:2771–2779. doi: 10.4049/jimmunol.1301093. [DOI] [PMC free article] [PubMed] [Google Scholar]
- 21.Srivastava S, Koch LK, Campbell DJ. IFNalphaR signaling in effector but not regulatory T cells is required for immune dysregulation during type I IFN-dependent inflammatory disease. Journal of immunology. 2014;193:2733–2742. doi: 10.4049/jimmunol.1401039. [DOI] [PMC free article] [PubMed] [Google Scholar]
- 22.Stewart CA, Metheny H, Iida N, Smith L, Hanson M, Steinhagen F, Leighty RM, Roers A, Karp CL, Muller W, Trinchieri G. Interferon-dependent IL-10 production by Tregs limits tumor Th17 inflammation. The Journal of clinical investigation. 2013;123:4859–4874. doi: 10.1172/JCI65180. [DOI] [PMC free article] [PubMed] [Google Scholar]
- 23.Srivastava S, Koch MA, Pepper M, Campbell DJ. Type I interferons directly inhibit regulatory T cells to allow optimal antiviral T cell responses during acute LCMV infection. The Journal of experimental medicine. 2014;211:961–974. doi: 10.1084/jem.20131556. [DOI] [PMC free article] [PubMed] [Google Scholar]
- 24.Boyman O, Kovar M, Rubinstein MP, Surh CD, Sprent J. Selective stimulation of T cell subsets with antibody-cytokine immune complexes. Science. 2006;311:1924–1927. doi: 10.1126/science.1122927. [DOI] [PubMed] [Google Scholar]
- 25.Tough DF. Modulation of T-cell function by type I interferon. Immunol Cell Biol. 2012;90:492–497. doi: 10.1038/icb.2012.7. [DOI] [PubMed] [Google Scholar]
- 26.Huber JP, Farrar JD. Regulation of effector and memory T-cell functions by type I interferon. Immunology. 2011;132:466–474. doi: 10.1111/j.1365-2567.2011.03412.x. [DOI] [PMC free article] [PubMed] [Google Scholar]
- 27.Kumar A, Zhang J, Yu FS. Toll-like receptor 3 agonist poly(I:C)-induced antiviral response in human corneal epithelial cells. Immunology. 2006;117:11–21. doi: 10.1111/j.1365-2567.2005.02258.x. [DOI] [PMC free article] [PubMed] [Google Scholar]
- 28.Freeman BE, Hammarlund E, Raue HP, Slifka MK. Regulation of innate CD8+ T-cell activation mediated by cytokines. Proceedings of the National Academy of Sciences of the United States of America. 2012;109:9971–9976. doi: 10.1073/pnas.1203543109. [DOI] [PMC free article] [PubMed] [Google Scholar]
- 29.Sun S, Zhang X, Tough DF, Sprent J. Type I interferon-mediated stimulation of T cells by CpG DNA. The Journal of experimental medicine. 1998;188:2335–2342. doi: 10.1084/jem.188.12.2335. [DOI] [PMC free article] [PubMed] [Google Scholar]
- 30.Jin HK, Yamashita T, Ochiai K, Haller O, Watanabe T. Characterization and expression of the Mx1 gene in wild mouse species. Biochem Genet. 1998;36:311–322. doi: 10.1023/a:1018741312058. [DOI] [PubMed] [Google Scholar]
- 31.Youle RJ, Strasser A. The BCL-2 protein family: opposing activities that mediate cell death. Nat Rev Mol Cell Biol. 2008;9:47–59. doi: 10.1038/nrm2308. [DOI] [PubMed] [Google Scholar]
- 32.Pierson W, Cauwe B, Policheni A, Schlenner SM, Franckaert D, Berges J, Humblet-Baron S, Schonefeldt S, Herold MJ, Hildeman D, Strasser A, Bouillet P, Lu LF, Matthys P, Freitas AA, Luther RJ, Weaver CT, Dooley J, Gray DH, Liston A. Antiapoptotic Mcl-1 is critical for the survival and niche-filling capacity of Foxp3 regulatory T cells. Nat Immunol. 2013 doi: 10.1038/ni.2649. [DOI] [PMC free article] [PubMed] [Google Scholar]
- 33.Brunkow ME, Jeffery EW, Hjerrild KA, Paeper B, Clark LB, Yasayko SA, Wilkinson JE, Galas D, Ziegler SF, Ramsdell F. Disruption of a new forkhead/winged-helix protein, scurfin, results in the fatal lymphoproliferative disorder of the scurfy mouse. Nat Genet. 2001;27:68–73. doi: 10.1038/83784. [DOI] [PubMed] [Google Scholar]
- 34.Wildin RS, Ramsdell F, Peake J, Faravelli F, Casanova JL, Buist N, Levy-Lahad E, Mazzella M, Goulet O, Perroni L, Bricarelli FD, Byrne G, McEuen M, Proll S, Appleby M, Brunkow ME. X-linked neonatal diabetes mellitus, enteropathy and endocrinopathy syndrome is the human equivalent of mouse scurfy. Nat Genet. 2001;27:18–20. doi: 10.1038/83707. [DOI] [PubMed] [Google Scholar]
- 35.Hervas-Stubbs S, Perez-Gracia JL, Rouzaut A, Sanmamed MF, Le Bon A, Melero I. Direct effects of type I interferons on cells of the immune system. Clin Cancer Res. 2011;17:2619–2627. doi: 10.1158/1078-0432.CCR-10-1114. [DOI] [PubMed] [Google Scholar]
- 36.Fish EN, Uddin S, Korkmaz M, Majchrzak B, Druker BJ, Platanias LC. Activation of a CrkL-stat5 signaling complex by type I interferons. The Journal of biological chemistry. 1999;274:571–573. doi: 10.1074/jbc.274.2.571. [DOI] [PubMed] [Google Scholar]
- 37.Uddin S, Lekmine F, Sassano A, Rui H, Fish EN, Platanias LC. Role of Stat5 in type I interferon-signaling and transcriptional regulation. Biochemical and biophysical research communications. 2003;308:325–330. doi: 10.1016/s0006-291x(03)01382-2. [DOI] [PubMed] [Google Scholar]
- 38.Webster KE, Walters S, Kohler RE, Mrkvan T, Boyman O, Surh CD, Grey ST, Sprent J. In vivo expansion of T reg cells with IL-2-mAb complexes: induction of resistance to EAE and long-term acceptance of islet allografts without immunosuppression. The Journal of experimental medicine. 2009;206:751–760. doi: 10.1084/jem.20082824. [DOI] [PMC free article] [PubMed] [Google Scholar]
- 39.Huehn J, Siegmund K, Lehmann JC, Siewert C, Haubold U, Feuerer M, Debes GF, Lauber J, Frey O, Przybylski GK, Niesner U, de la Rosa M, Schmidt CA, Brauer R, Buer J, Scheffold A, Hamann A. Developmental stage, phenotype, and migration distinguish naive- and effector/memory-like CD4+ regulatory T cells. The Journal of experimental medicine. 2004;199:303–313. doi: 10.1084/jem.20031562. [DOI] [PMC free article] [PubMed] [Google Scholar]
- 40.Lee JH, Kang SG, Kim CH. FoxP3+ T cells undergo conventional first switch to lymphoid tissue homing receptors in thymus but accelerated second switch to nonlymphoid tissue homing receptors in secondary lymphoid tissues. Journal of immunology. 2007;178:301–311. doi: 10.4049/jimmunol.178.1.301. [DOI] [PubMed] [Google Scholar]
- 41.Liston A, Gray DH. Homeostatic control of regulatory T cell diversity. Nature reviews. Immunology. 2014;14:154–165. doi: 10.1038/nri3605. [DOI] [PubMed] [Google Scholar]
- 42.Smigiel KS, Richards E, Srivastava S, Thomas KR, Dudda JC, Klonowski KD, Campbell DJ. CCR7 provides localized access to IL-2 and defines homeostatically distinct regulatory T cell subsets. The Journal of experimental medicine. 2014;211:121–136. doi: 10.1084/jem.20131142. [DOI] [PMC free article] [PubMed] [Google Scholar]
- 43.Levine AG, Arvey A, Jin W, Rudensky AY. Continuous requirement for the TCR in regulatory T cell function. Nature immunology. 2014;15:1070–1078. doi: 10.1038/ni.3004. [DOI] [PMC free article] [PubMed] [Google Scholar]
- 44.Meinke A, Barahmand-Pour F, Wohrl S, Stoiber D, Decker T. Activation of different Stat5 isoforms contributes to cell-type-restricted signaling in response to interferons. Molecular and cellular biology. 1996;16:6937–6944. doi: 10.1128/mcb.16.12.6937. [DOI] [PMC free article] [PubMed] [Google Scholar]
- 45.Sega S, Wraber B, Mesec A, Horvat A, Ihan A. IFN-beta1a and IFN-beta1b have different patterns of influence on cytokines. Clinical neurology and neurosurgery. 2004;106:255–258. doi: 10.1016/j.clineuro.2004.02.010. [DOI] [PubMed] [Google Scholar]
- 46.Prinz M, Schmidt H, Mildner A, Knobeloch KP, Hanisch UK, Raasch J, Merkler D, Detje C, Gutcher I, Mages J, Lang R, Martin R, Gold R, Becher B, Bruck W, Kalinke U. Distinct and nonredundant in vivo functions of IFNAR on myeloid cells limit autoimmunity in the central nervous system. Immunity. 2008;28:675–686. doi: 10.1016/j.immuni.2008.03.011. [DOI] [PubMed] [Google Scholar]
- 47.Teijaro JR, Ng C, Lee AM, Sullivan BM, Sheehan KC, Welch M, Schreiber RD, de la Torre JC, Oldstone MB. Persistent LCMV infection is controlled by blockade of type I interferon signaling. Science. 2013;340:207–211. doi: 10.1126/science.1235214. [DOI] [PMC free article] [PubMed] [Google Scholar]
- 48.Wilson EB, Yamada DH, Elsaesser H, Herskovitz J, Deng J, Cheng G, Aronow BJ, Karp CL, Brooks DG. Blockade of chronic type I interferon signaling to control persistent LCMV infection. Science. 2013;340:202–207. doi: 10.1126/science.1235208. [DOI] [PMC free article] [PubMed] [Google Scholar]