

Abstract
Clinical audiometry has long focused on determining the detection thresholds for pure tones, which depend on intact cochlear mechanics and hair cell function. Yet many listeners with normal hearing thresholds complain of communication difficulties, and the causes for such problems are not well understood. Here, we explore whether normal-hearing listeners exhibit such suprathreshold deficits, affecting the fidelity with which subcortical areas encode the temporal structure of clearly audible sound. Using an array of measures, we evaluated a cohort of young adults with thresholds in the normal range to assess both cochlear mechanical function and temporal coding of suprathreshold sounds. Listeners differed widely in both electrophysiological and behavioral measures of temporal coding fidelity. These measures correlated significantly with each other. Conversely, these differences were unrelated to the modest variation in otoacoustic emissions, cochlear tuning, or the residual differences in hearing threshold present in our cohort. Electroencephalography revealed that listeners with poor subcortical encoding had poor cortical sensitivity to changes in interaural time differences, which are critical for localizing sound sources and analyzing complex scenes. These listeners also performed poorly when asked to direct selective attention to one of two competing speech streams, a task that mimics the challenges of many everyday listening environments. Together with previous animal and computational models, our results suggest that hidden hearing deficits, likely originating at the level of the cochlear nerve, are part of “normal hearing.”
Keywords: central auditory processing disorders, cochlear neuropathy, envelope-following response, frequency-following response, hidden hearing loss, temporal coding
Introduction
Clinical practice characterizes hearing loss through pure-tone threshold audiometry. However, a number of normal-hearing (NH) listeners complain of difficulty communicating, especially when there are competing sounds, noise, and room reverberation. When such listeners seek clinical treatment, they are labeled as suffering from obscure auditory dysfunction (Saunders and Haggard, 1992), King–Kopetzky syndrome (Zhao and Stephens, 1996), or, more generally, (central) auditory processing disorders (Chermak and Musiek, 1997). The nonspecific nature of these labels underscores how little we understand about the underlying mechanisms.
As many as 5–15% of adult patients seeking audiological help turn out to have normal thresholds (Cooper and Gates, 1991; Kumar et al., 2007; Hind et al., 2011). Importantly, the problem may be even more common than such figures suggest; for instance, some NH listeners, particularly older participants, perform poorly on behavioral tasks that rely on precise temporal cues in suprathreshold sound (Strelcyk and Dau, 2009; Grose and Mamo, 2010; Ruggles et al., 2012). Auditory temporal perception degrades with age, independently of hearing loss and throughout adulthood (Snell and Frisina, 2000; Snell et al., 2002; Fitzgibbons and Gordon-Salant, 2010; Ruggles et al., 2012). Many listeners who can communicate effectively in quiet settings are nonetheless frustrated in complex environments such as cocktail parties, noisy restaurants, and busy streets (Dubno, 1984; Gatehouse and Noble, 2004). These findings suggest that a significant portion of listeners with normal or near-normal hearing thresholds exhibit temporal processing deficits.
Previous animal work revealed that noise exposure causing temporary threshold shifts, previously thought to be innocuous, can produce a loss of as many as 50% of the synapses and cochlear-nerve terminals innervating the inner hair cells, described herein as cochlear neuropathy (Kujawa and Liberman, 2009; Lin et al., 2011b). Aging also appears to reduce the effective auditory nerve fiber (ANF) population, initially through a loss of synapses with a subsequent degeneration of cell bodies (Makary et al., 2011; Sergeyenko et al., 2013). Furthermore, significant levels of deafferentation do not appear to affect detection thresholds (Schuknecht and Woellner, 1955; Lobarinas et al., 2013); however, in the healthy auditory system, convergence of nerve fibers is important for precise coding of both temporal fine-structure and envelope cues in suprathreshold sounds (Joris et al., 1994; Lopez-Poveda and Barrios, 2013). Given the importance of temporal information for speech perception (Zeng et al., 2005), source localization (Blauert, 1997), grouping of acoustic elements into perceptual objects (Darwin, 1997; Shamma et al., 2011), and release from masking (Moore, 2008; Christiansen et al., 2013), degraded temporal coding is likely to interfere with suprathreshold perceptual ability—a form of “hidden hearing loss” (Bharadwaj et al., 2014; Plack et al., 2014).
Using a combination of electrophysiological, otoacoustic, and perceptual measures, the current study exploits individual differences in a cohort of NH listeners to characterize the relationships between peripheral function, neural temporal coding, and suprathreshold hearing performance with complex stimuli. We find that suprathreshold temporal coding fidelity varies in listeners with no known hearing complaints in a pattern consistent with cochlear neuropathy.
Materials and Methods
A primary goal of the study was to determine whether the pattern of individual differences in suprathreshold temporal coding in a cohort of young NH adult listeners is consistent with cochlear neuropathy. We explicitly evaluated peripheral cochlear mechanics and hair cell function to disambiguate where differences arise. Because noise-induced temporary and permanent threshold shifts often present as notches around 4 kHz (Pierson et al., 1994; Yost, 2007), our stimuli and testing focused on this frequency region.
Methods and measures were designed to imitate the challenges facing listeners in everyday, noisy environments in controlled laboratory settings. In contrast to listening to a single speech source in quiet (which is sparse in both time and frequency), acoustic scenes with multiple talkers, noise, and room reverberation typically have the following:
High overall sound levels. A larger percentage of the overall population of ANFs will respond, including high-threshold, low–spontaneous rate (SR) fibers that would contribute less at low sound intensities.
A relatively dense pattern of cochlear excitation along the tonotopic axis. “Off-frequency” ANF channels, remote from the dominant stimulus-evoked excitation locations, cannot encode target information. This is in contrast to listening in quiet where off-frequency high-SR fibers would respond to target modulations (Fig. 1).
Relatively weak signal modulation. In addition to directly masking the target modulations, energy from competing sources will tend to fill in temporal dips in signal energy, requiring robust encoding of small modulations of high-intensity sounds for target information to be discernible (Fig. 1).
Figure 1.

Illustration of the detrimental effects of real-world noise (restaurant chatter) on the representation of a target sound at the level of the auditory nerve (AN). A, Long-term spectrum of noise recorded from a crowded restaurant showing the typical 1/f magnitude characteristic. B, Representation of a target vowel (pitch, 140 Hz) simulated using a phenomenological model of the AN (Zilany et al., 2014) in quiet (top) and with additive restaurant chatter (bottom) for a short analysis time window across fibers with different characteristic frequencies (CFs). Although strong modulations are apparent in both cases, the latter shows more irregularities. C, Distribution of the SNR across time-frequency “cells” (50 ms time windows for each cochlear channel). Within a given time-frequency cell, the SNR was defined as the ratio of the power in the modulation spectrum of the AN response at the target pitch (140 Hz) relative to the background. As more noise is added, the AN representation shifts from representing target modulations robustly (>20 dB SNR) to representing mostly noise (modulation SNR growing progressively negative). D, Proportion of time-frequency “cells” dominated by the target (i.e., having an SNR of >3 dB). Although ∼95% of the cells represent the target modulations in quiet (dotted line), when the noise level matches the signal level (solid vertical line), only ∼15% of the “cells” represent the target. Thus, although most time windows and most cochlear channels represent the target in quiet, maskers reduce both the temporal modulations and the availability of “off-frequency” channels.
These observations suggest that at the level of the auditory nerve, degradations in temporal coding fidelity may be evident when listening in noisy real-world conditions even though they may not impair perception in conditions like those often tested in the laboratory. We therefore employed high sound levels, off-frequency maskers, and stimuli with shallow modulation depths in our battery of measures (Table 1). Given that neuropathy from both noise exposure and aging preferentially (though by no means exclusively) impacts low-SR fibers (Fig. 2), we hypothesized that such stimuli would increase the likelihood of exposing suprathreshold temporal coding deficits resulting from neuropathy (Bharadwaj et al., 2014). We measured peripheral/cochlear processing of sounds using distortion-product otoacoustic emissions (DPOAEs; Johnson et al., 2006), psychophysical tuning curves (Oxenham and Shera 2003), and audiometric detection thresholds. We measured early neural coding of temporal information using subcortical envelope-following responses (EFRs) (Bharadwaj and Shinn-Cunningham, 2014; Bharadwaj et al., 2014). We then compared these measures to perceptual estimates of temporal sensitivity, to electroencephalography (EEG)-based measures of cortical representation of acoustic spatial features (Salminen et al., 2010), and to selective attention performance in a complex speech-on-speech masking task. Finally, we compared perceptual measures of temporal sensitivity to self-reported noise-exposure history.
Table 1.
A summary of the list of measures used to characterize suprathreshold auditory perception and the corresponding stimulus used
| Measure | Stimulus |
|---|---|
| Audiograms | 250 Hz to 8 kHz pure tones |
| Psychophysical tuning curves | 4 kHz tones at 10 dB SL in notched noise |
| DPOAE growth curves | 4 kHz “f2” frequency at 16 levels |
| Modulation detection | Broadband noise with a 500 Hz band around 4 kHz modulated at 19 Hz (80 dB SPL) |
| Envelope-ITD discrimination | 4 kHz AM tones in notched noise modulated at 40 Hz (75 dB SPL) |
| Envelope-following responses | 4 kHz AM tones in notched noise modulated at 100 Hz at a fixed level (75 dB SPL) and with varying modulation depths (Fig. 5A) |
| Cortical EEG | Same as for envelope ITD detection (Fig. 7A) |
| “Spatial” attention | Spoken monotonized digit sequences with varying ITDs plus additive 1/f noise (interaurally uncorrelated) |
Figure 2.
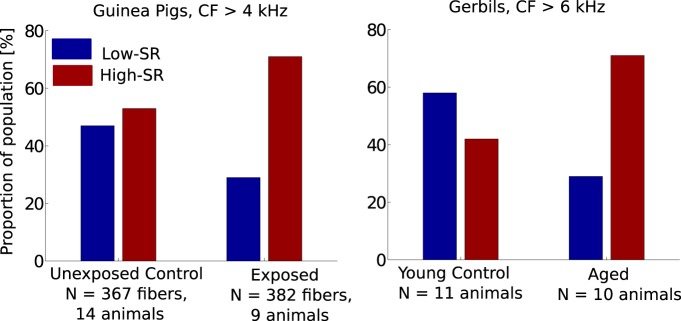
Effects on population distribution of cochlear nerve fibers with low and high spontaneous discharge rates in following noise exposure (left; Furman et al., 2013) and aging (right; Schmiedt et al., 1996). Whereas the split of low- to high-SR fiber counts is roughly 50/50 in both control groups (unexposed guinea pigs and young gerbils, respectively), both noise exposure and aging appear to lead to a selective (but not necessarily exclusive) neuropathy of low-SR ANFs. As argued by Bharadwaj et al. (2014), this selectivity may be potentially leveraged to design stimuli that are sensitive to suprathreshold temporal coding deficits arising due to neuropathy. Note that CF stands for fiber characteristic frequencies.
All measures were obtained with the participants seated in an acoustically and electrically shielded booth (single-walled Eckel C-14 booth). For passive measures (DPOAEs and EFRs), participants watched a silent, captioned movie of their choice, ignoring the acoustic stimuli. A personal desktop computer controlled all aspects of the experiment, including triggering sound delivery and storing data. Special-purpose sound-control hardware (System 3 real-time signal processing systems, including analog-to-digital conversion and amplification; Tucker Davis Technologies) presented sound through insert phones (ER-1; Etymotic; for all measures except otoacoustic emissions, which used ER-10c) coupled to foam ear tips. All sounds were digitized at a sampling rate of 48,828 Hz. For all active behavioral experiments, subjects responded by button presses. Feedback was presented after each trial.
Participants
Twenty six (13 female) subjects, aged 21–39 years, were recruited from the Boston University community. All subjects had pure-tone hearing thresholds better than 15 dB hearing level in both ears at octave frequencies between 250 Hz and 8 kHz and rated their own hearing as normal and similar to others in their age group. In addition, two subjects (aged 27 and 29) with a “notch”-type hearing loss at 4 kHz were recruited to evaluate the sensitivity of the measures used to characterize cochlear mechanical function. Subjects provided informed consent in accordance with protocols established at Boston University. Although the goal was to obtain each of the measures (Table 1) on every subject, subject availability precluded some subjects from completing some measures (see Fig. 4, Fig. 6).
Figure 4.
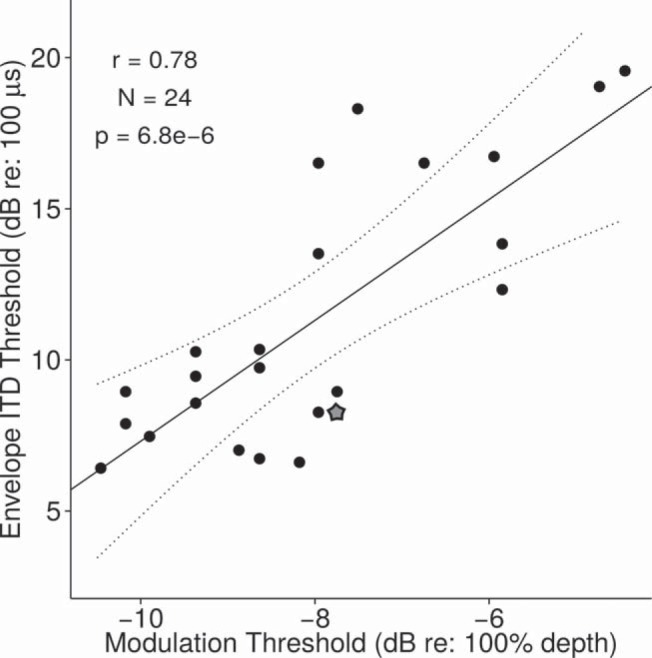
Relationship between monaural (modulation thresholds) and binaural (envelope ITD thresholds) measures of temporal sensitivity. The subject denoted with the star symbol was unavailable for the EFR measures. A considerable portion of the variance in the binaural measure can be accounted for by differences in the “monaural” measure.
Figure 6.

Relationship between EFR and behavioral measures of temporal sensitivity. A, AM thresholds versus EFR slope. The rate at which the EFR drops with decreasing modulation correlates strongly with perceptual modulation sensitivity. B, AM thresholds versus absolute EFR magnitude at −4 dB modulation depth (the shallowest depth at which 90% of the subjects showed a clear EFR response distinguishable from the noise floor). Although the absolute EFR magnitude at a given modulation depth correlates with perceptual ability, the correlation is not as strong as the correlation between EFR slope and perception. C, Envelope ITD threshold versus EFR slope. Subcortical temporal coding fidelity as measured by EFR slope also can explain a considerable amount of the variance in envelope ITD thresholds. The subject denoted by the triangle symbol in A and B was unavailable for envelope ITD threshold measurement, and the subject denoted by the square symbol in C was unavailable for modulation threshold measurement.
Correlates of cochlear mechanical function
Psychophysical tuning curves.
An important aspect of healthy basilar membrane processing is good frequency selectivity. Psychophysical tuning curves were measured for a fixed, low-intensity probe tone (sensation level (SL) of 10 dB) using the notched-noise method (Patterson, 1976) in a forward-masking paradigm (Oxenham and Shera, 2003). Stimulus parameters and testing procedures were identical to those used by Oxenham and Shera (2003). Filter equivalent rectangular bandwidths (ERBs) were estimated by fitting a roex(p,w,t) function (see Oxenham and Shera, 2003).
DPOAE input–output curves.
To obtain an objective correlate of cochlear mechanical nonlinearity, DPOAE growth functions were measured as a function of level of the f2 primary tone (f2 = 4 kHz). The frequency and level of the f1 tone were varied according to the formula provided by Johnson et al. (2006) to maximize the level of the DPOAE for each level of the f2 tone. The DPOAE level was estimated at the distortion frequency of 2f1–f2.
Behavioral measures of temporal coding
Amplitude modulation (AM) detection thresholds were obtained using broadband noise stimuli (Viemeister, 1979). The target was a 500 Hz band of noise centered at 4 kHz and modulated at 19 Hz. Unmodulated bands of noise above (up to 10 kHz) and below (down to 20 Hz) served as maskers to reduce off-frequency cues. The target to notched-noise ratio was 10 dB, and the overall level was 80 dB SPL [broadband root mean square (RMS)]. Reference signals were statistically identical but without any amplitude modulation. The stimuli were presented diotically in a two-alternative, forced-choice paradigm (i.e., one interval with the reference signal and another with the target signal) for different modulation depths sampled randomly between 0 and 100%. By using noise stimuli, spectral cues for AM detection were eliminated. Threshold depths for detection were determined using a Bayesian approach, fitting the parameters of a sigmoidal psychometric function to the responses from 1500 trials and calculating the posterior mean threshold using a Monte Carlo Markov chain (MCMC) sampling procedure from the posterior density (Kuss et al., 2005). As in Kuss et al. (2005), a normal and a log-normal prior were used for the location (threshold) and the slope parameters, respectively. The chance level was fixed at 50%, and a β prior was used for the lapse rate parameter.
To obtain a binaural measure of temporal coding, we used an envelope interaural time difference (ITD) discrimination task. A half-wave rectified sinusoid at 40 Hz was used to modulate a 4 kHz carrier (called a “transposed” tone; Bernstein and Trahiotis, 2002). The envelope rate of 40 Hz was chosen because we acquired EEG data simultaneously with the task; this rate is known to elicit strong cortical source auditory steady-state responses (ASSRs) in EEG (Picton et al., 2003). The carrier phase was identical in the two ears; the ITD was applied only to the 40 Hz envelope. The envelope was ramped slowly (simultaneously in the two ears) over a 100 ms time window to minimize the use of onset cues. The stimulus level was set at 75 dB SPL. Off-frequency notched-noise (notch width of 800 Hz) maskers, realized independently in each trial and uncorrelated across the two ears, were presented at a signal-to-noise ratio (SNR) of 10 dB (broadband RMS). The off-frequency masker extended to 20 Hz on the low-frequency side and 10 kHz on the high-frequency side and served to attenuate off-frequency listening cues, including cues from distortion products. Each trial consisted of a sequence of two intervals, with the second interval having an envelope ITD of zero. The stimulus in the first interval had an ITD sampled uniformly from the set {50, 100, 200, 400, 800} μs, with the leading ear randomized across trials. In each trial, the subjects were asked to indicate whether the sound moved from “left to center” or “right to center.” As with the AM threshold measurement, the threshold was determined by fitting a sigmoidal psychometric function to responses from 1200 trials and estimating the posterior mean using MCMC sampling. For the small number of subjects whose thresholds appeared to exceed 800 μs, additional trials were included with ITDs up to 1200 μs.
Electrophysiological measures of temporal coding
EFRs were measured in response to 400-ms-long bursts of 100 Hz transposed tones with a carrier frequency of 4 kHz at a level of 75 dB SPL and for varying modulation depths (m). EFRs were obtained using a 32 channel EEG system (Biosemi Active II system) using 1000 presentations of each stimulus with half in each polarity. The interstimulus interval varied uniformly between 550 and 650 ms. The EFR power was estimated in the frequency domain using a complex principal component analysis approach to combine across channels. This approach combines measurements across multiple channels, optimally adjusting for phase disparities in the signal across channels; the approach has been shown to improve the SNR of the extracted EFR significantly (Bharadwaj and Shinn-Cunningham, 2014). Off-frequency notched-noise maskers were applied at an SNR of 20 dB (broadband RMS) with a notch width of 800 Hz to attenuate off-frequency contributions. The envelope rate and noise level were fixed based on pilot experiments requiring a large number of trials. These pilot experiments showed that at low noise intensities, small changes in noise level had a stronger effect, whereas at moderate noise levels, decreases in SNR had more modest effects; there was a knee point at an SNR of ∼20 dB. The pilot experiments also showed that at an envelope rate of 100 Hz, robust responses could be acquired and exhibited a group delay of ∼8 ms, consistent with purely subcortical generators (Kiren et al., 1994; Herdman et al., 2002; Kuwada et al., 2002). The off-frequency noise was realized independently in each trial and was interaurally uncorrelated.
We hypothesize that cochlear neuropathy underlies a portion of individual differences in temporal coding fidelity. Modeling the EFR as a summed response over a population of (model) inferior colliculus cells, Bharadwaj et al. (2014) suggested that (1) stimuli at high levels and shallow modulation depths should accentuate the contributions of low-SR fibers, and that (2) changes in EFR amplitude with modulation depth would provide an easy-to-interpret, self-normalized measure of suprathreshold coding fidelity.
EFRs were recorded for six different modulations [m values with 20 log(m) varying from 100% modulation or 0 dB up to −20 dB in steps of −4 dB]. A multichannel estimate of the phase-locking value (PLV) was used to infer whether an EFR peak exceeded the noise floor. The PLV is convenient for this purpose because the noise floor distribution is independent of background noise levels (Zhu et al., 2013; Bharadwaj and Shinn-Cunningham, 2014). Because half of the subjects did not show a significant EFR peak at the modulation frequency of 100 Hz for modulation depths of −12 dB and lower, only the EFRs in response to stimuli with the largest modulations were analyzed. As suggested by (Bharadwaj et al., 2014), the slope of the EFR amplitude with modulation depth was used to quantify suprathreshold coding fidelity, computed by fitting a straight line over the three data points corresponding to 20 log(m) = 0, −4, and −8 dB, respectively.
Cortical EEG was recorded simultaneously with the envelope-ITD detection task to obtain an electrophysiological correlate of binaural temporal sensitivity and to assess if early neural coding affects the cortical representation of acoustic features. Adaptation of the cortical onset response (“N100 response”) to the second of a pair of sound bursts is ITD specific; the response to the second sound is larger when it differs in ITD from the first (Salminen et al., 2010). We wondered whether such ITD-specific adaptation can be found when the ITD is purely in the envelope, as in our behavioral task (see Fig. 7A). The 40 Hz cortical ASSR was also quantified.
Figure 7.

Results from cortical EEG measures of envelope ITD sensitivity. A, Stimulus sequence. Subjects were asked to indicate if sounds jumped from left to center or right to center. B, Induced power relative to baseline. C, Intertrial phase locking reveals low-frequency responses to the onset of AM tones in addition to showing a sustained response at the modulation frequency (40 Hz). D, A closer look at the low-frequency power in onset responses to the two tones (averaged over frequencies below 20 Hz) showing envelope ITD–specific adaptation.
ITD-based selective attention task
To evaluate the contributions of individual differences in cochlear mechanical function and suprathreshold temporal coding to differences in listening performance in a complex task, a “spatial” attention task was used. Spoken digits recorded in-house in the voice of a female speaker were monotonized to 184 Hz (close to the natural pitch of the voice). To simulate some of the constraints imposed by realistic maskers, uncorrelated pink noise (1/f spectrum; Fig. 1A) was added to each ear. The signals were spatialized by imposing simple ITDs. Each trial consisted of two simultaneous sequences of three spoken digits each, with the streams differentiated only by their ITDs, which were symmetrical around the midline (see Fig. 8A). A visual cue presented 2 s before the onset of the sound streams identified the direction of the target stream (left or right). The ITD magnitudes in each trial were drawn uniformly from the set (50, 100, 200, 300, 400 μs). The target direction was randomized on each trial. At the end of each trial, a visual response circle cued the subjects to indicate the target using a sequence of button presses. The effects of cochlear mechanical function and suprathreshold temporal coding fidelity on performance in the attention task were determined using a generalized linear regression analysis (Pinheiro and Bates, 2000). Subject-specific residuals were modeled as random effects coming from a normal distribution. Normal priors were used for each location parameter (model coefficients), and inverse-Wishart priors were used for variance components (Hadfield, 2010).
Figure 8.

ITD-based attention. A, A schematic illustration of the sequence of events constituting the task. Each trial began with the subject visually fixated on the center of the screen. A visual cue (left or right arrow) appeared 2 s before the onset of the sounds, identifying the direction of the target stream (left or right, based on ITDs). Two simultaneous sequences of digits spoken by the same speaker and monotonized to the same pitch were then presented. Following the digit sequences, a visual response circle cued the subject to respond and indicate the three digits in the target sequence using button presses. Finally, feedback was given to the subject as follows: a green circle, indicating that all three digits were identified correctly; a blue circle, indicating that two of the three digits were identified correctly; or a red cross, indicating that fewer than two response digits matched the correct target sequence. B, Performance as a function of ITD. Large individual differences are evident. The upper and lower hinges correspond to the first and third quartiles (the 25th and 75th percentiles). The upper whisker extends from the hinge to the highest value that is within 1.5 * IQR of the hinge, where IQR is the inter-quartile range, or distance between the first and third quartiles. The lower whisker extends from the hinge to the lowest value within 1.5 * IQR of the hinge. Data beyond the end of the whiskers are outliers and plotted as individual points. The drop in performance with ITD indicates that sensory coding limitations, perhaps related to source separability, dominate performance.
Results
Correlates of peripheral processing
Figure 3A shows the DPOAE growth function for subjects in our NH cohort (black), as well as for two subjects with hearing loss (red lines). The standard error of the mean over the NH cohort is also shown for reference. The results are comparable to published DPOAE input–output curves for NH listeners (Johnson et al., 2006). The relatively large attenuation in the DPOAE for the two subjects with hearing loss testifies to the sensitivity of the measure to dysfunction in cochlear mechanics. We defined the DPOAE threshold for each subject as the lowest presented level of the f2 primary tone at which the DPOAE level exceeded −10 dB SPL. These DPOAE thresholds were then compared with behavioral audiometric thresholds and with the behavioral measures of suprathreshold temporal perception. Although all of the listeners in our NH cohort have thresholds within the normal range (by design), there are modest residual differences in the thresholds across listeners (see horizontal distribution of data in Fig. 3C). Psychophysical filter widths also were comparable to those of NH listeners in the published literature (Oxenham and Shera, 2003), with a mean ERB of 249 Hz and a standard error of 24 Hz (Fig. 3B). Importantly, the three measures of cochlear amplifier function correlated with each other (ERBs vs pure-tone thresholds, r = 0.51, p = 0.011; DPOAE vs pure-tone thresholds, r = 0.42, p = 0.04), suggesting that the variance in these measures across subjects is not dominated by measurement noise, but rather reflects individual differences in cochlear function among the listeners in the NH cohort.
Figure 3.

Objective and behavioral measures of cochlear hair cell function. A, DPOAE input–output curves (f2 = 4 kHz) for the NH cohort and two subjects with elevated thresholds. DPOAE thresholds are elevated for subjects with hearing loss, affirming that the measure is sensitive to cochlear mechanical deficits. B, Forward-masking tuning curves at 10 dB SL for the NH cohort. C, Comparison of audiometric thresholds and modulation thresholds across individuals. There is no significant correlation.
Behavioral correlates of temporal sensitivity
Similar to previous reports of large individual differences in temporal coding in NH listeners (Ruggles et al., 2011), we found large individual differences in AM thresholds across our NH cohort (see vertical distribution of data in Fig. 3C). The measured thresholds are higher than AM thresholds for noise stimuli reported in the literature (Viemeister, 1979); this discrepancy is likely due to the fact that our narrowband modulation target signal was presented with unmodulated off-frequency bands of masking noise at a high spectral level. Crucially, these differences in AM thresholds appear to be unrelated to the small individual differences in pure-tone thresholds at 4 kHz (Fig. 3C).
Concomitantly, we also found large individual differences in binaural measures of temporal coding. As shown in Figure 4, envelope-ITD sensitivity for a carrier frequency of 4 kHz varies over a wide range across listeners, from 6 to 19 dB relative to 100 μs (i.e., from ∼200 to 900 μs). This range is greater and the absolute threshold values higher than typical past reports (Bernstein and Trahiotis, 2002); however, in contrast to most past studies, we presented our stimuli along with relatively high intensity, interaurally uncorrelated off-frequency noise maskers (Bernstein and Trahiotis, 2008). Across listeners, neither measure of temporal coding fidelity correlated with audiometric threshold measurements; however, the two measures were significantly correlated with each other (r = 0.78, p = 6.8e − 6; Fig. 4). Similarly, psychophysical tuning curve bandwidths (ERBs) did not correlate with either AM thresholds (r = 0.11, p > 0.05) or envelope-ITD thresholds (r = 0.21, p > 0.05) at the 5% false-alarm-rate level.
Subcortical neural correlates of temporal coding
To assess temporal coding precision with a physiological measure, EFR magnitudes were extracted using frequency-domain principal component analysis (Bharadwaj and Shinn-Cunningham, 2014). Figure 5B shows the EFRs obtained for the four deepest modulation depths tested. On average, as the modulation depth decreases, the EFR magnitude decreases. Figure 5B also shows traces for a representative sampling of the individual NH subjects (the first 10 enrolled in the study, in chronological order). Whereas some individuals showed a gradual decrease in the EFR magnitude as modulation depth decreases, others showed a more precipitous decrease leading to weak EFR responses at shallow modulation depths. For each subject, we fit a straight line to the EFR magnitudes obtained with the three largest modulation depths (0, −4, and −8 dB) and considered the slope relating EFR magnitude to modulation depth. As shown in Figure 5B, slopes varied from close to 0 dB EFR change per 4 dB of modulation to 12 dB EFR change per 4 dB of modulation. These slopes correlate significantly with behavioral AM thresholds (Fig. 6A). Subjects whose EFR magnitude dropped precipitously with a decrease in input modulation had poorer AM sensitivity (high AM thresholds). For comparison, we also considered the absolute EFR magnitude at a shallow modulation depth (Fig. 6B). These absolute magnitudes also correlated significantly with behavioral AM thresholds (e.g., EFR at −4 dB vs AM thresholds, r = 0.53, p = 0.008); however, the slope of EFR strength versus stimulus modulation depth exhibited a stronger correlation with the perceptual thresholds (r = 0.68, p = 2.5e − 4). To compare the correlations, we used the T2 test, which has been shown to perform well when comparing dependent correlations (Steiger, 1980). Based on this test, the slope metric was a significantly stronger correlate of AM thresholds than the EFR at any single modulation depth (p = 0.03). The EFR slope metric also correlated strongly with the binaural measure of temporal coding (envelope-ITD thresholds, r = 0.54, p = 0.006; Fig. 6C). That the EFR slope metric is a strong correlate of suprathreshold temporal sensitivity conforms to the model predictions of simulated low-SR ANF neuropathy (Bharadwaj et al., 2014). These correlations remained strong when other potential covariates were also included as predictors; specifically, a multiple regression model for the AM thresholds revealed that only the EFR slope was a significant predictor (F(1,18) = 14.3, p = 0.0013), whereas age (F(1,18) = 0.007, p = 0.95), sex (F(1,18) = 0.08, p = 0.77), and audiometric thresholds (F(1,18) = 0.5, p = 0.49) were not. Note, however, that our age range was narrow, with the distribution skewed toward the younger side (only three subjects were older than 30).
Figure 5.

Results of subcortical steady-state response measures. A, Illustration of the stimulus used for EFR measures. The use of off-frequency noise attenuates contributions of tonotopic regions away from 4 kHz. B, Large individual differences are observed in the EFR, particularly at lower modulation depths. Whereas some individuals show strong responses even for shallow modulations, others show a rapid decline in the early neural representation of envelopes as the modulation depth decreases.
Cortical EEG correlates of binaural temporal processing
To explore whether the cortical representation of sound features is affected by the differences in subcortical coding fidelity, we acquired EEG data as listeners performed the envelope-ITD detection task (for the timing of the sequence of events constituting a trial, see Fig. 7A). Both the induced power (Fig. 7B) and the phase-locking (Fig. 7C) spectra show responses locked to the onset of the notched noise, which starts 400 ms before the target modulated tones. The late sustained responses in the induced power (after 1500 ms) are likely related to the motor preparation for the button press response. Although the transposed tones do not induce a change in power compared to baseline, there is a clear phase-locked onset response in the low frequencies (<20 Hz). In addition, both the variable and standard tones elicit ASSRs phase locked to the 40 Hz stimulus modulation frequency (Fig. 7C; onsets at 0 and 0.8 s, respectively).
In general, the MEG/EEG onset response to the second (“probe”) of a pair of identical stimuli is smaller than to the first (the “adaptor”), a result typically attributed to adaptation (Jääskeläinen et al., 2004). When the adaptor differs from the probe in one or more attributes, the response to the probe is less adapted/suppressed (Jääskeläinen et al., 2004). We used this fact to test cortical sensitivity to changes in ITDs. We explored how the response to a standard probe tone with 0 ITD depended on the ITD of a preceding variable-ITD adaptor. To quantify the adaptation of cortical onset responses, we computed the aggregate of the phase-locked EEG response from 0 to 20 Hz. We did this separately for trials where the envelope ITD in the adaptor was large (400 and 800 μs; greater than the median threshold) versus when it was small (50, 100, and 200 μs; smaller than the median threshold; see Fig. 7D). We found that when the ITD of the adaptor was small (i.e., more similar to the probe), the response to the subsequent 0-ITD probe was smaller than when the ITD of the adaptor was large (i.e., more dissimilar to the probe; paired t test, t = 2.8, p = 0.01). This difference is a form of envelope-ITD-specific adaptation similar to what has been reported previously for stimuli with broadband ITDs (Salminen et al., 2010). For each individual, we computed the “adaptation ratio” by computing the ratio of the probe onset response when preceded by a large-ITD adaptor compared to a small-ITD adaptor. A weak but statistically significant negative correlation was found between the envelope-ITD threshold and the adaptation ratio across individuals (r = −0.34, p = 0.04). In other words, listeners who have relatively poor sensitivity and large behavioral thresholds tend to have small onset responses to the standard tone preceded by a large-ITD tone, as if for them the large-ITD variable tones are perceptually similar to the 0-ITD standard tone. These results suggest that subcortical temporal coding fidelity varies across NH listeners, affecting both behavior and cortical physiology.
In contrast with the 100 Hz EFR, analysis of the 40 Hz cortical ASSR revealed that there were considerable across-subject differences in the background cortical activity around the 40 Hz region. This may be due to anatomical factors, task-related background cortical activity, as well as other factors. Thus, we did not pursue any further analysis of this response.
Relationship between attention task performance and correlates of cochlear mechanics and suprathreshold temporal coding
Listeners reported the content of one of two simultaneous streams of spoken, monotonized digit sequences based on direction, which was controlled by imposing different ITDs on the streams (Fig. 8A). Results revealed significant individual differences, with performance ranging from chance level to ceiling (Fig. 8B). Errors generally arose because listeners reported the masker instead of the target, not from lapses in intelligibility or memory; specifically, 91% of the incorrectly reported digits appeared in the masking stream at the same position in the sequence. This suggests that sensory encoding limitations made it difficult to spatially resolve the target and masker, leading to attentional selection errors. To evaluate the relative contributions of peripheral processing and neural temporal coding to individual differences in the spatial attention task, we entered the data into a generalized linear regression analysis. Performance (number of correct responses) was modeled as coming from a binomial distribution. The latent binomial parameter was modeled through a logit link function using a linear mixed model (Hadfield, 2010) with ITD, individual EFR slopes, and DPOAE thresholds as explanatory variables. Inference was performed using MCMC sampling from the posterior. The coefficient of the DPOAE term was not distinguishable from zero, whereas the EFR term was significant (p = 0.0024). The marginal posterior of the coefficient of the EFR term was unimodal, with a 95% highest-posterior-density interval (Box and Tiao, 2011) spanning −5.9 to 0.95% with a mean of −3.5%; that is, for every 1 dB/4 dB steepening of the EFR slope, the probability of a correct response dropped by an average of 3.5%. Not surprisingly, the effect of ITD was also significant (p = 0.004), suggesting, along with the error patterns, that sensory limitations were a key determinant of performance. Thus, for this particular spatial attention task, individual differences in temporal coding accounted for much of the variance in performance.
Noise-exposure history
To get a sense of the relationship between noise exposure and subcortical temporal coding, we asked our subjects to rate their own exposure on a closed scale. Exposure history was assessed by considering the frequency that listeners reported attending concerts, loud parties, and sports venues and using earphones. In addition, subjects indicated whether they recalled ever having temporary threshold shifts (“losing sensitivity to faint sounds for a while”) following noise exposure. Subjects were divided into two groups (“more exposed” and “less exposed”) based on their responses, with equal weight given to all categories of exposure. Compared to the less exposed group, the more exposed group had a significantly steeper EFR slope (t(23) = 1.92, p = 0.034) along with higher AM (t(23) = 1.97, p = 0.03) and envelope-ITD (t(23) = 2.35, p = 0.014) thresholds compared to the less exposed group. These effects remain marginally significant when the false discovery rate for multiple comparisons is controlled at 5% (Benjamini and Hochberg, 1995). Given the relatively crude characterization of noise-exposure history, correlations between all the temporal coding measures, and the size of our cohort, this result should to be interpreted with caution.
Discussion
In the conventional view, hearing loss is associated with cochlear mechanical anomalies, typically caused by hair cell loss or damage to mechanosensory hair bundles (for a detailed treatment, see Moore, 2007). In contrast, previous animal studies showed that moderate noise exposure and early aging can produce synapse/neuronal loss without changes to cochlear mechanics and with no hair cell loss—a completely different form of sensorineural hearing loss (Kujawa and Liberman, 2009; Makary et al., 2011; Sergeyenko et al., 2013).
Here, we investigated whether perceptual differences in the general population of NH listeners who have no known hearing deficits are consistent with this mechanism of synaptopathy/neuropathy (Bharadwaj et al., 2014). Our measures were designed to reveal differences in suprathreshold coding fidelity, using stimuli with relatively high sound levels, competing maskers, and subtle temporal features. These choices were important for two reasons: (1) temporal coding deficits that are not apparent in ordinary laboratory conditions may be exposed under such more challenging regimes (Fig. 1), and (2) low-SR fibers, which are especially vulnerable to neuropathy (Fig. 2) are likely to contribute more under such conditions. Specifically, compared to high-SR fibers, the low-SR ANFs are more resistant to masking (Costalupes, 1985), and exhibit more robust synchrony to both envelope and fine structure in high-intensity sounds (Johnson, 1980; Joris and Yin, 1992). To help isolate where differences arise, we evaluated peripheral transduction, early neural coding, cortical sensitivity to ITDs, and suprathreshold temporal perception. We found large variations in perceptual ability on both low-level psychophysical tasks and a high-level selective attention task; across subjects, these behavioral measures strongly correlated with physiological measures of suprathreshold temporal coding. Furthermore, we established that differences in cortical sensitivity of binaural information inherit some of the differences in the fidelity of early neural temporal coding. Crucially, independent measures of cochlear amplifier function, though correlated with each other, accounted for very little of the variability in attention task performance and were uncorrelated with psychophysical and physiological measures of suprathreshold temporal coding. Together, these results demonstrate that individual differences in NH listeners are in part driven by differences originating very early in the neural (and not mechanotransduction-related) portions of the auditory pathway.
To quantify physiological coding strength, we settled on the slope of the EFR as a function of modulation depth. Whereas absolute EFR strength (Fig. 6B) also correlated with behavioral performance, the EFR slope proved to be more a sensitive correlate of perceptual ability. This is likely both because the EFR slope (1) helps normalize differences in EFR magnitude due to individual differences in measurement noise, brain tissue geometry, and other phenomena leading to purely linear transformations of the responses, and (2) emphasizes coding fidelity of shallow stimulus modulations at high sound levels, where low-SR ANFs likely contribute significantly to coding (Bharadwaj et al., 2014). Consistent with the interpretation that differences are present as early as at the level of the auditory nerve, the EFR slope correlated with sensitivity to both monaural and interaural temporal information. Furthermore, the efficacy of the EFR slope in exposing individual differences is in accordance with a previous computational model of low-SR neuropathy (Bharadwaj et al., 2014). Of course, unlike in animal models, we cannot manipulate or measure cochlear neuropathy in humans directly; our interpretation is based on indirect evidence. Still, the observed pattern of results is consistent with that mechanism.
We found robust correlations across various measures of temporal coding, but no correlation between measures of cochlear mechanical function and perceptual abilities. Of course, if a larger cohort of NH participants were tested, residual differences in cochlear mechanics could well explain a significant portion of the individual variability. Regardless, our results raise the possibility that noise-induced neuropathy is a significant contributor to what has until now been viewed as “normal” variability in perceptual hearing ability. Indeed, an estimated 17% of the general population experience occupational noise at levels sufficient to produce temporary threshold shifts and have subsequent hearing difficulties that are attributable to this exposure (Tak and Calvert, 2008; Tak et al., 2009). Recreational noise exposure is more difficult to quantify; however, estimates suggest that exposures can often exceed 100 dB SPL (Clark, 1991). Previous evidence suggests that even moderate exposures over extended periods are neuropathic (Maison et al., 2013). Thus, in modern society, where noise exposure is common, it is plausible that interindividual variability in hearing ability may partly originate from hidden deficits caused by noise exposure or its interactions with aging and genetic susceptibility (Davis et al., 2003; Kujawa and Liberman, 2006). The correlations, albeit weak, between temporal coding measures and noise-exposure history support the notion that neuropathy may be present even in normal-hearing listeners. Recent independent findings relating noise-exposure to EFR measures are consistent with this interpretation (Plack et al., 2014). Stone and Moore (2014) found that higher levels of recreational noise exposure in young listeners were associated with poorer AM detection thresholds, but only at lower sound levels. The low level effect is consistent with the loss of high-SR fibers; indeed, an ∼40% loss of overall synapse count (Lin et al., 2011a) accompanied by change in population statistics of high-SR/low-SR counts from 55/45 to ∼75/25 is consistent with some high-SR neuropathy being present (Fig. 2). That Stone and Moore (2014) did not see noise-exposure effects at higher sound levels may possibly be due to associated increases in absolute thresholds that they found; outer hair cell loss can cause broadened tuning and loudness recruitment leading to improved AM detection at higher levels (Moore et al., 1996). Additional studies are needed to clarify these issues and assess the sensitivity of behavioral and EFR-based approaches in revealing noise damage when multiple mechanisms are involved simultaneously.
In real-world situations, selective attention performance depends on many nonsensory factors such as language ability, memory, etc. (Conway et al., 2001; Surprenant and Watson, 2001; Kidd et al., 2007). However, in this study, we wanted to determine whether sensory coding fidelity of suprathreshold sound impacts the ability to communicate in everyday settings. Accordingly, we designed a spatial attention task where language and memory demands were low and sensory encoding limitations were the likely bottleneck on performance. Error patterns confirm that we achieved this goal. The fact that selective attention performance correlates with suprathreshold coding fidelity lends credence to the idea that neuropathy influences how well listeners can communicate in daily life. Although aging and noise exposure likely contribute to suprathreshold hearing deficits, inherent variability from genetic, epigenetic, and experiential factors no doubt also influence individual outcomes. Experience- and training-dependent long-term plasticity effects are known to affect processing at various stages of the auditory system and can improve behavioral performance in auditory tasks (Russo et al., 2005; Polley et al., 2006). Additional studies are needed to assess the contribution of such long-term plasticity to the differences in electrophysiological measures (such as the EFR) in the general NH population and to ascertain the degree to which such plasticity can ameliorate the effects of neuropathy. Individual differences in the olivocochlear efferent system and middle ear reflexes also must be examined (Backus and Guinan, 2007); however, the relationship between efferent effects and EFR measures is likely complicated given that (1) activation of the efferent system may help protect listeners from noise-induced cochlear neuropathy (Maison et al., 2013) and (2) low-SR nerve activity may be linked to the acoustic activation of the efferent system and the stapedius reflexes (Liberman, 1988; Kobler et al., 1992). Thus, once some degree of neurodegeneration occurs, it is possible that the efferent system may become less effective, leading to further damage. Additional studies are needed to understand the undoubtedly complex relationships between long-term plasticity, efferent function, middle-ear reflexes, and neuropathy.
We conclude that NH listeners from the general population vary significantly in how sensitive they are to suprathreshold temporal structure in sound. These differences appear to be unrelated to cochlear transduction, consistent with the insensitivity of the audiogram to such differences. Instead, results suggest that these differences come from the fidelity with which temporal features are encoded by very early levels of the neural pathway and are consistent with cochlear neuropathy degrading suprathreshold hearing ability in some listeners. These deficits may not be evident in quiet settings, but will affect how well listeners communicate in common social settings. In the field of hearing science, there is a growing belief that such hidden hearing loss is a underrecognized and poorly understood public-health concern. Hidden hearing loss has also been hypothesized to underlie tinnitus in listeners with normal audiograms (Schaette and McAlpine, 2011; Eggermont and Roberts, 2014; Plack et al., 2014). Thus there is tremendous interest in objective assessment tools for such deficits. Our results suggest that EFR-based measures are promising in this respect. Additional experiments are needed to develop targeted methods for the assessment, detailed characterization, and prevention of such hidden hearing loss.
Footnotes
This work was supported by a fellowship from the Office of Assistant Secretary of Defense for Research and Engineering to B.G.S.-C.
References
- Backus BC, Guinan JJ., Jr Measurement of the distribution of medial olivocochlear acoustic reflex strengths across normal-hearing individuals via otoacoustic emissions. J Assoc Res Otolaryngol. 2007;8:484–496. doi: 10.1007/s10162-007-0100-0. [DOI] [PMC free article] [PubMed] [Google Scholar]
- Benjamini Y, Hochberg Y. Controlling the false discovery rate: a practical and powerful approach to multiple testing. J Royal Stat Soc Series B Stat Methodol. 1995;57:289–300. [Google Scholar]
- Bernstein LR, Trahiotis C. Enhancing sensitivity to interaural delays at high frequencies by using “transposed stimuli.”. J Acoust Soc Am. 2002;112:1026–1036. doi: 10.1121/1.1497620. [DOI] [PubMed] [Google Scholar]
- Bernstein LR, Trahiotis C. Discrimination of interaural temporal disparities conveyed by high-frequency sinusoidally amplitude-modulated tones and high-frequency transposed tones: effects of spectrally flanking noises. J Acoust Soc Am. 2008;124:3088–3094. doi: 10.1121/1.2980523. [DOI] [PMC free article] [PubMed] [Google Scholar]
- Bharadwaj HM, Shinn-Cunningham BG. Rapid acquisition of auditory subcortical steady-state responses using multichannel recordings. Clin Neurophysiol. 2014;125:1878–1888. doi: 10.1016/j.clinph.2014.01.011. [DOI] [PMC free article] [PubMed] [Google Scholar]
- Bharadwaj HM, Verhulst S, Shaheen L, Liberman MC, Shinn-Cunningham BG. Cochlear neuropathy and the coding of supra-threshold sound. Front Syst Neurosci. 2014;8:26. doi: 10.3389/fnsys.2014.00026. [DOI] [PMC free article] [PubMed] [Google Scholar]
- Blauert J. Spatial hearing: the psychophysics of human sound localization. Cambridge, MA: MIT; 1997. [Google Scholar]
- Box GE, Tiao GC. Bayesian inference in statistical analysis. Vol 40. New York: Wiley; 2011. [Google Scholar]
- Chermak GD, Musiek FE. Central auditory processing disorders: new perspectives. San Diego: Singular; 1997. [Google Scholar]
- Christiansen C, MacDonald EN, Dau T. Contribution of envelope periodicity to release from speech-on-speech masking. J Acoust Soc Am. 2013;134:2197–2204. doi: 10.1121/1.4816409. [DOI] [PubMed] [Google Scholar]
- Clark WW. Noise exposure from leisure activities: a review. J Acoust Soc Am. 1991;90:175–181. doi: 10.1121/1.401285. [DOI] [PubMed] [Google Scholar]
- Conway A, Cowan N, Bunting M. The cocktail party phenomenon revisited: the importance of working memory capacity. Psychon Bull Rev. 2001;8:331–335. doi: 10.3758/BF03196169. [DOI] [PubMed] [Google Scholar]
- Cooper J, Jr, Gates GA. Hearing in the elderly–the Framingham cohort, 1983–1985: Part II. Prevalence of central auditory processing disorders. Ear Hear. 1991;12:304–311. doi: 10.1097/00003446-199110000-00002. [DOI] [PubMed] [Google Scholar]
- Costalupes JA. Representation of tones in noise in the responses of auditory nerve fibers in cats. I. Comparison with detection thresholds. J Neurosci. 1985;5:3261–3269. doi: 10.1523/JNEUROSCI.05-12-03261.1985. [DOI] [PMC free article] [PubMed] [Google Scholar]
- Darwin C. Auditory grouping. Trends Cogn Sci. 1997;1:327–333. doi: 10.1016/S1364-6613(97)01097-8. [DOI] [PubMed] [Google Scholar]
- Davis R, Kozel P, Erway L. Genetic influences in individual susceptibility to noise: a review. Noise Health. 2003;5:19–28. [PubMed] [Google Scholar]
- Dubno J. Effects of age and mild hearing loss on speech recognition in noise. J Acoust Soc Am. 1984;76:87–96. doi: 10.1121/1.391011. [DOI] [PubMed] [Google Scholar]
- Eggermont JJ, Roberts LE. Tinnitus: animal models and findings in humans. Cell Tissue Res. 2014 doi: 10.1007/s00441-014-1992-8. doi: 10.1007/s00441-014-1992-8. Advance online publication. [DOI] [PMC free article] [PubMed] [Google Scholar]
- Fitzgibbons PJ, Gordon-Salant S. The aging auditory system, pp 111–134. New York: Springer; 2010. Behavioral studies with aging humans: hearing sensitivity and psychoacoustics. [Google Scholar]
- Furman AC, Kujawa SG, Liberman MC. Noise-induced cochlear neuropathy is selective for fibers with low spontaneous rates. J Neurophysiol. 2013;110:577–586. doi: 10.1152/jn.00164.2013. [DOI] [PMC free article] [PubMed] [Google Scholar]
- Gatehouse S, Noble W. The speech, spatial and qualities of hearing scale (SSQ) Int J Audiol. 2004;43:85–99. doi: 10.1080/14992020400050014. [DOI] [PMC free article] [PubMed] [Google Scholar]
- Grose J, Mamo S. Processing of temporal fine structure as a function of age. Ear Hear. 2010;31:755–760. doi: 10.1097/AUD.0b013e3181e627e7. [DOI] [PMC free article] [PubMed] [Google Scholar]
- Hadfield JD. MCMC methods for multi-response generalized linear mixed models: the MCMCglmm R package. J Stat Softw. 2010;33:1–22. [Google Scholar]
- Herdman AT, Lins O, Van Roon P, Stapells DR, Scherg M, Picton TW. Intracerebral sources of human auditory steady-state responses. Brain Topogr. 2002;15:69–86. doi: 10.1023/A:1021470822922. [DOI] [PubMed] [Google Scholar]
- Hind SE, Haines-Bazrafshan R, Benton CL, Brassington W, Towle B, Moore DR. Prevalence of clinical referrals having hearing thresholds within normal limits. Int J Audiol. 2011;50:708–716. doi: 10.3109/14992027.2011.582049. [DOI] [PubMed] [Google Scholar]
- Jääskeläinen IP, Ahveninen J, Bonmassar G, Dale AM, Ilmoniemi RJ, Levänen S, Lin F-H, May P, Melcher J, Stufflebeam S, et al. Human posterior auditory cortex gates novel sounds to consciousness. Proc Natl Acad Sci U S A. 2004;101(17):6809–6814. doi: 10.1073/pnas.0303760101. [DOI] [PMC free article] [PubMed] [Google Scholar]
- Johnson DH. The relationship between spike rate and synchrony in responses of auditory-nerve fibers to single tones. J Acoust Soc Am. 1980;68:1115–1122. doi: 10.1121/1.384982. [DOI] [PubMed] [Google Scholar]
- Johnson TA, Neely ST, Garner CA, Gorga MP. Influence of primary-level and primary-frequency ratios on human distortion product otoacoustic emissions. J Acoust Soc Am. 2006;119:418–428. doi: 10.1121/1.2133714. [DOI] [PMC free article] [PubMed] [Google Scholar]
- Joris PX, Yin TC. Responses to amplitude-modulated tones in the auditory nerve of the cat. J Acoust Soc Am. 1992;91:215–232. doi: 10.1121/1.402757. [DOI] [PubMed] [Google Scholar]
- Joris PX, Carney LH, Smith PH, Yin TC. Enhancement of neural synchronization in the anteroventral cochlear nucleus I. Responses to tones at the characteristic frequency. J Neurophysiol. 1994;71:1022–1036. doi: 10.1152/jn.1994.71.3.1022. [DOI] [PubMed] [Google Scholar]
- Kidd G, Watson C, Gygi B. Individual differences in auditory abilities. J Acoust Soc Am. 2007;122:418–435. doi: 10.1121/1.2743154. [DOI] [PubMed] [Google Scholar]
- Kiren T, Aoyagi M, Furuse H, Koike Y. An experimental study on the generator of amplitude-modulation following response. Acta Otolaryngol Suppl. 1994;511:28–33. [PubMed] [Google Scholar]
- Kobler J, Guinan JJ, Jr, Vacher S, Norris B. Acoustic reflex frequency selectivity in single stapedius motoneurons of the cat. J Neurophysiol. 1992;68:807–817. doi: 10.1152/jn.1992.68.3.807. [DOI] [PubMed] [Google Scholar]
- Kujawa S, Liberman M. Adding insult to injury: Cochlear nerve degeneration after “temporary” noise-induced hearing loss. J Neurosci. 2009;29:14077–14085. doi: 10.1523/JNEUROSCI.2845-09.2009. [DOI] [PMC free article] [PubMed] [Google Scholar]
- Kujawa SG, Liberman MC. Acceleration of age-related hearing loss by early noise exposure: evidence of a misspent youth. J Neurosci. 2006;26:2115–2123. doi: 10.1523/JNEUROSCI.4985-05.2006. [DOI] [PMC free article] [PubMed] [Google Scholar]
- Kumar G, Amen F, Roy D. Normal hearing tests: is a further appointment really necessary? J R Soc Med. 2007;100:66. doi: 10.1258/jrsm.100.2.66-a. [DOI] [PMC free article] [PubMed] [Google Scholar]
- Kuss M, Jäkel F, Wichmann FA. Bayesian inference for psychometric functions. J Vis. 2005;5(8):478–492. doi: 10.1167/5.5.8. [DOI] [PubMed] [Google Scholar]
- Kuwada S, Anderson JS, Batra R, Fitzpatrick DC, Teissier N, D'Angelo WR. Sources of the scalp-recorded amplitude modulation following response. J Am Acad Audiol. 2002;13:188–204. [PubMed] [Google Scholar]
- Liberman MC. Physiology of cochlear efferent and afferent neurons: direct comparisons in the same animal. Hear Res. 1988;34:179–191. doi: 10.1016/0378-5955(88)90105-0. [DOI] [PubMed] [Google Scholar]
- Lin FR, Niparko JK, Ferrucci L. Hearing loss prevalence in the United States. Arch Intern Med. 2011a;171:1851–1853. doi: 10.1001/archinternmed.2011.506. [DOI] [PMC free article] [PubMed] [Google Scholar]
- Lin HW, Furman AC, Kujawa SG, Liberman MC. Primary neural degeneration in the Guinea pig cochlea after reversible noise-induced threshold shift. J Assoc Res Otolaryngol. 2011b;12:605–616. doi: 10.1007/s10162-011-0277-0. [DOI] [PMC free article] [PubMed] [Google Scholar]
- Lobarinas E, Salvi R, Ding D. Insensitivity of the audiogram to carboplatin induced inner hair cell loss in chinchillas. Hear Res. 2013;302:113–120. doi: 10.1016/j.heares.2013.03.012. [DOI] [PMC free article] [PubMed] [Google Scholar]
- Lopez-Poveda EA, Barrios P. Perception of stochastically undersampled sound waveforms: a model of auditory deafferentation. Front Neurosci. 2013;7:124. doi: 10.3389/fnins.2013.00124. [DOI] [PMC free article] [PubMed] [Google Scholar]
- Maison SF, Usubuchi H, Liberman MC. Efferent feedback minimizes cochlear neuropathy from moderate noise exposure. J Neurosci. 2013;33:5542–5552. doi: 10.1523/JNEUROSCI.5027-12.2013. [DOI] [PMC free article] [PubMed] [Google Scholar]
- Makary CA, Shin J, Kujawa SG, Liberman MC, Merchant SN. Age-related primary cochlear neuronal degeneration in human temporal bones. J Assoc Res Otolaryngol. 2011;12:711–717. doi: 10.1007/s10162-011-0283-2. [DOI] [PMC free article] [PubMed] [Google Scholar]
- Moore BC. Cochlear hearing loss: physiological, psychological and technical issues. Ed 2. New York: Wiley; 2007. [Google Scholar]
- Moore BC. The role of temporal fine structure processing in pitch perception, masking, and speech perception for normal-hearing and hearing-impaired people. J Assoc Res Otolaryngol. 2008;9:399–406. doi: 10.1007/s10162-008-0143-x. [DOI] [PMC free article] [PubMed] [Google Scholar]
- Moore BC, Wojtczak M, Vickers DA. Effect of loudness recruitment on the perception of amplitude modulation. J Acoust Soc Am. 1996;100:481–489. doi: 10.1121/1.415861. [DOI] [Google Scholar]
- Oxenham AJ, Shera CA. Estimates of human cochlear tuning at low levels using forward and simultaneous masking. J Assoc Res Otolaryngol. 2003;4:541–554. doi: 10.1007/s10162-002-3058-y. [DOI] [PMC free article] [PubMed] [Google Scholar]
- Patterson RD. Auditory filter shapes derived with noise stimuli. J Acoust Soc Am. 1976;59:640–654. doi: 10.1121/1.380914. [DOI] [PubMed] [Google Scholar]
- Picton TW, John MS, Dimitrijevic A, Purcell D. Human auditory steady-state responses. Int J Audiol. 2003;42:177–219. doi: 10.3109/14992020309101316. [DOI] [PubMed] [Google Scholar]
- Pierson LL, Gerhardt KJ, Rodriguez GP, Yanke RB. Relationship between outer ear resonance and permanent noise-induced hearing loss. Am J Otolaryngol. 1994;15:37–40. doi: 10.1016/0196-0709(94)90038-8. [DOI] [PubMed] [Google Scholar]
- Pinheiro J, Bates D. Mixed-effects models in S and S-PLUS. New York: Springer; 2000. [Google Scholar]
- Plack CJ, Barker D, Prendergast G. Perceptual consequences of “hidden” hearing loss. Trends Hear. 2014;18:2331216514550621. doi: 10.1177/2331216514550621. [DOI] [PMC free article] [PubMed] [Google Scholar]
- Polley DB, Steinberg EE, Merzenich MM. Perceptual learning directs auditory cortical map reorganization through top-down influences. J Neurosci. 2006;26:4970–4982. doi: 10.1523/JNEUROSCI.3771-05.2006. [DOI] [PMC free article] [PubMed] [Google Scholar]
- Ruggles DR, Bharadwaj HM, Shinn-Cunningham BG. Why middle-aged listeners have trouble hearing in everyday settings. Curr Biol. 2012;22:1417–1422. doi: 10.1016/j.cub.2012.05.025. [DOI] [PMC free article] [PubMed] [Google Scholar]
- Ruggles D, Bharadwaj H, Shinn-Cunningham B. Normal hearing is not enough to guarantee robust encoding of suprathreshold features important in everyday communication. Proc Natl Acad Sci U S A. 2011;108:15516–15521. doi: 10.1073/pnas.1108912108. [DOI] [PMC free article] [PubMed] [Google Scholar]
- Russo N, Nicol T, Zecker S, Hayes E, Kraus N. Auditory training improves neural timing in the human brainstem. Behav Brain Res. 2005;156:95–103. doi: 10.1016/j.bbr.2004.05.012. [DOI] [PubMed] [Google Scholar]
- Salminen NH, Tiitinen H, Yrttiaho S, May PJ. The neural code for interaural time difference in human auditory cortex. J Acoust Soc Am. 2010;127:EL60–EL65. doi: 10.1121/1.3290744. [DOI] [PubMed] [Google Scholar]
- Saunders G, Haggard M. The clinical assessment of “obscure auditory dysfunction” (OAD) 2. Case control analysis of determining factors. Ear Hear. 1992;13:241–254. doi: 10.1097/00003446-199208000-00006. [DOI] [PubMed] [Google Scholar]
- Schaette R, McAlpine D. Tinnitus with a normal audiogram: physiological evidence for hidden hearing loss and computational model. J Neurosci. 2011;31(38):13452–13457. doi: 10.1523/JNEUROSCI.2156-11.2011. [DOI] [PMC free article] [PubMed] [Google Scholar]
- Schmiedt R, Mills J, Boettcher F. Age-related loss of activity of auditory-nerve fibers. J Neurophysiol. 1996;76:2799–2803. doi: 10.1152/jn.1996.76.4.2799. [DOI] [PubMed] [Google Scholar]
- Schuknecht HF, Woellner RC. An experimental and clinical study of deafness from lesions of the cochlear nerve. J Laryngol Otol. 1955;69:75–97. doi: 10.1017/S0022215100050465. [DOI] [PubMed] [Google Scholar]
- Sergeyenko Y, Lall K, Liberman MC, Kujawa SG. Age-related cochlear synaptopathy: an early-onset contributor to auditory functional decline. J Neurosci. 2013;33:13686–13694. doi: 10.1523/JNEUROSCI.1783-13.2013. [DOI] [PMC free article] [PubMed] [Google Scholar]
- Shamma SA, Elhilali M, Micheyl C. Temporal coherence and attention in auditory scene analysis. Trends Neurosci. 2011;34:114–123. doi: 10.1016/j.tins.2010.11.002. [DOI] [PMC free article] [PubMed] [Google Scholar]
- Snell KB, Frisina DR. Relationships among age-related differences in gap detection and word recognition. J Acoust Soc Am. 2000;107:1615–1626. doi: 10.1121/1.428446. [DOI] [PubMed] [Google Scholar]
- Snell K, Mapes F, Hickman E, Frisina D. Word recognition in competing babble and the effects of age, temporal processing, and absolute sensitivity. J Acoust Soc Am. 2002;112:720–727. doi: 10.1121/1.1487841. [DOI] [PubMed] [Google Scholar]
- Steiger JH. Tests for comparing elements of a correlation matrix. Psychol Bull. 1980;87:245. doi: 10.1037/0033-2909.87.2.245. [DOI] [Google Scholar]
- Stone MA, Moore BC. Amplitude-modulation detection by recreational-noise-exposed humans with near-normal hearing thresholds and its medium-term progression. Hear Res. 2014;317:50–62. doi: 10.1016/j.heares.2014.09.005. [DOI] [PMC free article] [PubMed] [Google Scholar]
- Strelcyk O, Dau T. Relations between frequency selectivity, temporal fine-structure processing, and speech reception in impaired hearing. J Acoust Soc Am. 2009;125:3328–3345. doi: 10.1121/1.3097469. [DOI] [PubMed] [Google Scholar]
- Surprenant A, Watson C. Individual differences in the processing of speech and nonspeech sounds by normal-hearing listeners. J Acoust Soc Am. 2001;110:2085–2095. doi: 10.1121/1.1404973. [DOI] [PubMed] [Google Scholar]
- Tak S, Calvert GM. Hearing difficulty attributable to employment by industry and occupation: an analysis of the National Health Interview Survey–United States, 1997 to 2003. J Occup Environ Med. 2008;50:46–56. doi: 10.1097/JOM.0b013e3181579316. [DOI] [PubMed] [Google Scholar]
- Tak S, Davis RR, Calvert GM. Exposure to hazardous workplace noise and use of hearing protection devices among US workers–NHANES, 1999–2004. Am J Indust Med. 2009;52:358–371. doi: 10.1002/ajim.20690. [DOI] [PubMed] [Google Scholar]
- Viemeister NF. Temporal modulation transfer functions based upon modulation thresholds. J Acoust Soc Am. 1979;66:1364–1380. doi: 10.1121/1.383531. [DOI] [PubMed] [Google Scholar]
- Yost W. Fundamentals of hearing: an introduction. Ed 5. San Diego: Academic; 2007. The abnormal auditory system. [Google Scholar]
- Zeng F, Nie K, Stickney G, Kong Y, Vongphoe M, Bhargave A, Wei C, Cao K. Speech recognition with amplitude and frequency modulations. Proc Natl Acad Sci U S A. 2005;102:2293–2298. doi: 10.1073/pnas.0406460102. [DOI] [PMC free article] [PubMed] [Google Scholar]
- Zhao F, Stephens D. Hearing complaints of patients with King-Kopetzky syndrome (obscure auditory dysfunction) Br J Audiol. 1996;30:397–402. doi: 10.3109/03005369609078427. [DOI] [PubMed] [Google Scholar]
- Zhu L, Bharadwaj H, Xia J, Shinn-Cunningham B. A comparison of spectral magnitude and phase-locking value analyses of the frequency-following response to complex tones. J Acoust Soc Am. 2013;134:384–395. doi: 10.1121/1.4807498. [DOI] [PMC free article] [PubMed] [Google Scholar]
- Zilany MSA, Bruce IC, Carney LH. Updated parameters and expanded simulation options for a model of the auditory periphery. J Acoust Soc Am. 2014;135:283–286. doi: 10.1121/1.4837815. [DOI] [PMC free article] [PubMed] [Google Scholar]