

Abstract
Aims
Availability of normative reference values for cardiac chamber quantitation is a prerequisite for accurate clinical application of echocardiography. In this study, we report normal reference ranges for cardiac chambers size obtained in a large group of healthy volunteers accounting for gender and age. Echocardiographic data were acquired using state-of-the-art cardiac ultrasound equipment following chamber quantitation protocols approved by the European Association of Cardiovascular Imaging.
Methods
A total of 734 (mean age: 45.8 ± 13.3 years) healthy volunteers (320 men and 414 women) were enrolled at 22 collaborating institutions of the Normal Reference Ranges for Echocardiography (NORRE) study. A comprehensive echocardiographic examination was performed on all subjects following pre-defined protocols. There were no gender differences in age or cholesterol levels. Compared with men, women had significantly smaller body surface areas, and lower blood pressure. Quality of echocardiographic data sets was good to excellent in the majority of patients. Upper and lower reference limits were higher in men than in women. The reference values varied with age. These age-related changes persisted for most parameters after normalization for the body surface area.
Conclusion
The NORRE study provides useful two-dimensional echocardiographic reference ranges for cardiac chamber quantification. These data highlight the need for body size normalization that should be performed together with age-and gender-specific assessment for the most echocardiographic parameters.
Keywords: Two-dimensional echocardiography, Chamber size and function, Reference values
Introduction
Thanks to its versatility, the indications for echocardiography have progressively expanded. In fact, transthoracic echocardiography has become the standard imaging modality for the assessment of cardiovascular anatomy, function, and physiology in clinical practice. However, as for all imaging modalities the interpretation depends upon the availability of robust reference limits that define ‘normalcy’.1 Currently, available echocardiographic reference values are mostly based on cross-sectional studies including a mixture of published and unpublished reports or selected samples using a variety of mostly dated echocardiographic techniques.2–4 The Normal Reference Ranges for Echocardiography (NORRE) study is the first European large multi-centre study involving accredited echocardiography laboratories of the European Association of Cardiovascular Imaging (EACVI).5 The NORRE study provides a set of normal contemporary echocardiographic values obtained from a large cohort of healthy subjects over a wide range of ages acquired using recommended echocardiographic approaches. In this study, we report the reference ranges for all cardiac chamber sizes taking into account gender and age.
Methods
Patient population
A total of 865 normal European subjects were enrolled at 22 echocardiographically accredited collaborating European institutions. After exclusion of patients (n = 131) due to incompatible image format, poor image quality, high body mass index/abnormal glycaemia values, cardiac pathology detected by echocardiography, the final study population consisted of 734 healthy subjects with a mean age of 45.8 ± 13.3 years (range: 20–78). A comprehensive echocardiographic examination was performed in all patients. The study protocol was approved by the local ethics committees.
Echocardiographic examination
A comprehensive echocardiographic examination was performed using state-of-the-art echocardiographic ultrasound systems (GE Vivid E9, Vingmed Ultrasound, Horten, Norway, and/or iE33, Philips Medical Systems, Andover, MA, USA) following recommended protocols approved by EACVI.5,6 All Doppler-echocardiographic images were recorded in a digital raw-data format (native DICOM format) and centralized, after anonymization, at the EACVI Central Core Laboratory at the University of Liège, Belgium. A minimum of three cardiac cycles were recorded for analysis. All three standard left ventricular (LV) apical views (four-, two-, three-chamber views) were acquired avoiding LV foreshortening. The LV outflow tract (LVOT) diameters were measured at the aortic valve annulus (distal) and 0.5–1 cm below the aortic cups (proximal) from a zoomed parasternal long-axis acoustic window (Figure 1). Interventricular septal and posterior wall thicknesses at end-diastole and LV internal dimension at both end-diastole and end-systole were measured from the parasternal long-axis acoustic window. LV end-diastolic and end-systolic volumes were measured using the biplane method of discs' summation (modified Simpson's rule) using two-dimensional (2D) images from both the apical four- and two-chamber views (Figure 2). LV ejection fraction was then calculated from the respective 2D LV volumes. The LV mass was calculated from linear measurements obtained from parasternal views. Assessment of right ventricular (RV) size was performed by measuring RV end-diastolic and end-systolic areas as well as end-diastolic mid- and basal-cavity diameters from the apical four-chamber view (Figure 3). The RV fractional area change (FAC) was calculated by the equation 100 × (end-diastolic area – end-systolic area)/end-diastolic area. The 2D RV outflow tract diameters were measured from the parasternal long-axis (proximal) and the short-axis views (proximal and distal) at the level of the aortic valve. LA length and trasverse major and minor axis were measured from the apical four-chamber view. LA volume was measured at end-systole using the biplane discs' summation (Simpson's) method from dedicated 2D images of the left atrium acquired in both the apical four- and two-chamber views. Right atrial (RA) size was assessed at end-systole by measuring the minor and major axes from the apical four-chamber view. RA volume was measured by the monoplane Simpson disc method (Figure 4).
Figure 1.
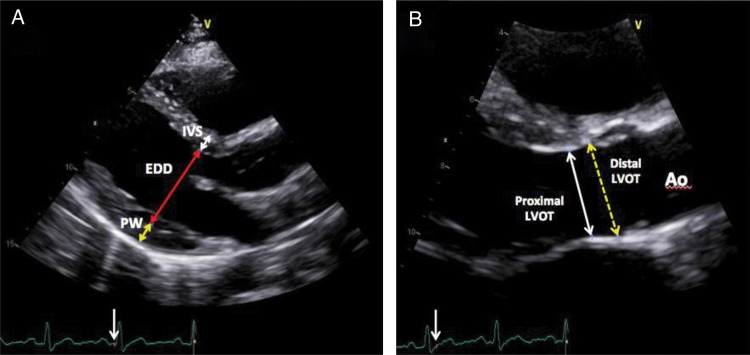
(A) Two-dimensional-guided measurement of left ventricle wall thickness in end-diastole from the left parasternal long-axis view. The interventricular septum thickness (white arrow), the left ventricle end-diastolic diameter (red arrow) and the posterior wall (PW; yellow arrow) thickness are measured just distal to the mitral leaflets tips, perpendicular to the long axis of the LV. (B) Proximal left ventricle outflow tract (LVOT) diameter was measured in mid-systole, using the trailing-edge-to-leading-edge method, 0.5–1 cm below the aortic cusps in a plane parallel to the aortic annulus (white arrow) from the zoomed parasternal long-axis view. The yellow dashed arrow represents the distal LVOT diameter measured just below the aortic annulus level.
Figure 2.

Two-dimensional measurements of left ventricle (LV) volumes using the biplane method of discs (modified Simpson's rule), in the apical four-chamber (A4C) and apical two-chamber (A2C) views at end-diastole (LV EDV) and at end-systole (LVESV). LV trabeculations and the papillary muscles should be excluded from the cavity in the tracing.
Figure 3.
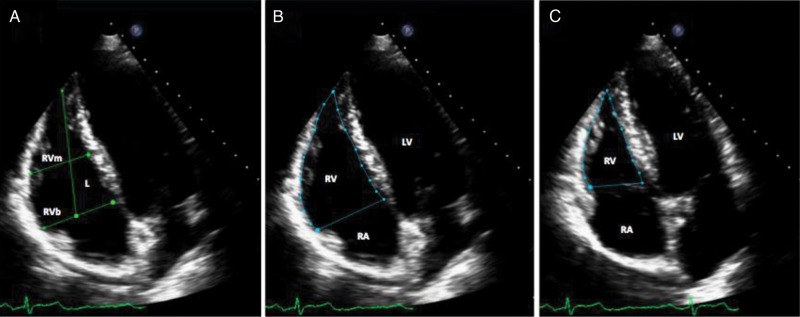
(A) Measurement of right ventricle (RV) linear dimensions from the apical four-chamber view showing the RV basal (RVb) and mid cavity (RVm) dimensions and the RV longitudinal dimension (L). Measurements were obtained at end-diastole. (B) Measurement of the right ventricle (RV) end-diastolic area in the apical four-chamber view. The endocardial border is traced in the apical four-chamber views from the tricuspid annulus along the RV free wall to the apex, then back to the tricuspid annulus, along the interventricular septum. Care should be taken to enclose trabeculation, tricuspid leaflets, and chords in this area. (C) Measurement of the right ventricle (RV) end-systolic area in the apical four-chamber view. The endocardial border is traced in apical four-chamber views from the tricuspid annulus along the RV free wall to the apex, then back to the tricuspid annulus, along the interventricular septum. Care should be taken to enclose trabeculation, tricuspid leaflets, and chords in this area.
Figure 4.

(A) Measurement of the left atrial diameter (LAD) from the parasternal long-axis view at end-systole. Measurement is done from trailing-edge-to-leading-edge from the posterior aortic wall to the posterior aspect of the left atrial wall in a plane parallel to the mitral annulus. (B and C) Measurement of left atrial volume using Simpson's biplane method from the apical four-chamber (A4C) and apical two-chamber (A2C) views at ventricular end-systole (maximum LA size). The LA length (L) is measured perpendicular from the mid-point of the segment that unifies the hinge points of the mitral leaflets, up to the ceiling of the LA. The LA minor dimension (D) is represented by the white line from the lateral wall to the interatrial septum. Care should be taken to exclude the pulmonary veins from the tracing the LA. (D) Measurement of the right atrial (RA) area end-systole from the parasternal four-chamber view. The right atrial major dimension (L) is represented by the yellow line from the tricuspid annulus plane centre to the superior RA wall, and the RA minor dimension (D) is represented by the white line from the anterolateral wall to the interatrial septum.
Statistical analysis
Normal distribution of data was checked using Kolmogorov–Smirnov test. Continuous variables were expressed as means ± SD and 2 SD range. Categorical variables were reported as percentages. For morphological measurements, the effect of the body surface area was accounted by normalizing the data to body size. Differences between groups were analysed for statistical significance with the unpaired t-test or the Chi-square test as appropriate. Comparison of continuous variables according to age groups was done with the one-way ANOVA test. Correlation between continuous variables was performed using the Pearson correlation test. Intra-observer and inter-observer variability was assessed in 30 randomly selected subjects. Intra-class correlation coefficient (ICC) with 95% confidence interval and the relative differences (means ± SD) were reported. P<0.05 was considered as statistically significant. All statistical analyses were carried out using SPSS version 17 (SPSS, Inc., Chicago, IL, USA).
Results
Demographic data
Table 1 summarizes the demographic data obtained in the entire population. A total of 320 men (mean age 46.3 ± 13.7 years) and 414 women were included (mean age 45.4 ± 13.1 years). There was no significant gender differences in cholesterol levels. Women had significantly smaller body surface areas, heights, weight, and lower blood pressure compared with men.
Table 1.
Characteristics of the population
| Parameters | Total (n = 734) | Male (n = 414) | Female (n = 320) | P-value |
|---|---|---|---|---|
| Age, years | 45.8 ± 13.3 | 46.3 ± 13.7 | 45.4 ± 13.1 | 0.387 |
| Height, cm | 169.8 ± 9.6 | 176.9 ± 7.8 | 164.4 ± 7.0 | < 0.001 |
| Weight, kg | 69.5 ± 12.0 | 77.6 ± 10.4 | 63.3 ± 9.1 | < 0.001 |
| Body mass index, kg/m2 | 24.0 ± 3.0 | 24.8 ± 2.6 | 23.4 ± 3.1 | <0.001 |
| Body surface area, m2 | 1.8 ± 0.2 | 1.94 ± 0.6 | 1.69 ± 0.1 | <0.001 |
| Systolic blood pressure, mmHg | 119.6 ± 12.7 | 123.5 ± 10.3 | 116.5 ± 13.5 | <0.001 |
| Diastolic blood pressure, mmHg | 74.1 ± 8.5 | 75.7 ± 8.0 | 72.9 ± 8.7 | <0.001 |
| Glycaemia, mg/dL | 92.5 ± 12.1 | 94.0 ± 10.7 | 89.0 ± 12.7 | <0.001 |
| Cholesterol level, mg/dL (n = 524) | 184.1 ± 30.9 | 186.5 ± 29.6 | 182.1 ± 31.7 | 0.102 |
Quality of the echo data
The echocardiographic examinations were performed using either a Vivid E9 (General Electric, Vingmed Ultrasound, Horten, Norway) in 378 subjects and with a Philips iE33 (Andover, MA, USA) in 356 cases. Overall, the quality of the echocardiographic recordings was excellent. LV data sets for the quantitation of LV end-diastolic volumes were deemed fair to poor, poor in 17 subjects, for end-systolic volumes in 22 subjects, and for LA volumes in 10 subjects. In the remaining patients, the differences in LV longitudinal axes between the four- vs. two-chamber views were <10%. The quality of RV data sets for cardiac chamber quantitation was poor for the RV end-diastolic area in 27 subjects, for the RV end-systolic area in 24, and for RA volume in 16 subjects.
Ventricular sizes
The LV and RV measurements are shown in Tables 2 and 3. LV mass, dimensions, and volumes were larger in men compared with women, even after normalization for the body surface area. LV ejection fraction was significantly higher in women. The lower reference values (mean −2 SD) for ejection fraction were 55.8% in men and 57.3% in women, for LV end-diastolic volume 34.8 and 34.2 mL/m2, for LV end-systolic volumes 11.7 and 10.5 mL/m2, and for LV end-systolic dimension 12.4 and 12.4 mm/m2, respectively. Upper reference values (mean ± 2 SD) for the LV mass were 104.1 g/m2 in men and 100.1 g/m2 in women, for ejection fraction were 71.3% in men and 72.6% in women, for LV end-diastolic volume 75.7 and 67.6 mL/m2, for LV end-systolic volume 28.8 and 25.9 mL/m2, and for LV end-systolic dimension 20.7 and 21.3 mm/m2, respectively.
Table 2.
Left ventricular chamber echocardiographic parameters
| Parameters | Total | Total | Male | Female | P-value |
|---|---|---|---|---|---|
| Mean ± SD | 2SD Range | Mean ± SD | Mean ± SD | ||
| Parasternal long-axis view | |||||
| Interventricular septal wall thickness, mm | 8.6 ± 1.6 | 6.0–11.3 | 9.2 ± 1.6 | 8.2 ± 1.5 | <0.001 |
| Posterior wall thickness, mm | 8.8 ± 1.5 | 6.5–11.4 | 9.3 ± 1.5 | 8.5 ± 1.5 | <0.001 |
| Diastolic LV internal dimension, mm | 44.3 ± 4.8 | 36.8–52.7 | 46.2 ± 4.8 | 43.0 ± 4.1 | <0.001 |
| Systolic LV internal dimension, mm | 29.9 ± 4.7 | 22.3–37.7 | 31.4 ± 4.6 | 28.8 ± 4.3 | <0.001 |
| LV mass, g | 126.8 ± 37.4 | 72.1–197.0 | 145.6 ± 36.7 | 112.1 ± 30.6 | <0.001 |
| Proximal LVOT diameter, mm | 20.3 ± 2.3 | 16.7–24.5 | 21.6 ± 2.3 | 19.3 ± 1.8 | <0.001 |
| Distal LVOT diameter, mm | 21.0 ± 2.2 | 17.7–25.0 | 22.3 ± 2.1 | 20.0 ± 1.7 | <0.001 |
| Apical views | |||||
| Apical four-chamber view | |||||
| LV ejection fraction, % | 63.8 ± 5.6 | 55.2–73.3 | 63.3 ± 5.6 | 64.1 ± 5.6 | 0.051 |
| LV end-diastolic volume, mL | 93.9 ± 27.0 | 58.5–146.3 | 107.1 ± 27.4 | 83.8 ± 21.8 | <0.001 |
| LV end-systolic volume, mL | 34.3 ± 11.8 | 18.9–56.6 | 39.7 ± 12.2 | 30.2 ± 9.6 | <0.001 |
| Apical two-chamber view | |||||
| LV ejection fraction, % | 64.4 ± 5.7 | 55.5–73.9 | 63.9 ± 5.5 | 64.8 ± 5.8 | 0.061 |
| LV end-diastolic volume, mL | 91.9 ± 26.8 | 54.0–142.3 | 102.6 ± 29.4 | 83.1 ± 20.1 | <0.001 |
| LV end-systolic volume, mL | 32.7 ± 11.0 | 17.6–52.3 | 37.0 ± 12.0 | 29.2 ± 8.6 | <0.001 |
| Biplane | |||||
| LV ejection fraction, % | 63.9 ± 4.9 | 56.5–71.7 | 63.3 ± 4.9 | 64.3 ± 4.9 | 0.009 |
| LV end-diastolic volume, mL | 92.8 ± 24.8 | 59.3–140.6 | 104.6 ± 25.9 | 83.3 ± 18.7 | <0.001 |
| LV end-systolic volume, mL | 33.7 ± 10.9 | 19.0–53.9 | 38.5 ± 11.6 | 29.9 ± 8.4 | <0.001 |
| Normalized to BSA | |||||
| Parasternal long-axis view | |||||
| Systolic LV internal dimension, mm/m2 | 16.7 ± 2.6 | 12.4 ± 21.1 | 16.2 ± 2.5 | 17.1 ± 2.6 | <0.001 |
| LV mass, g/m2 | 69.9 ± 17.5 | 43.6–102.6 | 74.8 ± 17.5 | 66.1 ± 16.4 | <0.001 |
| Apical views | |||||
| Apical four-chamber view | |||||
| LV end-diastolic volume, mL/m2 | 51.8 ± 12.5 | 34.0–75.0 | 55.1 ± 12.8 | 49.4 ± 11.7 | <0.001 |
| LV end-systolic volume, mL/m2 | 18.9 ± 5.7 | 10.9–29.4 | 20.4 ± 5.8 | 17.8 ± 5.3 | <0.001 |
| Apical two-chamber view | |||||
| LV end-diastolic volume, mL/m2 | 50.9 ± 12.9 | 31.3–73.9 | 52.8 ± 14.0 | 49.3 ± 11.8 | 0.001 |
| LV end-systolic volume, mL/m2 | 18.1 ± 5.3 | 9.9–27.8 | 19.0 ± 5.7 | 17.3 ± 4.9 | <0.001 |
| Biplane | |||||
| LV end-diastolic volume, mL/m2 | 51.4 ± 11.4 | 34.2–70.7 | 54.1 ± 12.2 | 49.3 ± 10.4 | <0.001 |
| LV end-systolic volume, mL/m2 | 18.6 ± 5.2 | 10.8–27.4 | 19.9 ± 5.5 | 17.7 ± 4.7 | <0.001 |
LV, left ventricular; LVOT, left ventricular outflow tract.
Table 3.
Right ventricular chamber echocardiographic parameters
| Parameters | Total | Total | Male | Female | P-value |
|---|---|---|---|---|---|
| Mean ± SD | 2SD Range | Mean ± SD | Mean ± SD | ||
| Parasternal long-axis view | |||||
| RV outflow tract, mm | 31.9 ± 4.7 | 24.5–39.7 | 33.7 ± 4.4 | 30.6 ± 4.5 | <0.001 |
| Parasternal short-axis view | |||||
| Proximal RV outflow tract, mm | 31.9 ± 5.5 | 23.0–41.3 | 33.5 ± 5.0 | 30.7 ± 5.5 | <0.001 |
| Distal RV outflow tract, mm | 21.7 ± 3.4 | 16.2–27.5 | 22.6 ± 3.2 | 21.0 ± 3.4 | <0.001 |
| Apical views | |||||
| RV basal-diameter, mm | 34.4 ± 5.7 | 25.0–43.7 | 36.8 ± 5.3 | 32.5 ± 5.3 | <0.001 |
| RV mid-diameter, mm | 28.0 ± 5.5 | 19.7–37.5 | 30.4 ± 5.6 | 26.0 ± 4.5 | <0.001 |
| RV longitudinal diameter, mm | 67.8 ± 8.0 | 54.5–81.4 | 70.7 ± 7.9 | 65.5 ± 7.4 | <0.001 |
| RV end-diastolic area, cm2 | 17.1 ± 4.2 | 10.5–24.1 | 18.2 ± 4.3 | 14.8 ± 3.5 | <0.001 |
| RV end-systolic area, cm2 | 8.6 ± 2.8 | 4.5–13.4 | 9.6 ± 2.8 | 7.3 ± 2.3 | <0.001 |
| FAC, % | 49.7 ± 8.4 | 35.5–64.0 | 47.5 ± 8.6 | 50.9 ± 8.0 | <0.001 |
| Normalized to BSA | |||||
| Apical views | |||||
| RV end-diastolic area | 9.5 ± 2.0 | 6.1–12.7 | 9.4 ± 2.1 | 8.8 ± 1.9 | <0.001 |
| RV end-systolic area | 4.8 ± 1.4 | 2.6–7.0 | 4.9 ± 1.4 | 4.3 ± 1.3 | <0.001 |
RV, right ventricular.
RV dimensions were larger in men compared with women, even after normalization for the body surface area. RV FAC was higher in men. Lower reference values (mean − 2 SD) for RV FAC were 33.0% in men and 38.7% in women. Upper reference values (mean ± 2 SD) for RV FAC were 62.3% in men and 64.9% in women.
LVOT and RVOT diameters were smaller in women (Tables 2 and 3).
Atrial sizes
The LA and RA measurements are shown in Tables 4 and 5. LA dimensions and volumes were larger in men than in women. After normalization for the body surface area, LA volumes were no longer different between groups. Upper reference values (means ± 2 SD) for LA volumes were 41.9 mL/m2 in men and 41.5 mL/m2 in women using the area-length method, and 37.2 mL/m2 in men and 36.9 mL/m2 in women with the Simpson method.
Table 4.
Left atrial chamber echocardiographic parameters
| Parameters | Total | Total | Male | Female | P-value |
|---|---|---|---|---|---|
| Mean ± SD | 2 SD range | Mean ± SD | Mean ± SD | ||
| Parasternal long-axis view | |||||
| LA diameter, mm | 33.6 ± 4.3 | 26.7–41.0 | 35.1 ± 4.1 | 32.4 ± 4.1 | <0.001 |
| Apical views | |||||
| Apical four-chamber view | |||||
| LA minor length, mm | 39.2 ± 4.7 | 31.0–47.5 | 40.1 ± 4.5 | 38.5 ± 4.8 | 0.001 |
| LA major length, mm | 47.6 ± 5.5 | 38.5–57.0 | 48.8 ± 5.4 | 46.6 ± 5.4 | <0.001 |
| LA area, cm2 | 16.5 ± 3.2 | 11.5–21.9 | 17.2 ± 3.1 | 15.8 ± 3.1 | <0.001 |
| LA volume area-length, mL | 49.2 ± 15.0 | 26.5–78.2 | 52.7 ± 14.3 | 46.5 ± 15.0 | <0.001 |
| LA volume Simpson, mL | 45.0 ± 13.5 | 25.2–70.0 | 47.8 ± 13.0 | 42.7 ± 13.5 | <0.001 |
| Apical two-chamber view | |||||
| LA minor length, mm | 40.2 ± 5.0 | 32.5–49.0 | 41.8 ± 5.2 | 39.0 ± 4.6 | <0.001 |
| LA major length, mm | 49.4 ± 4.5 | 42.0–57.0 | 50.7 ± 4.5 | 48.3 ± 4.3 | <0.001 |
| LA area, cm2 | 17.1 ± 3.2 | 12.7–23.1 | 18.2 ± 3.4 | 16.2 ± 2.7 | <0.001 |
| LA volume area-length, mL | 51.5 ± 16.3 | 30.2–80.9 | 56.8 ± 18.0 | 47.5 ± 13.6 | <0.001 |
| LA volume Simpson, mL | 48.2 ± 15.2 | 27.6–75.0 | 53.2 ± 16.6 | 44.3 ± 12.7 | <0.001 |
| Biplane | |||||
| LA volume area-length, mL | 51.8 ± 14.3 | 33.3–78.7 | 56.7 ± 14.9 | 48.1 ± 12.7 | <0.001 |
| LA volume Simpson, mL | 46.6 ± 12.8 | 29.5–70.3 | 50.6 ± 13.3 | 43.5 ± 11.6 | <0.001 |
| Normalized to BSA | |||||
| Parasternal long-axis view | |||||
| LA diameter, mm/m2 | 18.7 ± 2.4 | 15.0–22.8 | 18.1 ± 2.3 | 19.2 ± 2.4 | <0.001 |
| Apical views | |||||
| Apical four-chamber view | |||||
| LA area, cm2/m2 | 9.1 ± 1.6 | 6.5–11.8 | 8.9 ± 1.5 | 9.3 ± 1.7 | 0.008 |
| LA volume area-length, mL/m2 | 27.1 ± 7.5 | 14.9–40.3 | 27.0 ± 7.0 | 27.3 ± 7.9 | 0.733 |
| LA volume Simpson, mL/m2 | 24.8 ± 6.8 | 13.7–36.9 | 24.5 ± 6.4 | 25.1 ± 7.2 | 0.462 |
| Apical two-chamber view | |||||
| LA area, cm2/m2 | 9.5 ± 1.5 | 7.1–12.1 | 9.3 ± 1.6 | 9.6 ± 1.4 | 0.126 |
| LA volume area-length, mL/m2 | 28.3 ± 7.8 | 17.5–43.1 | 28.9 ± 8.5 | 28.0 ± 7.3 | 0.263 |
| LA volume Simpson, mL/m2 | 26.6 ± 7.2 | 16.1–40.1 | 27.1 ± 7.9 | 26.1 ± 6.7 | 0.189 |
| Biplane | |||||
| LA volume area-length, mL/m2 | 28.6 ± 6.7 | 19.3–41.5 | 28.9 ± 7.0 | 28.3 ± 6.5 | 0.376 |
| LA volume Simpson, mL/m2 | 25.7 ± 6.1 | 16.7–36.9 | 25.9 ± 6.3 | 25.6 ± 6.0 | 0.704 |
LA, left atrial.
Table 5.
Right atrial chamber echocardiographic parameters
| Parameters | Total | Total | Male | Female | P-value |
|---|---|---|---|---|---|
| Mean ± SD | 2 SD range | Mean ± SD | Mean ± SD | ||
| Apical four-chamber view | |||||
| RA minor axis, mm | 36.1 ± 5.6 | 27.5–46.0 | 38.4 ± 5.4 | 34.2 ± 5.1 | <0.001 |
| RA major axis, mm | 45.9 ± 5.4 | 38.0–54.5 | 48.1 ± 4.7 | 44.1 ± 5.3 | <0.001 |
| RA area, cm2 | 14.5 ± 3.2 | 9.6–20.4 | 16.1 ± 2.9 | 13.2 ± 2.9 | <0.001 |
| RA volume area-length, mL | 40.1 ± 14.7 | 20.0–68.6 | 46.9 ± 14.5 | 34.4 ± 12.4 | <0.001 |
| RA volume Simpson, mL | 37.5 ± 13.5 | 19.1–63.4 | 43.8 ± 13.4 | 32.5 ± 11.4 | <0.001 |
| Normalized to BSA | |||||
| Apical four-chamber view | |||||
| RA minor axis, mm/m2 | 20.0 ± 2.9 | 15.3–24.5 | 19.8 ± 2.8 | 20.2 ± 3.0 | 0.228 |
| RA major axis, mm/m2 | 25.5 ± 3.0 | 21.3–29.8 | 24.8 ± 2.5 | 26.1 ± 3.2 | <0.001 |
| RA area, cm2/m2 | 8.0 ± 1.5 | 5.6–10.4 | 8.3 ± 1.4 | 7.8 ± 1.6 | 0.003 |
| RA volume area-length, mL/m2 | 21.9 ± 7.1 | 12.3–35.2 | 24.1 ± 7.0 | 20.2 ± 6.7 | <0.001 |
| RA volume Simpson, mL/m2 | 20.6 ± 6.5 | 11.5–32.9 | 22.5 ± 6.5 | 19.0 ± 6.2 | <0.001 |
RA, right atrial.
RA dimensions and volumes were larger in men compared with women, with differences mitigated after normalization for the body surface area. Upper reference values (means ± 2 SD) for the RA volume method were 36.7 mL/m2 in men and 30.6 mL/m2 in women using the area-length method, and 33.8 mL/m2 in men and 29.3 mL/m2 in women with the Simpson method.
Age and cardiac size relationship
Table 6 summarizes the relationship of chamber quantification parameters with age and genders. LV volumes and RV areas decreased with ageing in both genders, even after body surface area normalization. LV ejection fraction increased significantly with age in both genders. A significant correlation between age and LV mass or indexed LV mass was found in women but not in men. LA and RA volumes did not change significantly with age in both genders.
Table 6.
Echocardiographic parameters according gender and age
| Parameters | Age 20–40 (n = 262) |
Age 40–60 (n = 341) |
Age ≥ 60 (n = 131) |
P-value* |
Male** |
Female** |
||||||
|---|---|---|---|---|---|---|---|---|---|---|---|---|
| Male (mean ± SD) | Female (mean ± SD) | Male (mean ± SD) | Female (mean ± SD) | Male (mean ± SD) | Female (mean ± SD) | Male | Female | r | P-value | r | P-value | |
| LV end-diastolic volume, mL | 110.5 ± 26.5 | 86.9 ± 20.4 | 104.2 ± 25.1 | 83.8 ± 17.4 | 94.8 ± 24.7 | 72.0 ± 13.2 | 0.002 | <0.001 | −0.258 | <0.001 | −0.264 | <0.001 |
| LV end-systolic volume, mL | 41.0 ± 11.5 | 31.9 ± 9.1 | 38.8 ± 11.2 | 29.7 ± 8.0 | 33.3 ± 11.6 | 25.1 ± 5.6 | 0.001 | <0.001 | −0.291 | <0.001 | −0.277 | <0.001 |
| LV ejection fraction, % | 62.9 ± 4.7 | 63.5 ± 4.8 | 62.8 ± 4.8 | 64.7 ± 4.8 | 65.0 ± 5.3 | 65.1 ± 5.0 | 0.022 | 0.046 | 0.187 | 0.002 | 0.127 | 0.018 |
| LV mass, g | 142.9 ± 39.1 | 103.9 ± 28.3 | 148.2 ± 34.3 | 116.0 ± 29.3 | 144.5 ± 38.3 | 119.2 ± 35.4 | 0.516 | <0.001 | 0.021 | 0.708 | 0.205 | <0.001 |
| RV end-diastolic area, cm2 | 19.3 ± 4.6 | 15.1 ± 3.5 | 18.1 ± 3.9 | 14.9 ± 3.6 | 16.3 ± 3.8 | 13.8 ± 3.2 | <0.001 | 0.046 | −0.228 | <0.001 | −0.123 | 0.015 |
| RV end-systolic area, cm2 | 10.1 ± 3.0 | 7.7 ± 2.4 | 9.7 ± 2.6 | 7.3 ± 2.3 | 8.5 ± 2.6 | 6.6 ± 2.2 | 0.002 | 0.014 | −0.165 | 0.004 | −0.140 | 0.005 |
| LA volume area-length, mL | 55.5 ± 15.1 | 48.0 ± 13.2 | 58.8 ± 16.0 | 48.5 ± 12.9 | 54.0 ± 11.4 | 46.6 ± 10.9 | 0.303 | 0.784 | −0.007 | 0.932 | −0.320 | 0.665 |
| LA volume Simpson, mL | 49.6 ± 13.3 | 43.1 ± 11.5 | 52.5 ± 14.4 | 44.2 ± 12.0 | 48.2 ± 10.2 | 42.4 ± 10.6 | 0.300 | 0.707 | 0.001 | 0.995 | −0.00 | 0.971 |
| RA volume area-length, mL | 47.9 ± 12.8 | 33.6 ± 11.8 | 47.4 ± 17.0 | 36.0 ± 13.0 | 43.6 ± 11.0 | 31.3 ± 11.1 | 0.440 | 0.180 | −0.135 | 0.108 | −0.008 | 0.914 |
| RA volume Simpson, mL | 44.1 ± 12.2 | 31.4 ± 10.8 | 44.5 ± 15.6 | 34.0 ± 11.9 | 41.1 ± 10.0 | 29.9 ± 10.2 | 0.538 | 0.156 | −0.098 | 0.232 | 0.007 | 0.921 |
| Normalized to BSA | ||||||||||||
| LV end-diastolic volume, mL/m2 | 56.5 ± 12.0 | 51.6 ± 11.0 | 53.4 ± 11.8 | 49.4 ± 10.0 | 51.1 ± 12.8 | 43.0 ± 7.3 | 0.028 | <0.002 | −0.215 | <0.001 | −0.288 | <0.001 |
| LV end-systolic volume, mL/m2 | 20.9 ± 5.2 | 18.9 ± 4.9 | 19.9 ± 5.3 | 17.5 ± 4.5 | 17.9 ± 6.0 | 15.0 ± 3.4 | 0.007 | <0.001 | −0.262 | <0.001 | −0.296 | <0.001 |
| LV mass, g/m2 | 72.4 ± 18.0 | 61.5 ± 14.5 | 75.6 ± 16.1 | 68.2 ± 15.9 | 77.5 ± 20.0 | 70.6 ± 19.8 | 0.153 | <0.001 | 0.105 | 0.065 | 0.219 | <0.001 |
| RV end-diastolic area, cm2/m2 | 9.8 ± 2.2 | 9.0 ± 1.9 | 9.3 ± 2.0 | 8.8 ± 2.0 | 8.8 ± 2.1 | 8.2 ± 1.7 | 0.006 | 0.027 | −0.162 | 0.004 | −0.149 | 0.003 |
| RV end-systolic area, cm2/m2 | 5.1 ± 1.4 | 4.6 ± 1.3 | 5.0 ± 1.3 | 4.3 ± 1.3 | 4.5 ± 1.4 | 3.9 ± 1.2 | 0.039 | 0.005 | −0.109 | 0.056 | −0.163 | 0.001 |
| LA volume area-length, mL/m2 | 28.1 ± 6.8 | 28.6 ± 6.5 | 29.7 ± 7.5 | 28.3 ± 6.9 | 29.0 ± 6.2 | 27.4 ± 5.4 | 0.449 | 0.701 | 0.054 | 0.523 | −0.70 | 0.343 |
| LA volume Simpson, mL/m2 | 25.1 ± 6.0 | 25.7 ± 5.6 | 26.6 ± 6.8 | 25.8 ± 6.4 | 25.9 ± 5.5 | 24.9 ± 5.2 | 0.448 | 0.777 | 0.063 | 0.457 | −0.038 | 0.601 |
| RA volume area-length, mL/m2 | 24.3 ± 6.3 | 20.0 ± 6.7 | 24.0 ± 8.1 | 20.8 ± 6.9 | 23.6 ± 5.9 | 18.4 ± 6.0 | 0.908 | 0.272 | −0.081 | 0.334 | −0.036 | 0.635 |
| RA volume Simpson, mL/m2 | 22.5 ± 5.9 | 18.8 ± 6.1 | 22.6 ± 7.4 | 19.7 ± 6.4 | 22.2 ± 5.4 | 17.5 ± 5.5 | 0.973 | 0.266 | −0.048 | 0.555 | −0.027 | 0.716 |
LV, left ventricular; RV, right ventricular; LA, left atrial; RA, right atrial.
P* differences between groups according to age category (one-way ANOVA).
P and r** correlation with age for both genders (Pearson correlation test).
Reproducibility
Intra-observer and inter-observer reproducibility for cardiac chamber size measurements are summarized in Table 7. Intra-observer and inter-observer analysis showed good-to-excellent reproducibility (inter-class ICC varying from 0.78 to 0.99).
Table 7.
Reproducibility of echocardiographic measurements
| Variables | Intra-observer |
Inter-observer |
||||
|---|---|---|---|---|---|---|
| Relative difference (%) | ICC | 95% of confidence intervals | Relative difference (%) | ICC | 95% of confidence intervals | |
| LV end-diastolic volume | 5 ± 7 | 0.95 | 0.89–0.98 | 4 ± 2 | 0.99 | 0.95–0.99 |
| LV end-systolic volume | 1 ± 10 | 0.93 | 0.86–0.97 | 8 ± 6 | 0.95 | 0.83–0.99 |
| LV ejection fraction | 3 ± 7 | 0.83 | 0.62–0.92 | 2 ± 1 | 0.92 | 0.70–0.98 |
| LV mass | 4 ± 11 | 0.95 | 0.89–0.97 | 7 ± 2 | 0.95 | 0.84–0.99 |
| RV end-diastolic area | 1 ± 9 | 0.94 | 0.89–0.97 | 17 ± 8 | 0.78 | 0.33–0.94 |
| RV end-systolic area | 5 ± 17 | 0.84 | 0.69–0.92 | 22.5 ± 13 | 0.81 | 0.42–0.95 |
| LA volume | 2 ± 7 | 0.95 | 0.87–0.98 | 5 ± 4 | 0.89 | 0.64–0.87 |
| RA volume | 7 ± 13 | 0.89 | 0.75–0.96 | 7 ± 6 | 0.94 | 0.80–0.99 |
ICC, inter-class correlation coefficient; LV, left ventricular; RV, right ventricular; LA, left atrial; RA, right atrial.
Discussion
The present study provides a comprehensive analysis of cardiac chamber quantification in a large cohort of healthy volunteers over a wide range of ages using state-of-the-art echocardiographic equipment enrolled in the NORRE study. Both genders were well represented with a slight predominance of females. Overall, upper and lower reference limits were higher in men compared with women with age-related changes, highlighting the importance of applying age-gender-specific reference values for reliable identification of cardiac chambers enlargement and dysfunction. Gender differences were maintained for most parameters after normalization for the body surface area and age. Quality of echo data sets was good to excellent in most patients, indicating the high-quality standards of EACVI accredited laboratories and consequently the high clinical relevance of the NORRE study results.
Left ventricular size
LV dimensions, volumes, and ejection fraction are powerful predictors of morbidity and mortality in both clinical and population studies. However, these parameters are frequently limited by a number of circumstances, the most common being inadequate image quality and foreshortened LV apical views. In the present study, to circumvent these sources of errors only non-foreshortened high-quality LV apical views were analysed.7 The reference values reported for most LV size parameters were gender specific and the simple normalization of LV volumes to the body surface area did not eliminate gender differences. LV volumes were smaller, and as a result LV ejection fraction was higher in women. With age, LV volumes decreased and LV ejection increased in both genders. Of note, a significant increase in the LV mass with age was only observed in women. These findings are in general consistent with previous studies.8,9 However, as expected, independent of gender, the reported LV dimensions in the present study were lower than those obtained from three-dimensional (3D) echocardiographic studies (i.e. for indexed LV end-systolic volume −3.7 mL/m2 in men and −1.9 mL/m2 in women in the study by Muraru et al.9) The LV dimensions reported in the present study remained, however, larger than in the study of Chahal et al.10 Interestingly, when using data not indexed for body size, data, our reference values for LV dimensions (i.e. for LV end-systolic volume −5.5 mL in men and −4.4 mL in women) and LV mass were higher than those reported in the JAMP study (normal values of echocardiographic parameters in relation to age in a healthy Japanese population), highlighting the importance of developing ethnicity-specific reference values for LV parameters.11 Finally, lower and upper cut-off values for normal LV diameters reported in the NORRE study were significantly higher in men, suggesting that in patients with valvular heart disease indexing for the body surface alone might be insufficient to identify LV impairment. Moreover, measurements of LVOT diameter 0.5–1 cm below the aortic annulus result in smaller values compared with those measured at the insertion of the aortic cusps, suggesting that although the former approach is recommended,12 it might lead to an underestimation of the LVOT cross-sectional area.13
Right ventricular size
The quantitation of RV size and function with conventional echocardiography is of importance but still not uniformly adopted in routine clinical practice.14 Consistent with previous studies, RV size parameters were lower in women, even after normalization for the body surface area.15,16 As a result, FAC was higher in women. Of note, RV areas decreased with age even after normalization for the body surface area. These data indicate that age, gender, and body size are important determinants of 2D echocardiographic RV dimensions reinforcing the need for age- and gender-specific RV reference values indexed to body surface area for the routine clinical assessment of the RV. Of note, non-indexed RV parameters were higher in our study compared with the JAMP Study11 and slightly lower to those reported by Maffessanti et al.16
Left atrial size
LA volume is a validated marker of clinical and subclinical cardiovascular disease.17 LA diameters and volumes often refer to indexed values for body size, but little is known about the potential influence of gender.18,19 Our results showed significantly different LA size and volumes between men and women, but these differences did no longer persist after indexing for body size regardless of the method used to calculate them. Only, the indexed LA diameter (parasternal long-axis) and single-plane area (apical 4-chamber) remained different and paradoxically higher in women, suggesting that the complexity of LA shape is underappreciated by these approaches. Our data suggest that for LA volumes there is less need for checking for age-gender-specific references. Indeed, LA volume did not correlate with age. Importantly, the upper LA volume reference limits for defining an enlarged LA were larger than the currently recommended cut-off values, which were derived from population studies.20 Of note, and as shown previously, the area-length method yielded systematically larger values compared with the Simpson method (P<0.001), suggesting that these methods are not fully interchangeable.21
RA size
There is increasing evidence that RA enlargement is an outcome predictor in various cardiac conditions.22,23 To date, diameters and area measured in the apical four-chamber view are the only recommended methods to assess RA size, while RA volume computation is not included in routine clinical echocardiography due to the lack of reference data.24 Consistent with previous data, our results showed significantly different RA volumes between men and women even after indexing for body surface area, suggesting the need for gender-specific reference values.19,24 Of note, RA volume did not correlate with age. Thus, indexation of RA volume for age is not mandatory. As for LA, RA volumes were lower than 3D derived values.19,24 However, our upper references limits for RA diameters for defining an enlarged RA were close to current recommended cut-off values.14 Of note, as for LA, the single-plane area-length method provided larger values than the biplane discs' summation method (P < 0.001).
Limitations
The NORRE study results mainly pertain to white individuals. Thus, conclusions concerning other ethnic populations could not be drawn. Despite the fact that all subjects were considered normal subjects, the possibility of subclinical coronary artery disease particularly in older subjects cannot be excluded. Of note, the higher intra- and inter-observer variability for the assessment of RV parameters might affect the interpretation of our data.
Conclusion
The NORRE study provides applicable 2D echocardiographic reference ranges for cardiac chamber quantification. Our data highlight that normalization for body size should be performed along with age-gender-specific assessment for most echocardiographic parameters. This study is unique, because it provides chamber quantitation parameters data over a wide range of ages for all parameters measured in the same patient population. The data have been acquired using state of the art equipment following recommended protocols for chamber quantitation approved by the EACVI.
Funding
The ECHO Normal Study is supported by GE Healthcare and Philips Healthcare in the form of an unrestricted educational grant. Sponsor funding has in no way influenced the content or management of this Study.
Conflict of interest: none declared.
Acknowledgement
The EACVI research committee thanks the Heart House for its support.
Appendix of the list of co-investigators
Nieves Montoro, La Paz Hospital in Madrid, Spain
Covadonga Fernandez golfin, University Hospital Ramón y Cajal, Madrid, Spain
Maria Adelaide Almeida, Hospital da Luz, Lisbon, Portugal
Monica Rosca and Andreea Calin, ‘Carol Davila’ University of Medicine and Pharmacy—Euroecolab, Institute of Cardiovascular Diseases, Bucharest, Romania
Natalia Gonjilashvili, Levan Kurashvili, Natela Akhaladze, and Zaza Mgaloblishvili, Echocardiography Laboratory of Adult Cardiology Department of the JOANN Medical Center, Tbilisi, Georgia
Maria Jose Oliva, Murcia, Spain
Eftychia Demerouti, ‘Noninvasive Diagnostics Department - Onassis Cardiac Surgery Center, Athens, Greece’
Roxana RIMBAS, and Andrea Olivia CIOBANU, Cardiovascular Research Unit, University and Emergency Hospital, University of Medicine and Pharmacy Carol Davila, Bucharest, Romania
Diletta Peluso, Seena Padayattil Jose, Department of Cardiac, Thoracic and Vascular Sciences University of Padova, School of Medicine, Padova, Italy
Johan De Sutter, Echocardiography Unit—AZ Maria Middelares Gent, Belgium
Martin Kotrc, Cardiovascular Center Aalst, OLV-Clinic, Belgium
Elisa Cerone Laboratorio di Ecocardiografia Adulti Fondazione Toscana “G.Monasterio”- Ospedale del Cuore, Massa Italy
Lynn Weinert, University of Chicago, Chicago, United States
References
- 1.Vasan RS, Levy D, Larson MG, Benjamin EJ. Interpretation of echocardiographic measurements: a call for standardization. Am Heart J. 2000;139:412–22. doi: 10.1016/s0002-8703(00)90084-x. [DOI] [PubMed] [Google Scholar]
- 2.Lancellotti P. Normal reference ranges for echocardiography: do we really need more? Eur Heart J Cardiovasc Imaging. 2013 doi: 10.1093/ehjci/jet265. in press. [DOI] [PubMed] [Google Scholar]
- 3.Poppe KK, Doughty RN, Whalley GA. Redefining normal reference ranges for echocardiography: a major new individual person data meta-analysis. Eur Heart J Cardiovasc Imaging. 2013;14:347–8. doi: 10.1093/ehjci/jes161. [DOI] [PubMed] [Google Scholar]
- 4.Poppe K. The echocardiographic normal ranges meta-analysis of the left heart (EchoNoRMAL) collaboration. A meta-analysis of echocardiographic measurements of the left heart for the development of normative reference ranges in a la large international cohort: the EchoNoRMAL study. Eur Heart J Cardiovasc Imaging. 2013 doi: 10.1093/ehjci/jet240. in press) [DOI] [PubMed] [Google Scholar]
- 5.Lancellotti P, Badano LP, Lang RM, Akhaladze N, Athanassopoulos G, Barone D, et al. Normal reference ranges for echocardiography:Rationale, study design, and methodology (NORRE study) Eur Heart J Cardiovasc Imaging. 2013;14:303–8. doi: 10.1093/ehjci/jet008. [DOI] [PubMed] [Google Scholar]
- 6.Cosyns B, Garbi M, Speparovic J, Pasquet A, Lancellotti P. Update of the echocardiography core syllabus of the European Association of Cardiovascular Imaging (EACVI) Eur Heart J Cardiovasc Imaging. 2013;14:837–9. doi: 10.1093/ehjci/jet140. [DOI] [PubMed] [Google Scholar]
- 7.Dorosz JL, Lezotte DC, Weitzenkamp DA, Allen LA, Salcedo EE. Performance of 3-dimensional echocardiography in measuring left ventricular volumes and ejection fraction: a systematic review and meta-analysis. J Am Coll Cardiol. 2012;59:1799–808. doi: 10.1016/j.jacc.2012.01.037. [DOI] [PMC free article] [PubMed] [Google Scholar]
- 8.Pfaffenberger S, Bartko P, Graf A, Pernicka E, Babayev J, Lolic E, et al. Size matters! Impact of age, sex,height, and weight on the normal heart size. Circ Cardiovasc Imaging. 2013;6:1073–9. doi: 10.1161/CIRCIMAGING.113.000690. [DOI] [PubMed] [Google Scholar]
- 9.Muraru D, Badano LP, Peluso D, Dal Bianco L, Casablanca S, Kocabay G, et al. Comprehensive analysis of left ventricular geometry and function by three-dimensional echocardiography in healthy adults. J Am Soc Echocardiogr. 2013;26:618–28. doi: 10.1016/j.echo.2013.03.014. [DOI] [PubMed] [Google Scholar]
- 10.Chahal NS, Lim TK, Jain P, Chambers JC, Kooner JS, Senior R. Population-based reference values for 3D echocardiographic LV volumes and ejection fraction. JACC Cardiovasc Imaging. 2012;5:1191–7. doi: 10.1016/j.jcmg.2012.07.014. [DOI] [PubMed] [Google Scholar]
- 11.Daimon M, Watanabe H, Abe Y, Hirata K, Hozumi T, Ishii K, et al. JAMP Study Investigators. Normal values of echocardiographic parameters in relation to age in a healthy Japanese population: the JAMP study. Circ J. 2008;72:1859–66. doi: 10.1253/circj.cj-08-0171. [DOI] [PubMed] [Google Scholar]
- 12.Baumgartner H, Hung J, Bermejo J, Chambers JB, Evangelista A, Griffin BP, et al. Echocardiographic assessment of valve stenosis: EAE/ASE recommendations for clinical practice. Eur J Echocardiogr. 2009;10:1–25. doi: 10.1093/ejechocard/jen303. [DOI] [PubMed] [Google Scholar]
- 13.Poh KK, Levine RA, Solis J, Shen L, Flaherty M, Kang YJ, et al. Assessing aortic valve area in aortic stenosis by continuity equation: a novel approach using real-time three-dimensional echocardiography. Eur Heart J. 2008;29:2526–35. doi: 10.1093/eurheartj/ehn022. [DOI] [PMC free article] [PubMed] [Google Scholar]
- 14.Rudski LG, Lai WW, Afilalo J, Hua L, Handschumacher MD, Chandrasekaran K, et al. Guidelines for the echocardiographic assessment of the right heart in adults: a report from the American Society of Echocardiography endorsed by the European Association of Echocardiography, a registered branch of the European Society of Cardiology, and the Canadian Society of Echocardiography. J Am Soc Echocardiogr. 2010;23:685–713. doi: 10.1016/j.echo.2010.05.010. [DOI] [PubMed] [Google Scholar]
- 15.Kawut SM, Lima JAC, Barr RG, Chahal H, Jain A, Tandri H, et al. Sex and race differences in right ventricular structure and function. Circulation. 2011;123:2542–51. doi: 10.1161/CIRCULATIONAHA.110.985515. [DOI] [PMC free article] [PubMed] [Google Scholar]
- 16.Maffessanti F, Muraru D, Esposito R, Gripari P, Ermacora D, Santoro C, et al. Age-, body size-, and sex-specific reference values for right ventricular volumes and ejection fraction by three-dimensional echocardiography: a multicenter echocardiographic study in 507 healthy volunteers. Circ Cardiovasc Imaging. 2013;6:700–10. doi: 10.1161/CIRCIMAGING.113.000706. [DOI] [PubMed] [Google Scholar]
- 17.Aurigemma GP, Gottdiener JS, Arnold AM, Chinali M, Hill JC, Kitzman D. Left atrial volume and geometry in healthy aging: the Cardiovascular Health Study. Circ Cardiovasc Imaging. 2009;2:282–9. doi: 10.1161/CIRCIMAGING.108.826602. [DOI] [PMC free article] [PubMed] [Google Scholar]
- 18.D'Andrea A, Riegler L, Rucco MA, Cocchia R, Scarafile R, Salerno G, et al. Left atrial volume index in healthy subjects: clinical and echocardiographic correlates. Echocardiography. 2013;30:1001–7. doi: 10.1111/echo.12217. [DOI] [PubMed] [Google Scholar]
- 19.Aune E, Baekkevar M, Roislien J, Rodevand O, Otterstad JE. Normal reference ranges for left and right atrial volume indexes and ejection fractions obtained with real-time three-dimensional echocardiography. Eur J Echocardiogr. 2009;10:738–44. doi: 10.1093/ejechocard/jep054. [DOI] [PubMed] [Google Scholar]
- 20.Lang RM, Bierig M, Devereux RB, Flachskampf FA, Foster E, Pellikka PA, et al. American Society of Echocardiography's Nomenclature and Standards Committee; Task Force on Chamber Quantification; American College of Cardiology Echocardiography Committee; American Heart Association; European Association of Echocardiography, European Society of Cardiology. Recommendations for chamber quantification. Eur J Echocardiogr. 2006;7:79–108. doi: 10.1016/j.euje.2005.12.014. [DOI] [PubMed] [Google Scholar]
- 21.Messika-Zeitoun D, Bellamy M, Avierinos JF, Breen J, Eusemann C, Rossi A, et al. Left atrial remodelling in mitral regurgitation—methodologic approach, physiological determinants, and outcome implications: a prospective quantitative Doppler-echocardiographic and electron beam-computed tomographic study. Eur Heart J. 2007;28:1773–81. doi: 10.1093/eurheartj/ehm199. [DOI] [PubMed] [Google Scholar]
- 22.Sallach JA, Tang WH, Borowski AG, Tong W, Porter T, Martin MG, et al. Right atrial volume index in chronic systolic heart failure and prognosis. JACC Cardiovasc Imaging. 2009;2:527–34. doi: 10.1016/j.jcmg.2009.01.012. [DOI] [PubMed] [Google Scholar]
- 23.Cioffi G, de Simone G, Mureddu G, Tarantini L, Stefenelli C. Right atrial size and function in patients with pulmonary hypertension associated with disorders of respiratory system or hypoxemia. Eur J Echocardiogr. 2007;8:322–31. doi: 10.1016/j.euje.2006.06.006. [DOI] [PubMed] [Google Scholar]
- 24.Peluso D, Badano LP, Muraru D, Dal Bianco L, Cucchini U, Kocabay G, et al. Right atrial size and function assessed with three-dimensional and speckle-tracking echocardiography in 200 healthy volunteers. Eur Heart J Cardiovasc Imaging. 2013;14:1106–14. doi: 10.1093/ehjci/jet024. [DOI] [PubMed] [Google Scholar]