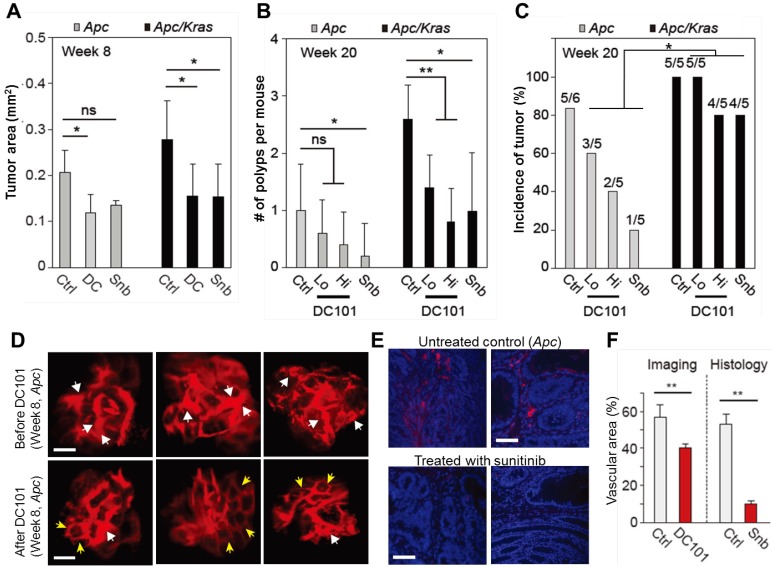
Figure 4.
The effects of anti-angiogenic therapy on continuously growing tumors. A, Tumor area at week 8. ns, not significant; *, P < 0.05. B, The number of polyps at week 20. Snb, sunitinib (40 mg/kg); DC101 Hi, high dose (40 mg/kg); DC101 Lo, low dose (10 mg/kg); ns, not significant; *, P < 0.05; **, P < 0.005. C, The incidence of polyps at week 10. Statistics was calculated on the different responsiveness between Apc and Apc/Kras using Wilcoxon signed rank test. P<0.05 D, Blood vessels in macroscopic adenomas in an Apc mouse before (at week 8) and after (at week 12) DC101 treatment. White arrows indicate dilated or torturous vessels, and yellow arrows indicate apparently normal vessels in the tumor regions. E, Fluorescence images of the blood vessels in macro-adenomas in an Apc mouse with and without treatment with sunitinib. Blue, DAPI-stained nucleus; red, CD31-stained blood vessels. F, The measured relative vascular area with and without anti-angiogenic therapy. **, P < 0.01. Scale bars, 250 µm in D and 50 µm in E.

