


Abstract
Many genetic manipulations are limited by difficulty in obtaining adequate levels of protein expression. Bioinformatic and experimental studies have identified nucleotide sequence features that may increase expression, however it is difficult to assess the relative influence of these features. Zebrafish embryos are rapidly injected with calibrated doses of mRNA, enabling the effects of multiple sequence changes to be compared in vivo. Using RNAseq and microarray data, we identified a set of genes that are highly expressed in zebrafish embryos and systematically analyzed for enrichment of sequence features correlated with levels of protein expression. We then tested enriched features by embryo microinjection and functional tests of multiple protein reporters. Codon selection, releasing factor recognition sequence and specific introns and 3′ untranslated regions each increased protein expression between 1.5- and 3-fold. These results suggested principles for increasing protein yield in zebrafish through biomolecular engineering. We implemented these principles for rational gene design in software for codon selection (CodonZ) and plasmid vectors incorporating the most active non-coding elements. Rational gene design thus significantly boosts expression in zebrafish, and a similar approach will likely elevate expression in other animal models.
INTRODUCTION
Many DNA and RNA sequence features have been identified that influence protein expression in different cell types and organisms. Increased expression may result from species-specific optimal codon usage (1), repeatedly using a given transfer RNA (tRNA) (2), the preferred release factor tetranucleotide recognition sequence (3), mRNA splicing (4), post-transcriptional regulatory elements (PREs) (5), the nucleotides flanking the AUG initiator codon (6) and use of 3′ untranslated regions (3′UTRs) from robustly expressed genes (7). In contrast, features that may reduce expression include a high frequency of rare codons (8), mRNA degradation sequences (9), cryptic splice sites (10) and strong mRNA secondary structure near the translational initiation site (11). Most of these features have been studied individually in bacteria, yeast or mammalian cell lines limiting the possibility of comparing the relative contribution of each feature to protein expression levels. Due to the expense and technical difficulty of making large numbers of genetically modified animals, few studies have examined the contribution of multiple sequence features to gene expression in vivo (7,12). Zebrafish are a suitable system for comparing factors that influence expression: embryos are easily injected with defined doses of synthetic mRNA and large numbers of transgenic larvae can be efficiently produced using transposon-based techniques (13).
During embryonic development in zebrafish, cell division occurs very rapidly such that by 24 h post fertilization (hpf), embryos are highly differentiated and even capable of basic motor behaviors. The rapid pace of development likely requires that endogenous genes are efficiently transcribed and translated. Because the processing and export of mRNAs are rate-limiting steps for protein production during vertebrate embryogenesis (14), selective pressure may enrich for sequence features that maximize protein expression levels from available mRNA transcripts. In order to compare the relative contribution of different sequence features to protein expression levels, we first searched for features that were likely to influence gene expression by identifying characteristics of highly expressed genes during zebrafish embryonic development. To measure the effect of these features on expression, we generated a series of synthetic mRNAs and transgenes incorporating these characteristics and microinjected them into embryos. Protein extracts were made at least 24 h after injection, thereby sampling from numerous cell types so that the effect of sequence features was assessed globally rather than in specialized cell populations. To ensure that the injected constructs were biologically active, we used functional reporter assays, analyzed by western blot with fluorescent-dye-coupled antibody detection to allow a quantitative comparison of the contribution of sequence features to protein expression levels.
These findings have enabled us to quantitatively compare the relative influence of different DNA features on protein expression in vivo. Importantly, this data validates new software and plasmid vector backbones for gene design based on rational principles. Experiments using transgenic animals increasingly rely on the expression of multiple genetic elements to influence cell structure and function with a high level of spatiotemporal specificity (15,16). We expect that these reagents will facilitate the construction of synthetic genes to reliably increase protein expression in vivo and thereby enable sophisticated genetic manipulations for a wide variety of research applications.
MATERIALS AND METHODS
Plasmid cloning
Genbank accession numbers for zebrafish codon-modified cDNAs: Cer.zf1 (KM458762), Cre.zf1 (KM458763), Gal4FF.zf1 (KM458764), NfsB.zf1 (KM458765), TagRFPT.zf1 (KM458766) and Tol1.zf1 (KM458767). Template DNA used for zebrafish codon-modified versions of these genes was synthesized (Genscript). Control and codon-modified cDNAs were cloned into the pCS2+ vector using the same restriction sites for each pair after polymerase chain reaction (PCR) amplification from parent vectors. Template DNA for control genes was: Nfsb, 14XUAS:NfsB-mCherry (17); TagRFP-T, UAS:TagRFP-T (kind gift of Brant Weinstein); Cre, pBS185 CMV-Cre (Addgene Plasmid 11916) (18); Gal4ff, pT2khspGFF (19); Tol1, pHel105 (20) (Cosmo Bio); Cer, pmCER (Addgene plasmid 15214) (21). For Cer, QuikChange (Stratagene) was used to modify a single codon for amino acid 207, changing it from a K to an A for consistency with GenBank sequence (AM773751.1) as used to synthesize Cer.zf1. Analysis of the zebrafish codon-modified version of NsfB, including the data on embryo death, was previously described as part of an effort to increase neuronal ablation efficiency (22). To test the effect of introns on expression, first a HuC:Cer transgene was constructed in a vector with Tol1 transposon arms, using the HuC promoter (chr3:46858745–46855606, Zv9, includes 5′ UTR) to drive Cer. Introns from the ubc and zgc:77112 genes were synthesized as gblocks (IDT) and cloned into HuC:Cer, 360 bp downstream of the transcriptional start site. For testing the β-globin intron, we used UAS:GCaMP3–2a-mCherry and UAS:BGi-GCaMP3–2a-mCherry plasmids (23). For testing translation termination tetranucleotide sequences, first the Cer-UAAU-TagRFPT construct was generated by PCR amplifying TagRFPT and cloning it into an XbaI site following the stop codon in the pCS2+ Cer plasmid above, such that the open reading frame for TagRFPT begins 21 nucleotides after the Cer stop codon. The Cer-UAGG-TagRFPT and Cer-UAAA-TagRFPT plasmids were then made using QuikChange. For testing the optimized woodchuck hepatitis virus post-transcriptional regulatoryelement (OPRE) using mRNA injections, we PCR amplified OPRE from pENTR-L5-oPRE-L2 (Addgene 32414) (24), and cloned it into an XbaI site in the 3′UTR of the pCS2+ TagRFPT plasmid described above. For testing OPRE in transgenic fish, we generated a nitroreductase-TagRFPT fusion cDNA and cloned it into pT1UMP (23) to make a UAS:NTR-TagRFPT plasmid, then cloned OPRE from pENTR-L5-oPRE-L2 into a SpeI site in the 3′UTR before the antifreeze terminator. For testing 3′UTRs, the SV40 3′UTR in pCS2+ TagRFPT was replaced with: 3′UTR from zebrafish gnb2l1 (NCBI accession NM_131444; amplified from genomic DNA with primers 5-gccttttctaatgtctgaataaaatcc, 5-ttcccagaagctgttaacttg), 3′UTR from zebrafish rps26 (NM_200025; amplified using primers 5-ctggagccgtttacataattttt, 5-cacaatatactgaaaaacatcccact), the p10 3′UTR from pJFRC28 (Addgene 36431) (7), the ocean pout antifreeze protein 3′UTR from pT2.2 (25,26) (kind gift of Yusuke Kamachi) and the rabbit β-globin 3′UTR from pCAG-CreERT2 (Addgene 14797)(27). pCS2z was derived from pCS2 TagRFPT-afp-UTR by replacing TagRFPT with a polylinker between the BamHI and XhoI sites (5-gatcccatcgattcgaattcaaggcctctagagccaccatggggtaactcgag). TagRFPT was also cloned into the BglII site of pSP64T (28) (kind gift of Tom Sargent). pT1UciMP was derived from pT1UMP with the addition of the ubc intron gblock. For pT1QciMP, the 14xUAS-E1b in pT1UciMP was replaced with a 5xQUAS-E1b cassette from p5E-QUAS (29). Plasmids are available from Addgene (www.addgene.org) and additional details of construction are available on request.
Fish husbandry
Transgenic line Tg(βactin:loxP-GFP-lynTagRFPT)y272 (βactin:Switch) was constructed by first making a UAS:Switch construct by PCR of Enhanced Green Fluorescent Protein (EGFP) from pT2KXIGΔin (30), adding lox sites to the primers and subcloning the lox-GFP-lox cassette into UAS:lyn-TagRFPT (23). For the βactin:Switch plasmid, the UAS-E1b promoter was then replaced with the βactin2 promoter, PCR amplified from P5E-βactin2 (31). Transgenic βactin:Switch fish were generated by Tol1 transgenesis as previously described (23) and bred to isolate single insertions. The UAS:nls-GFP used here is Tg(UAS-E1b:BGi-NLS-emGFP)y262 (32). Et(SCP1:Gal4FF)y271 is an enhancer trap line with broad neuronal expression of Gal4ff isolated in an enhancer trap screen (33). Lines were maintained on a Tubingen long fin background. Zebrafish protocols were approved by the NICHD animal care and use committee.
Microinjection
Capped RNA was synthesized using the standard Ambion SP6 mMessage kit protocol. Linearized plasmid DNA was cleaned using Qiagen Gel extraction clean up kit and 1 μg of linearized DNA was used for synthesis. mRNA transcripts were purified using an RNeasy Mini kit (Qiagen), concentration determined using a Nanodrop and stored at −80°C before use. Plasmid DNA and mRNAs were diluted in ultra-pure water with a final concentration of 0.2 M KCl (see Supplementary Table S1 for a summary of concentrations), and microinjectors calibrated so that reagents were injected in a 1 nl volume. Injections were performed on single-cell stage zebrafish embryos using a PV820 Pneumatic Picopump microinjector. mRNAs were injected into the yolk, and plasmid DNA for transgenesis experiments into the cell at the one cell stage. Transgenic larvae were made using Tol1 transposon mediated transgenesis (20). For each protein measurement, we performed a minimum of three biological replicates. For each replicate, an independent injection needle was calibrated and new clutch of embryos used. To further increase reliability, control and experimental constructs compared within each biological replicate were injected into siblings from the same clutch of embryos. Embryos that developed abnormally were not used for analysis. The transposon-based method produces significant variability in expression levels between larvae due to differences in the number of copies and integration sites of the transgene. To ensure larvae were randomly sampled, embryos with any fluorescence were identified at 24 hpf, raised to 5 or 7 days post-fertilization (dpf) then blindly sorted into pools of 10–20 larvae per biological replicate.
Protein extraction and quantitative western analysis
Pools of embryos or larvae were collected for each biological replicate. Protein lysis buffer was prepared using 9.5 ml 2x Laemmli Sample buffer and 0.5 ml beta-mercaptoethanol and a complete mini protease inhibitor tablet (Roche). Twenty microliter of lysis buffer was added per zebrafish embryo/larva and samples were manually homogenized. Protein expression levels relative to a co-injected control mRNA or α-tubulin as appropriate were measured by western blot using fluorescent infrared-dye-coupled antibodies which have a much larger linear range than chemiluminescent detection (34). For western analysis, 20 μl of each sample was loaded into a 4–12% Bis-Tris gel and separated by sodium dodecyl sulphate-polyacrylamide gel electrophoresis then transferred onto nitrocellulose membranes. For blots comparing biological replicates, all immunoblotting steps were performed in parallel to ensure consistency. After transfer blots were blocked with a 5% w/v dried milk in phosphate buffered saline (PBS) with 0.05% Tween-20 (PBST) for 1 h at room temperature, then incubated overnight at 4°C with the primary antibody in PBST with 2.5% w/v dried milk. Primary antibodies were: anti-EGFP (1:1000, sc-9996, Santa Cruz), anti-TagRFP (1:1000, NC9044899, Evrogen), anti-mCherry (1:1000, 1C51, Abcam) and anti-α-tubulin (1:2000, DM1A, Sigma) as a loading control. Secondary detection was performed with infra-red dye conjugated antibodies (Rockland): anti-rabbit IR 700 (611–132–003); anti-rabbit IR 800 (611–130–122) and anti-mouse IR 800 (610–132–121). Secondary antibodies were diluted at 1:2000 in a 2.5% w/v dried milk PBST solution and applied for 1 h at room temperature. Imaging and band measurement was performed with a LiCor Odyssey CLx imaging system by an individual blind to the identity of the samples. For each protein, the primary measure of expression was the protein signal relative to α-tubulin. We normalized measurements to the mean of the control groups in order to compare the magnitude of the effects derived from different sequence manipulations.
Bioinformatics
Zebrafish, mouse and human Refseq databases were downloaded from NCBI at ftp://ftp.ncbi.nlm.nih.gov/refseq/. Analyses were restricted to protein encoding genes. To identify highly expressed genes in zebrafish, we used the NCBI GEO database to retrieve microarray-derived expression data for 12 hpf (GDS3719) and 24 hpf (GDS3464) embryos (35,36). The Refseq database was searched for matching entries to identify the 200 most highly expressed genes, excluding ribosomal and mitochondrial proteins, in each set for which complete open reading frames were present, yielding sets ‘Hi-12’ (12 hpf embryos) and ‘Hi-24’ (24 hpf embryos). Genes in these groups overlapped significantly, with 126 genes appearing in both (Supplementary Figure S1a). By 12 h of development, zebrafish embryos are overtly differentiated and thus it is likely that mRNAs with high expression in whole embryo extracts are strongly expressed in multiple cell types. Therefore, to sample from embryos at stages where fewer cell types are present, we analyzed high-throughput sequence data on pooled RNA from embryos between 2.5 and 6 hpf (B. Feldman, unpublished results). For the early RNA group (‘Hi-6’), 150 non-ribosomal sequences were in the top 99th percentile of expression and were designated as highly expressed genes. Forty-one of these appeared in either or both of the microarray groups. Ribosomal genes were identified from the NCBI Refseq database by matching the string ‘ribosomal protein’ in the Definition field, and excluding ribosomal protein kinases. For mouse, the Himix set comprised 368 genes that were the non-redundant set of the top 100 genes from four microarray studies (excluding gene predictions and ribosomal genes) and 85 ribosomal genes. The microarray sets represented gene expression data for wildtype (or treatment control) extracts from blastocysts (GDS578 (37) and GDS3958, (38)), E9.5 embryo heads (GDS3442, (39)) and E10.5 embryos (GDS4028, (40)). Only genes with complete open reading frames were analyzed and where a gene had multiple transcript variants, only the variant annotated as ‘variant 1’ was used. Codon usage frequencies from the zebrafish and mouse Refseq groups closely matched previously published values for these species (R2 = 0.995 and 0.996 respectively) (41). Optimal codon usage was calculated as the percentage of codons using the most frequent synonymous codon out of all codons for which synonymous choices are available (i.e., all but Met, Trp). tRNA gene predictions for zebrafish were downloaded from the Lowe lab database (http://gtrnadb.ucsc.edu/), derived from the program tRNAscan-SE (42). Sequence logos were generated using WebLogo (43). For calculating the minimum energy folding structure between nucleotides −4 and +37 relative to the start codon, we used the hybrid-ss-min program from the UNAFold package (44). For analyzing introns, we downloaded the GFF3 file containing Refseq annotations on zebrafish Zv9 genome sequence from ftp://ftp.ncbi.nlm.nih.gov/genomes/D_rerio/GFF. Our estimate of intron density (4.0 per 1 kb of exon sequence) for zebrafish is low compared to a previous analysis (6.7 per kb) (45), but the earlier analysis used 245 genes with identifiable orthologues in all major Eukaryotic groups and may have therefore enriched for genes with a distinct genomic architecture.
Software
Software for codon selection is written as IDL runtime code and thus runs under the freely available IDL Virtual Machine (available at http://www.exelisvis.com). CodonZ can be downloaded from our website (https://science.nichd.nih.gov/confluence/display/burgess/Software). Installation and operation instructions are provided in Supplementary Figure S5.
Statistics
Statistical analysis was performed using SPSS (IBM Software) and Gnumeric (http://projects.gnome.org/gnumeric/). Box plots show median and quartiles; whiskers show minimum and maximum values with outliers (represented as circles) excluded. For bioinformatic analyses, due to the large number of data points we used a significance level of 0.001 after Bonferroni correction, whereas for comparisons of experimentally derived data we used a significance level of 0.05. All tests are two sided. For experimental manipulations, the N reported in the figure legends refers to the number of biological replicates for each construct (where each replicate was derived from 10–20 larvae, as described above). Graphs show mean and standard error of the mean.
RESULTS
Codon use bias in highly expressed genes
We identified a set of genes that are expressed highly in zebrafish from three independent data sources representing gene expression profiles at 6, 12 and 24 hpf. Because ribosomal genes are highly expressed in eukaryotes (46)—and indeed appeared among the top entries in the gene expression data—we added 86 ribosomal genes (‘Ribo’). Together, these four sets comprised 469 unique genes, which we refer to as the ‘Himix’ set (Supplementary Figure S1a). As a comparison group, we used all zebrafish genes in the NCBI Refseq database for which complete open reading frames were present (the ‘Refseq’ group, comprising 25903 genes).
We first searched for biased patterns of codon usage by highly expressed genes. The 20 amino acids are encoded by 61 codons, and 18 amino acids have multiple synonymous codons. Highly expressed genes show distinct patterns of codon selection (47) and the Translational Efficiency Hypothesis proposes that there is strong positive selection for codon usage that increases translation initiation and the rate of peptide elongation (1). To determine whether highly expressed genes in zebrafish show a distinct pattern of codon bias, we tabulated codon use frequencies for the Refseq group and for highly expressed genes (Supplementary Figure S1b). Overall, relative synonymous codon usage (RSCU) was correlated between highly expressed genes and the Refseq set (Pearson r = 0.95, P < 0.001; Figure 1a, Supplementary Figure S1c–f), indicating that the general pattern of codon use for highly expressed genes is similar to other genes. Nevertheless, the RSCU for 45 codons was statistically different between the Refseq and Himix sets (X2 test, P < 0.001), indicating that individual codons are differentially used by highly expressed genes.
Figure 1.
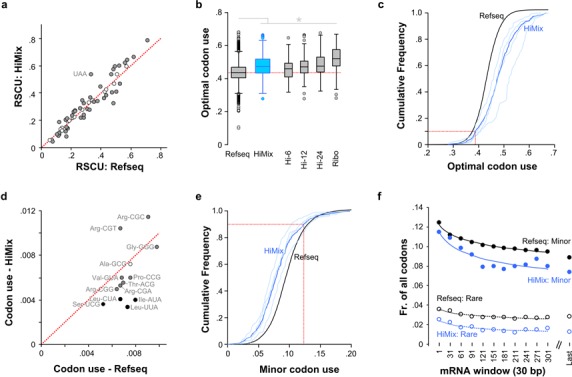
Codon use bias in genes that are highly expressed in zebrafish. (a) RSCU for 62 codons (excluding the single codon amino acids Met and Trp) in the Himix set compared to the Refseq set. Red dotted line indicates equal usage. Gray-shaded circles indicate codons with significant differences in usage between sets (X2 test, P < 0.001). (b) Optimal codon usage. The most frequently used (‘optimal’) codon for each amino acid was determined for each gene set. For each gene in the set, the fraction of codons using the optimal codon was calculated. Dotted red line indicates the median for the Refseq set. t-test *P < 0.001. (c) Cumulative frequency histogram representing preference for optimal codon usage for the data in (b). Dotted red line indicates 10th percentile, showing that 90% of highly expressed genes in the Himix set have an optimal codon use of at least 0.39. (d) Minor codon usage for all genes (Refseq) compared to the Himix gene set. Codon usage is the abundance of a particular codon as a fraction of all codons. Filled circles indicate where Himix codon usage is significantly different from the Refseq usage (X2 test, P < 0.001). Black shading indicates rare codons. Red dotted line indicates equal usage. (e) Cumulative frequency histogram for minor codon use by genes in the Refseq and Himix sets. Dotted line: <12.3% of codons are minor in 90% of highly expressed genes. (f) Minor and rare codon frequency for 30 bp windows along the coding sequence of the mRNA starting at the base indicated on the x-axis. ‘Last’ indicates the last 30 bp of the coding sequence.
We assessed whether the pattern of codon bias in highly expressed genes best matched a particular model for codon selection. Because each codon is translated at a rate determined by the abundance of matching charged tRNA isoacceptors, it has been proposed that codon use frequency matches the relative abundance of tRNA isoacceptors (48,49). The expression level of zebrafish tRNAs has not been reported, however in other species, tRNA genomic copy number has been used as a proxy for tRNA expression levels (49). Many individual tRNAs can decode multiple synonymous codons, due to non Watson–Crick pairing (‘wobble decoding’) between the third codon nucleotide and the first base in the tRNA anticodon (50). Wobble decoding is strongly influenced by a variety of tRNA post-transcriptional modifications that have not been characterized in zebrafish. We therefore assumed that the principles of the Modified Wobble Hypothesis (51) operate in zebrafish and applied these rules to calculate the total abundance of possible decoder tRNAs for each codon. Supporting this assumption, when tRNA:codon match was adjusted by using the Modified Wobble Hypothesis, the correlation of relative tRNA copy number per codon to the RSCU was increased (Supplementary Figure S1g and h; unadjusted, R2 = 0.27; adjusted R2 = 0.64). We then calculated the tRNA Adaptation Index (TAI) for each gene, a measure of how well the distribution of codons used for each gene matches the abundance of tRNA decoders. TAIs were similar across groups, with a small but significant increase seen in the Himix set only due to ribosomal proteins (Supplementary Figure S1I).
An alternate model for codon selection is the Optimal Codon hypothesis which posits that selection favors repeatedly using the codon that has the highest matching tRNA decoder content for each amino acid (1). This theory predicts that in highly expressed genes the most common codon for each amino acid should be used at a higher frequency than for other genes. For each gene set we therefore first identified the most frequently used codon for that set (here referred to as the ‘optimal codon’), then calculated an optimal codon use score (the fraction of codons that are optimal) per gene. All four groups of highly expressed genes showed a significantly greater use of optimal codons, compared to the Refseq gene set (Figure S1b and c). Highly expressed genes in zebrafish thus share a biased pattern of codon usage with enrichment for a single optimal codon for each amino acid.
Minor codon usage
We next assessed whether specific codons are avoided. In Escherichia coli, very infrequently used rare codons significantly impede translation (8,52). Although no codons showed extreme depletion in zebrafish, codon usage (CU) showed a bimodal distribution with 13 ‘minor’ codons (excluding stop codons) each occurring at <1% of the total CU (Supplementary Figure S2a). Highly expressed genes showed a significant tendency to avoid 10 of the 13 minor codons (Figure 1d and e). Four codons were depleted in all four high expression groups compared to the Refseq set and were operationally designated as ‘rare codons’ (Leu-UUA, Leu-CUA, Ser-UCG and Ile-AUA; Supplementary Figure S2b–f). Infrequently used codons may influence translation most when clustered at the start of the coding sequence (8) and in yeast a ramp of low codon adaptation in the first 50 codons of mRNA transcripts regulates translation initiation (53). Similarly, minor codons were relatively abundant at the start of the coding sequence in zebrafish transcripts (Figure 1f).
Codon selection is also influenced by genome-wide structural features that are determined in part by dinucleotide content (54). In mammals, both coding and non-coding sequences show a reduced frequency of CG and UA dinucleotides (54,55). These dinucleotides were also selectively depleted in zebrafish, including in the 3–1 position (third base of one codon and first base of the next) showing that codon selection is influenced by a bias against adjacent codons creating CG or UA dinucleotides (Supplementary Figure S3).
Translation termination and initiation sequences
Translation start and stop sequences can strongly influence expression. The nucleotide following the stop codon is strongly biased (3), most likely because stop codons are part of a four-nucleotide translation termination sequence, recognized by release factor eRF1 when releasing the polypeptide chain from the ribosome (56). The stop codon and next nucleotide have been shown to influence the efficiency of translation termination (57) and because termination is linked through ribosome recycling to reinitiation of protein synthesis from the AUG, inefficient stop codons have been shown to yield reduced protein levels (58). Conversely, highly expressed genes tend to have a preference for a particular tetranucleotide (59). In zebrafish highly expressed genes preferentially used the stop codon UAA in contrast to other genes that most frequently used UGA (Supplementary Figure S1b). The nucleotide after the stop codon was most frequently an A (Figure 2a–d), a tendency that was significantly enhanced in highly expressed genes (Figure 2b; X2 = 26.4, P < 0.001). Comparing the frequency of usage of all 12 possible stop tetranucleotides, UAAA was strongly enriched in highly expressed genes whereas four tetranucleotides were significantly depleted in highly expressed genes (Figure 2e), including the tetranucleotide UAGG that was also the least frequently used in the Refseq set.
Figure 2.
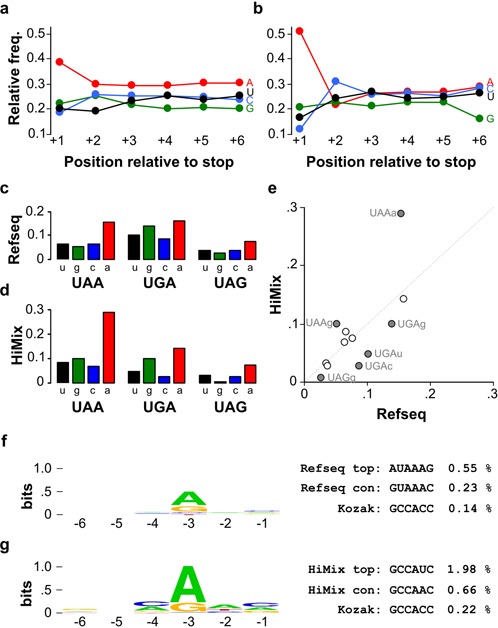
Nucleotide use at translation termination and initiation sequences. (a–b) Relative use frequency for the 6 nucleotides following the stop codon in the (a) Refseq gene set and (b) Himix gene set. (c–d) Relative use frequency for stop tetranucleotides in the (c) Refseq gene set and (d) Himix gene set. Lower case letter indicates the nucleotide immediately following the indicated stop codon. (e) Comparison of stop tetranucleotide frequency in the Refseq gene set compared to the Himix set. Filled circles indicate tetranucleotides where use in the two sets is significantly different (Chi-square P < 0.05). (f–g) Left: DNA logo representing the nucleotide usage frequency in the six bases before the initiator ATG for Refseq genes (f) and the Himix gene set (g). Right: actual usage frequency for specific sequences in each set.
The Kozak consensus sequence RCCAUGG flanking the initiator AUG (underlined) increases the efficiency of translation initiation by ribosomes in mammalian cells, with the presence of a purine residue in the −3 position being particularly important (6). Enrichment for G in the +4 position is not thought to modulate the efficiency of translation initiation but reflects constraints on the second amino acid of the peptide chain (60). In the Himix set, 97% of transcripts used a purine in the −3 position, a strong enrichment compared to the Refseq set (87%, X2 = 40.1, P < 0.001; Figure 2f and g). The consensus for the 6 nucleotides preceding the AUG was GUAAAC and GCCAAC in the Refseq and Himix sets respectively, while the most frequently used sequence in the Himix set was GCCAUC (Figure 2g).
Translation initiation is impaired when strong secondary structure for nucleotides −4 to +37 (relative to the AUG) reduces accessibility for the ribosome (11,61). In other parts of the transcript, local mRNA structure is not generally a major determinant of the rate of translation elongation since the ribosome processively destabilizes the mRNA (62,63). The mean free energy of the minimum energy structure (dG) at 28°C for zebrafish transcripts was 2 kcal/mol greater than for mouse or human transcripts, suggesting that nucleotide sequence has adapted to reduce secondary structure at the typical environmental temperatures that zebrafish inhabit (16.5–33°C (64); Figure 3a). Highly expressed genes showed a small but significant tendency for a more open mRNA structure than other genes (Figure 3a and b).
Figure 3.
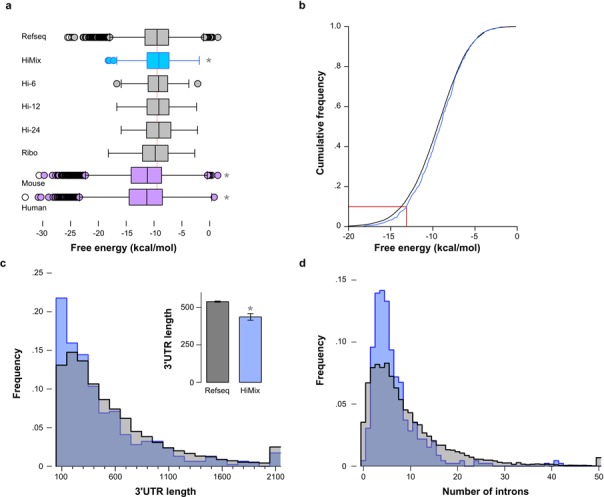
Structural mRNA and gene features in highly expressed genes. (a) Box plots of the maximal free energy of folding (dG) for nucleotides from −4 to +37 for genes in each data set and for genes in the mouse and human Refseq databases. *P < 0.05 for the mean compared to the zebrafish Refseq set. (b) Cumulative frequency histograms for the free energy of the minimum energy secondary structure (dG) for Refseq (black) and Himix (blue) gene sets. Dotted line indicates that for 90% of highly expressed genes, the dG was greater than –13.1 kcal/mol. (c) Distribution of 3′UTRs lengths (from the stop codon to the beginning of the polyadenylated sequence) in the Refseq (gray) and Himix (blue) sets. Bins sizes are 100 bp with maximum values per bin indicated on the x-axis. Inset, mean and standard error for each group. Mann–Whitney U test * P < 0.001. (d) Distribution of number of introns per gene for the Refseq (gray) and Himix (blue) sets.
Non-coding sequences
Protein expression levels are influenced by specializations in non-coding regions, including in 3′UTR and intronic sequence. The 3′ UTR of mRNA influences protein expression through multiple pathways, including regulatory sequence motifs and secondary structure that affect the efficiency of polyadenylation, transcript stability, mRNA localization and ribosome recycling (65). In general longer 3′UTRs have been associated with lower levels of protein expression (66). Consistent with this, 3′UTRs were significantly shorter in highly expressed genes in zebrafish (Figure 3c).
Transgene expression in mice and Drosophila is also increased by the presence of an intron (67,68). We found an average of 8.96 introns per gene in the Refseq set, close to the reported value of 8.93 for zebrafish (69). Although highly expressed genes had only 6.51 introns per gene, exon lengths were also smaller, resulting in a significantly higher intron density (Refseq, 4.0 ± 2.2 introns per 1 kb of exon sequence; Himix 5.0 ± 2.3; P < 0.001). Moreover, in the Refseq set, 3.5% of genes had no intronic sequence, similar to the reported 4.5% of intronless genes in humans (70), whereas only 0.44% of highly expressed genes were intronless (Figure 3d; X2 = 40.1, P < 0.001). Thus highly expressed genes in zebrafish tend to contain at least one intron and introns are maintained at a higher density than other genes.
Increasing functional protein expression through codon selection
Together, these findings indicated that coding sequences for genes that are highly expressed in zebrafish display distinct nucleotide features: increased use of the most frequently used codon for each amino acid, depletion of minor codons, biased use of initiation and terminator sequences and a more open mRNA secondary structure in the region including the translation start site (Table 1). We repeated these analyses on genes that are highly expressed during mouse embryonic development. Optimal codon usage was elevated for highly expressed genes in mouse, although unlike zebrafish, Refseq and Himix sets employed the same set of optimal codons (Supplementary Figure S4a–c). As for zebrafish, a discrete set of minor codons was depleted, but not in the first 60–100 nucleotides of the coding sequence (Supplementary Figure S4d–g) and CG and TA dinucleotides were avoided (Supplementary Figure S4h). The most common stop tetranucleotide in highly expressed genes was the same as for zebrafish, UAAa (Supplementary Figure S4i). Highly expressed genes tended toward a slightly more open mRNA structure in the region surrounding the start codon (Supplementary Figure S4j) and more frequently used the canonical Kozak sequence GCCACC (Supplementary Figure S4k). The similar set of nucleotide sequence biases for highly expressed genes in mouse supports the idea that these sequence features contribute to high protein expression.
Table 1. Summary of nucleotide preferences shown by 90% of genes that are highly expressed in zebrafish and mouse.
| Zebrafish | Mouse | |
|---|---|---|
| Optimal codon frequency | > 38.7% | > 36.9% |
| Minor codon frequency | < 12.3% | < 11.5% |
| Rare codon frequency | < 2.9% | < 2.9% |
| Initiator structure (kcal/mol) | > −13.1 | > −12.9 |
| Stop tetranucleotide | UAAa | UAAa |
| Kozak-like sequence | gccatc | gccacc |
| CG frequency | < 8.2% | < 8.5% |
| TA frequency | < 6.7% | < 6.7% |
Initiator structure refers to free energy of the minimum energy structure for nucleotides −4 to +37 relative to the start codon and was calculated at 28°C for zebrafish and 37°C for mouse.
We then developed software (CodonZ, Supplementary Figure S5) for engineering gene sequences based on the patterns of nucleotide bias found in highly expressed genes (Table 1). The algorithm in CodonZ selects nucleotides based on: (i) Use of optimal codons from the Himix set. (ii) Maximization of free energy of folding at the translation initiation start. (iii) Avoidance of minor codons after the first 60 bp of the coding sequence. (iv) Avoidance of CG and TA dinucleotides created through the juxtaposition of codons. (v) Use of UAAa as the stop codon tetranucleotide. (vi) Use of a frequently occurring Kozak-like sequence. (vii) Avoidance of cryptic splice sites and mRNA degradation motifs (71,72).
We used CodonZ to design codon-modified versions of genes that are frequently used in zebrafish experiments. We synthesized codon-modified versions of six genes: Cerulean (Cer), Cre recombinase (Cre), Gal4ff, NfsB, TagRFPT and Tol1 transposase (Tol1). Control versions were derived from commonly used plasmid clones containing these genes. These genes are heterologous to zebrafish and, except for TagRFPT, contain at least one feature below threshold for native highly expressed genes (Supplementary Table S2). We then microinjected defined amounts of capped mRNA for each gene and extracted protein at 24 h of development (Figure 4a). We measured protein activity using functional assays as our primary assay rather than measurement of protein levels for two reasons: first, robust antibodies were not available for each of the proteins and introducing an epitope tag risked interfering with protein function. Second, modifying codon use may alter levels of the protein product without increasing biological activity due to impairments in co-translational folding (63,73).
Figure 4.
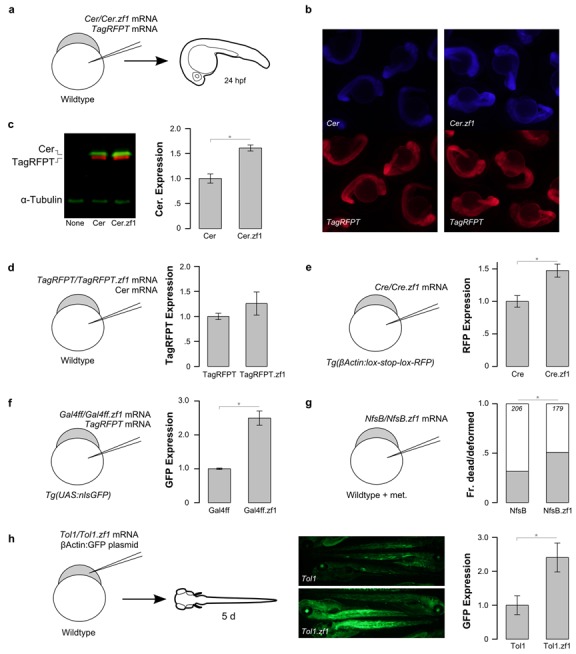
Functional protein expression in codon-modified versions of genes for zebrafish. (a) Schematic of microinjection of mRNA into embryos for testing sequence features on protein expression. Protein is extracted at 24 hpf and analyzed by fluorescent western blot. Similarly, schematics in (d–g) indicate the genotype of the embryos and composition of the injection mix. (b–c) Cer modification, tested by microinjection of Cer or Cer.zf1 mRNA together with TagRFPT mRNA as a control into wildtype embryos (N = 3 groups each version). (b) Epifluorescent images of 24 hpf embryos expressing standard Cer or the version modified for zebrafish (Cer.zf1) and the matched TagRFPT co-injected control. (c) Quantification by western blot using an anti-EGFP antibody that recognizes an epitope also present in Cerulean, and an anti-TagRFPT antibody. Cer expression is the ratio of Cer and TagRFPT band intensities. (d) TagRFPT modification, tested by injection into wildtype embryos (N = 3). Experimental procedure was as in (a) except using mRNA encoding TagRFPT or TagRFPT.zf1, and Cerulean mRNA as control. Quantification by western blot with anti-TagRFPT and anti-EGFP. TagRFPT expression is the ratio of TagRFPT and Cer band intensities. (e) Cre modification, tested by injection into transgenic bActin:lox-GFP-stop-lox-RFP embryos (N = 3). Quantification by western blot with anti-TagRFPT, normalized to anti-α-tubulin. Increased RFP expression indicates greater Cre recombinase activity. (f) Gal4ff modification, tested by injection into transgenic UAS:GFP embryos together with TagRFPT mRNA as a control (N = 6). Quantification by western blot with anti-EGFP and anti-TagRFPT. GFP expression is the ratio of GFP and TagRFPT band intensities. (g) Nfsb modification, tested by injection into wildtype embryos treated with 10 mM metronidazole (met.) overnight. The fraction of embryos either dead or severely deformed is indicated (gray bars). Total number of embryos examined is indicated in italics. (h) Tol1 modification, tested by injection of Tol1 mRNA together with a plasmid containing a cassette with the β-actin promoter driving GFP, flanked by Tol1 transposon arms (N = 8). Middle: Epifluorescent images of GFP in 5 dpf embryos generated using standard Tol1 (top panel) and the zebrafish codon-modified versions (Tol1.zf1; bottom panel). Right: Quantification by western blot with anti-GFP, normalized to anti-α-tubulin. *P < 0.05.
(i) Cer was derived from cyan fluorescent protein (21), a human codon optimized version of Aequorea victoria green fluorescent protein (GFP) with blue-shift mutations. The zebrafish-modified sequence has a more relaxed secondary structure surrounding the translation start site, a change that enhanced expression of GFP in E. coli (11). Consistent with this, embryos injected with zebrafish Cer showed stronger fluorescence corresponding to a 1.6-fold increase in protein expression (Figure 4b and c). (ii) TagRFPT is a photostabilized version of human codon optimized eqFP578 from Entacmaea quadricolor (74). TagRFPT did not show below threshold codon use for any parameters but used the stop tetranucleotide TGAG which is depleted in highly expressed genes. After microinjection, the zebrafish version did not show obviously greater fluorescence or a significant increase in protein expression by western blot (Figure 4d). (iii) Cre is a protein derived from bacteriophage P1 widely used for site-specific recombination between lox sites (18). Native Cre has an excess of minor and rare codons, was below threshold for optimal codon usage and used the rarely used stop tetranucleotide TAGG. Cre mRNA was injected into transgenic embryos containing a βActin:lox-GFP-lox-TagRFPT cassette (βActin:Switch), such that Cre-mediated recombination between lox sites results in TagRFPT expression. The zebrafish version produced a 1.5-fold increase in TagRFPT protein expression (Figure 4e). (iv) Gal4ff was engineered from the transcriptional activator Gal4 by replacing the native activator domain with a dimer of the minimal VP16 transactivation domain (19). The control version had an excess of minor and rare codons. Microinjection of Gal4ff mRNA into UAS:GFP transgenic embryos to drive expression of GFP demonstrated that the zebrafish codon-modified version produced a 2.5-fold increase in GFP protein (Figure 4f). (v) The nitroreductase NfsB from E. coli converts nitroimidazole substrates into cellular toxins for targeted ablation experiments (17,75). NfsB has below threshold optimal codon usage and an excess of minor codons. After injection of embryos with E. coli NfsB mRNA and treatment overnight with the substrate metronidazole, around 30% of embryos were dead or severely deformed. As we previously described (22), the fraction of affected embryos increased 1.6-fold with the zebrafish-modified version (Figure 4g). (vi) Tol1 is a transposase encoded by active transposable elements in Medaka (20). Tol1 showed sub-optimal codon use, an excess of rare codons and a Kozak-like sequence not present in any highly expressed gene. We generated transgenic embryos expressing GFP by injection of embryos with Tol1 mRNA and the βactin:Switch plasmid which includes transposon recognition sequences. We anticipated that greater Tol1 protein expression would produce transgenic embryos with stronger GFP expression due to less mosaicism because of earlier transgene integration or a larger number of integrations. The zebrafish version showed a 2.4-fold increase in GFP expression (Figure 4h).
Together, these experiments confirm the reliability of our algorithm for engineering codon sequences in zebrafish for increasing expression. Nucleotide selection to match features of highly expressed zebrafish genes yielded between a 1.5- and 2.5-fold increase in biological activity for five of the six genes tested. Codon use for the control version of the remaining gene (TagRFPT) was already within the range of highly expressed genes in zebrafish.
Effect of non-coding sequences on protein expression
We next assessed whether protein expression could be further increased by including non-coding nucleotide features enriched in highly expressed genes (Figure 5a). Because highly expressed genes were rarely intronless, we first tested incorporating an intron into a transgene construct. Transgenics are efficiently produced in zebrafish using transposon-based methods (13). Initial strong but punctate expression from non-integrated plasmid is followed by weaker but broad expression from randomly integrated copies of the plasmid (Figure 5b). Introns more strongly increase protein expression when placed in 5′UTR sequences than 3′UTR sequences (4) and indeed in zebrafish are more often found in 5′UTR than 3′UTR sequences (69), possibly because the presence of a stop codon in any but the last exon is a signal for nonsense mediated decay (76). We tested the intron of ubiquitin C (ubc) and the first intron of zgc:77112, selected because they are normally present in the 5′ UTR of a highly expressed gene. As a benchmark, we used the rabbit β-globin intron which was previously reported to increase expression in zebrafish (12,77). The zgc:77112 intron did not influence expression, whereas the ubc intron and the β-globin intron increased reporter expression 2.8-fold and 1.6-fold respectively (Figure 5c).
Figure 5.
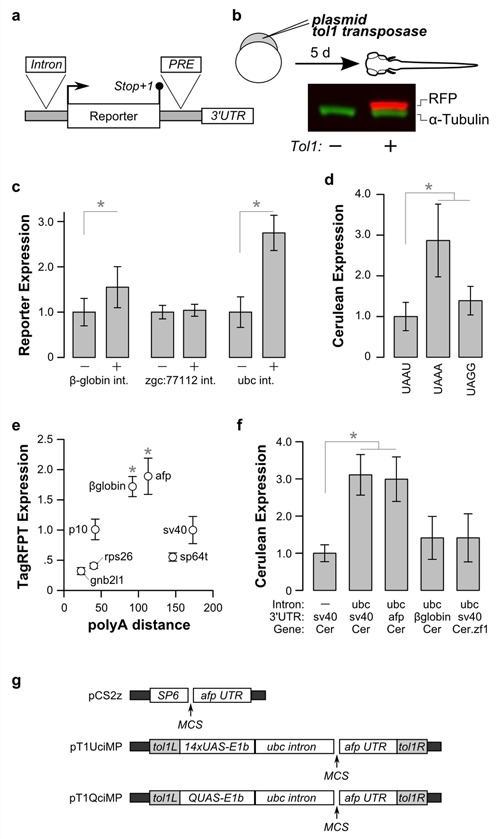
Non-coding nucleotide features that increase protein expression. (a) Schematic of sequence features, showing the position of the inserted intron, PRE element and 3′ UTRs tested. (b) Microinjection of plasmid DNA and transposase for testing features of gene structure on protein expression. Protein is extracted at 5 dpf to ensure that expression from integrated transgenes is analyzed. Here the transgene is a nitroreductase-TagRFPT fusion, similar in size to α-tubulin. Expression from embryos where transposase is omitted from the injection mix (left lane) and where transposase is included resulting in expression from the integrated transgene (right lane). (c) Reporter expression in transgenic larvae, generated using constructs without (−) and with (+) the indicated intron. Introns from zgc:77112 and ubc were tested in the 5′UTR of the gene encoding Cer in HuC:Cer transgenic larvae (N = 6 groups each for control and intron-containing versions). The rabbit β-globin intron was tested in the 5′UTR of the gene encoding mCherry in Et(SCP1:Gal4)y271; UAS:GCaMP3–2a-mCherry transgenic (N = 6 groups each). *P < 0.05. (d) Cer expression in embryos injected with a mRNA for Cer-STOP-TagRFPT, where the stop codon and next nucleotide are as indicated (N = 6). *P < 0.05. (e) TagRFPT expression in embryos injected with mRNA synthesized from pCS2-based constructs with alternate 3′ UTRs: zebrafish rps26 (N = 3), zebrafish gnb2l1 (N = 3), p10 (N = 5), pout afp (N = 6), rabbit β-globin (N = 3). Also expression from mRNA derived from the pSP64T vector (N = 3). In each case expression was normalized to injections using mRNA with the unmodified pCS2 which contains a sv40 3′UTR. The x-axis indicates the number of nucleotides in the 3′UTR from the stop codon to the first AAUAAA polyadenylation motif. *P < 0.05. (f) Cer expression in transgenic larvae, generated with constructs using a HuC promoter with the indicated combinations of the ubc intron, the sv40, afp or β-globin 3′UTR and codon-modified Cerulean. N = 5–8 groups per combination. *P < 0.05. (g) Plasmid backbones containing elements that promote gene expression in zebrafish. Plasmid pT1UciMP contains tol1 arms (gray), a 14xUAS-E1b promoter and carp β-actin initiator sequence, the ubc intron, a multiple cloning site and the afp 3′UTR. Plasmid pT1QciMP is similar but with a QUAS regulatory element in place of the 14xUAS sequence.
The stop tetranucleotide UAAA was enriched in highly expressed genes. Biased use of a stop tetranucleotide may serve to suppress read-through translation rather than to increase protein expression (78). We measured the effect on both protein expression and read-through using Cer-Stop-TagRFPT constructs, where the stop tetranucleotide of Cer was followed by an in-frame coding sequence for TagRFPT. Read-through should result in TagRFPT expression, while increased termination efficiency should promote Cer expression. We compared three tetranucleotide sequences: the rarely used UAGg, the moderately frequent UAAU and the preferred UAAA. We did not detect read-through for any of the constructs (Supplementary Figure S6a and b) and observed that UAAA increased expression of Cer 2.9-fold compared to UAAU (Figure 5d, Supplementary Figure S6c–e). Unexpectedly, the UAGG terminator sequence also showed a small but significant increase in expression compared to UAAU.
Highly expressed genes tended to have short 3′ UTRs. We compared expression of TagRFPT fused to 3′ UTRs of different lengths: two from highly expressed zebrafish genes with short 3′ UTRs (ribosomal protein S26 (rps26) and guanine nucleotide binding protein beta polypeptide 2-like 1 (gnb2l1)), the SV40 late polyadenylation sequence commonly used in zebrafish (31), the 3′UTR from the Autographa californica nucleopolyhedrovirus p10 gene shown to promote expression in Drosophila (7), a sequence comprising the polyA signal from the gene encoding the ocean pout (Macrozoarces americanus) antifreeze protein (afp) (25) and a sequence derived from the non-coding region of the rabbit β-globin last exon in the pCAGGS vector frequently used in transgenic mice (79). Each of these 3′UTRs contains both the AAUAAA motif required for pre-mRNA cleavage and a U-rich region similar to a cytoplasmic polyadenylation motif (80) that allow processing of in vitro transcribed mRNA. We also tested expression of TagRFPT made from the pSP64T plasmid commonly used for microinjection into xenopus oocytes (28). After injection, mRNA with UTRs from rps26 and gnb2l1 did not confer increased expression relative to the SV40 polyA, indicating that although highly expressed genes in zebrafish tend to have shorter 3′UTRs, there was no relationship between the expression levels and the length of the 3′ UTR. pSP64T derived mRNA also failed to increase expression. The strongest expression was seen from mRNAs using the afp and the β-globin 3′UTRs (Figure 5e). We also tested whether incorporating a woodchuck hepatitis virus PRE in the 3′ UTR increased protein expression. PREs increase expression in transgenic mice and Drosophila and in mammalian cell culture (5,7,81). However in mRNA injections, the presence of a PRE strongly suppressed protein expression and in transgenic larvae, the PRE had no effect on expression suggesting that this element is not biologically active in zebrafish (Supplementary Figure S7).
In summary, these results indicated that the afp 3′UTR and the ubiquitin C intron were the most effective non-coding elements for increasing expression. We next tested whether the ubc intron, afp 3′UTR and codon modification used in combination retained their ability to increase gene expression, or gave additive effects (Figure 5f). We first confirmed that inclusion of the ubc intron increased expression compared to the HuC:Cer-sv40 transgene (3.1-fold). Replacement of the sv40 3′UTR with the afp 3′UTR did not provide a further boost in expression. Moreover, transgenic larvae with the ubc intron, unmodified Cer and sv40 3′UTR, showed stronger expression than larva made with constructs using the β-globin 3′UTR or codon-modified Cer.zf1. Thus codon modification, intron inclusion and 3′UTR selection did not produce additive effects on expression in transgenic larvae. To facilitate synthetic gene design, we constructed a set of vectors incorporating these elements for common experimental manipulations in zebrafish (Figure 5g).
DISCUSSION
Genetic methods offer the opportunity to target defined cell populations with unprecedented spatiotemporal specificity. However, robust protein expression is often essential for manipulations of cellular function or visualizing cell structure. In principle, the many different nucleotide sequence features that have been proposed to contribute to protein expression levels offer a simple way to increase expression. However, few studies have rigorously compared multiple features in a single experimental system to determine which sequence features reliably increase expression. By systematically measuring the effect on expression of features that were enriched in genes that are highly expressed during development, we have developed a software package for codon selection and expression vectors for rational gene design. We validated these tools by increasing the biological activity of a set of proteins that are commonly used in zebrafish experiments. Engineering coding sequences using our algorithm increased functional protein expression between 1.5- and 2.5-fold for five of the six genes tested, whereas the outlier, TagRFPT, already possessed characteristics within the normal range for highly expressed genes in zebrafish. Expression was also increased 2.8-fold by the ubc intron, 2.9-fold with the UAAA stop tetranucleotide and 1.9-fold with afp 3′UTR.
Sequence features that individually promoted expression did not produce additive effects when combined in transgenic larvae. This may be due to a ceiling effect, beyond which additional elements interfere with protein expression. Instead, our findings suggest alternative strategies for boosting gene expression: that the optimal approach for mRNA injection experiments is to use codon modification or the afp 3′UTR in the pCS2z vector whereas for transgenic experiments, the best strategy is to use the ubc intron with the afp 3′UTR.
Competing hypotheses have been advanced to explain patterns of codon bias in genes that are highly expressed. It has been suggested that codon selection does not serve to increase protein expression, but rather that evolutionary pressure on genes that are highly expressed (for example, from strong promoters) alters codon usage to avoid sequestering ribosomes, thereby improving cell fitness (11). Another hypothesis is that codons are selected to minimize mis-translation (82). Recent ribosome profiling experiments have shown a significant correlation between the elongation rate across segments of mRNA and local adaptation to the tRNA pool, suggesting that codon use does influence translation efficiency (83). By measuring protein activity derived from defined amounts of injected mRNA, our data supports the concept that codon bias does contribute to increased protein expression.
Our model for codon selection suggests that sequences that have already been engineered to match patterns of codon bias in mammals are likely to be expressed efficiently in zebrafish. It may nevertheless be valuable to recode native fish or mammalian mRNAs when making transgenic animals, because it has recently been shown that around 15% of codons in human exome sequence are part of transcription factor binding sequences (84). Recoding mRNAs will remove these elements, potentially preventing regulation that may reduce protein expression in some cells. However, we anticipate that in some cases, recoding mRNAs will not enhance expression even where codon use is sub-optimal. Clusters of rare codons may facilitate protein folding by inducing ribosome pausing (85). Thus expression of some non-native genes may require insertion of minor codon clusters at the corresponding positions.
Non-coding elements also increased expression. Surprisingly, 3′UTRs from highly expressed zebrafish genes did not confer stronger expression than the widely used SV40 polyA. Rather, the most effective 3′UTR was from ocean pout afp, a cassette originally cloned as part of a gene transfer cassette for fish gene transfer experiments (86). Of the three introns tested, expression was most strongly promoted by the single intron of ubc, a gene from the highly expressed group. This intron is in the 5′UTR of the gene, the same position as in our tests. The mammalian ubc intron contains two binding sites for the Yin Yang 1 (YY1) transcription factor that increase expression through a splicing-dependant mechanism (87). The zebrafish intron contains a single near-consensus match to the YY1 binding site and may therefore increase expression by a similar means. Because introns are only found in genes it has been suggested that introns may inhibit general mechanisms to suppress transcription and translation from intergenic regions (88). Similarly, the presence of an intron may differentiate endogenous genes from active retrotransposons. Transgenes in zebrafish and mice are susceptible to silencing (89–91), and it is plausible that the presence of an intron may help to suppress epigenetic mechanisms for silencing foreign DNA elements. It has also been suggested that reduced CG dinucleotide content may decrease the rate of transgene silencing (25). Accordingly, the algorithm in CodonZ avoids CG dinucleotides (Supplementary Table S2).
In summary, we have developed an experimentally validated algorithm for codon selection that enhances gene expression in zebrafish and constructed a set of vectors to aid rational design of transgenes and mRNA expression vectors. The sequence features that we used for increasing expression were identified by analyzing genes that are highly expressed during early embryonic development in zebrafish. The rapid pace of development suggested that genes required during this period should be adapted to allow efficient protein expression. This approach can be readily adapted to any organism by identifying highly expressed genes in cell populations under similar constraints. Indeed, our analysis of highly expressed genes in mice suggests that the same principles may promote expression in mammals. Research in many fields increasingly relies on genetic methods for manipulating or monitoring cell function, and there is a strong interest in synthetic biology for the construction of artificial genetic circuits. We therefore anticipate that these tools will facilitate a wide range of manipulations in which robust protein expression levels are essential.
SUPPLEMENTARY DATA
Supplementary Data are available at NAR Online.
Acknowledgments
We are grateful to Richard Maraia and Antony Burgess for critical comments on the manuscript, and to Damian Dalle Nogare for testing software.
Footnotes
The authors wish it to be known that, in their opinion, the first two authors should be regarded as Joint First Authors.
ACCESSION NUMBER
Genbank: KM458762, KM458763, KM458764, KM458765, KM458766, KM458767.
FUNDING
Intramural Research Program of the Eunice Kennedy Shriver National Institute of Child Health and Human Development. Funding for open access charge: Division of Intramural Research of the National Institute of Child Health and Human Development.
Conflict of interest statement. None declared.
REFERENCES
- 1.Xia X. How optimized is the translational machinery in Escherichia coli, Salmonella typhimurium and Saccharomyces cerevisiae? Genetics. 1998;149:37–44. doi: 10.1093/genetics/149.1.37. [DOI] [PMC free article] [PubMed] [Google Scholar]
- 2.Cannarozzi G., Schraudolph N.N., Faty M., von Rohr P., Friberg M.T., Roth A.C., Gonnet P., Gonnet G., Barral Y. A role for codon order in translation dynamics. Cell. 2010;141:355–367. doi: 10.1016/j.cell.2010.02.036. [DOI] [PubMed] [Google Scholar]
- 3.Cridge A.G., Major L.L., Mahagaonkar A.A., Poole E.S., Isaksson L.A., Tate W.P. Comparison of characteristics and function of translation termination signals between and within prokaryotic and eukaryotic organisms. Nucleic Acids Res. 2006;34:1959–1973. doi: 10.1093/nar/gkl074. [DOI] [PMC free article] [PubMed] [Google Scholar]
- 4.Nott A., Meislin S.H., Moore M.J. A quantitative analysis of intron effects on mammalian gene expression. RNA. 2003;9:607–617. doi: 10.1261/rna.5250403. [DOI] [PMC free article] [PubMed] [Google Scholar]
- 5.Mahonen A.J., Airenne K.J., Purola S., Peltomaa E., Kaikkonen M.U., Riekkinen M.S., Heikura T., Kinnunen K., Roschier M.M., Wirth T., et al. Post-transcriptional regulatory element boosts baculovirus-mediated gene expression in vertebrate cells. J. Biotechnol. 2007;131:1–8. doi: 10.1016/j.jbiotec.2007.05.022. [DOI] [PubMed] [Google Scholar]
- 6.Kozak M. Point mutations define a sequence flanking the AUG initiator codon that modulates translation by eukaryotic ribosomes. Cell. 1986;44:283–292. doi: 10.1016/0092-8674(86)90762-2. [DOI] [PubMed] [Google Scholar]
- 7.Pfeiffer B.D., Truman J.W., Rubin G.M. Using translational enhancers to increase transgene expression in Drosophila. Proc. Natl Acad. Sci. U.S.A. 2012;109:6626–6631. doi: 10.1073/pnas.1204520109. [DOI] [PMC free article] [PubMed] [Google Scholar]
- 8.Chen G.-F.T., Inouye M. Suppression of the negative effect of minor arginine codons on gene expression; preferential usage of minor codons within the first 25 codons of the Escherichia coli genes. Nucleic Acids Res. 1990;18:1465–1473. doi: 10.1093/nar/18.6.1465. [DOI] [PMC free article] [PubMed] [Google Scholar]
- 9.Ohme-Takagi M., Taylor C.B., Newman T.C., Green P.J. The effect of sequences with high AU content on mRNA stability in tobacco. Proc. Natl Acad. Sci. U.S.A. 1993;90:11811–11815. doi: 10.1073/pnas.90.24.11811. [DOI] [PMC free article] [PubMed] [Google Scholar]
- 10.Haseloff J., Siemering K.R., Prasher D.C., Hodge S. Removal of a cryptic intron and subcellular localization of green fluorescent protein are required to mark transgenic Arabidopsis plants brightly. Proc. Natl Acad. Sci. U.S.A. 1997;94:2122–2127. doi: 10.1073/pnas.94.6.2122. [DOI] [PMC free article] [PubMed] [Google Scholar]
- 11.Kudla G., Murray A.W., Tollervey D., Plotkin J.B. Coding-sequence determinants of gene expression in Escherichia coli. Science. 2009;324:255–258. doi: 10.1126/science.1170160. [DOI] [PMC free article] [PubMed] [Google Scholar]
- 12.Distel M., Wullimann M.F., Koster R.W. Optimized Gal4 genetics for permanent gene expression mapping in zebrafish. Proc. Natl Acad. Sci. U.S.A. 2009;106:13365–13370. doi: 10.1073/pnas.0903060106. [DOI] [PMC free article] [PubMed] [Google Scholar]
- 13.Kawakami K. Transgenesis and gene trap methods in zebrafish by using the Tol2 transposable element. Methods Cell Biol. 2004;77:201–222. doi: 10.1016/s0091-679x(04)77011-9. [DOI] [PubMed] [Google Scholar]
- 14.Hoyle N.P., Ish-Horowicz D. Transcript processing and export kinetics are rate-limiting steps in expressing vertebrate segmentation clock genes. Proc. Natl Acad. Sci. U.S.A. 2013;110:E4316–E4324. doi: 10.1073/pnas.1308811110. [DOI] [PMC free article] [PubMed] [Google Scholar]
- 15.Potter C.J., Tasic B., Russler E.V., Liang L., Luo L. The Q system: a repressible binary system for transgene expression, lineage tracing, and mosaic analysis. Cell. 2010;141:536–548. doi: 10.1016/j.cell.2010.02.025. [DOI] [PMC free article] [PubMed] [Google Scholar]
- 16.Park J.T., Leach S.D. TAILOR: transgene activation and inactivation using lox and rox in zebrafish. PLoS One. 2013;8:e85218. doi: 10.1371/journal.pone.0085218. [DOI] [PMC free article] [PubMed] [Google Scholar]
- 17.Pisharath H., Rhee J.M., Swanson M.A., Leach S.D., Parsons M.J. Targeted ablation of beta cells in the embryonic zebrafish pancreas using E. coli nitroreductase. Mech. Dev. 2007;124:218–229. doi: 10.1016/j.mod.2006.11.005. [DOI] [PMC free article] [PubMed] [Google Scholar]
- 18.Sauer B., Henderson N. Targeted insertion of exogenous DNA into the eukaryotic genome by the Cre recombinase. New Biol. 1990;2:441–449. [PubMed] [Google Scholar]
- 19.Asakawa K., Suster M.L., Mizusawa K., Nagayoshi S., Kotani T., Urasaki A., Kishimoto Y., Hibi M., Kawakami K. Genetic dissection of neural circuits by Tol2 transposon-mediated Gal4 gene and enhancer trapping in zebrafish. Proc. Natl Acad. Sci. U.S.A. 2008;105:1255–1260. doi: 10.1073/pnas.0704963105. [DOI] [PMC free article] [PubMed] [Google Scholar]
- 20.Koga A., Cheah F.S., Hamaguchi S., Yeo G.H., Chong S.S. Germline transgenesis of zebrafish using the medaka Tol1 transposon system. Dev. Dyn. 2008;237:2466–2474. doi: 10.1002/dvdy.21688. [DOI] [PubMed] [Google Scholar]
- 21.Rizzo M.A., Springer G.H., Granada B., Piston D.W. An improved cyan fluorescent protein variant useful for FRET. Nat. Biotech. 2004;22:445–449. doi: 10.1038/nbt945. [DOI] [PubMed] [Google Scholar]
- 22.Tabor K.M., Bergeron S.A., Horstick E.J., Jordan D.C., Aho V., Porkka-Heiskanen T., Haspel G., Burgess H.A. Direct activation of the Mauthner cell by electric field pulses drives ultra-rapid escape responses. J. Neurophysiol. 2014;112:834–844. doi: 10.1152/jn.00228.2014. [DOI] [PMC free article] [PubMed] [Google Scholar]
- 23.Yokogawa T., Hannan M.C., Burgess H.A. The dorsal raphe modulates sensory responsiveness during arousal in zebrafish. J. Neurosci. 2012;32:15205–15215. doi: 10.1523/JNEUROSCI.1019-12.2012. [DOI] [PMC free article] [PubMed] [Google Scholar]
- 24.Schambach A., Bohne J., Baum C., Hermann F.G., Egerer L., von Laer D., Giroglou T. Woodchuck hepatitis virus post-transcriptional regulatory element deleted from X protein and promoter sequences enhances retroviral vector titer and expression. Gene Ther. 2006;13:641–645. doi: 10.1038/sj.gt.3302698. [DOI] [PubMed] [Google Scholar]
- 25.Gibbs P.D., Schmale M.C. GFP as a genetic marker scorable throughout the life cycle of transgenic zebra fish. Mar. Biotechnol. (NY) 2000;2:107–125. doi: 10.1007/s101269900014. [DOI] [PubMed] [Google Scholar]
- 26.Ogura E., Okuda Y., Kondoh H., Kamachi Y. Adaptation of GAL4 activators for GAL4 enhancer trapping in zebrafish. Dev. Dyn. 2009;238:641–655. doi: 10.1002/dvdy.21863. [DOI] [PubMed] [Google Scholar]
- 27.Matsuda T., Cepko C.L. Controlled expression of transgenes introduced by in vivo electroporation. Proc. Natl Acad. Sci. U.S.A. 2007;104:1027–1032. doi: 10.1073/pnas.0610155104. [DOI] [PMC free article] [PubMed] [Google Scholar]
- 28.Krieg P.A., Melton D.A. Functional messenger RNAs are produced by SP6 in vitro transcription of cloned cDNAs. Nucleic Acids Res. 1984;12:7057–7070. doi: 10.1093/nar/12.18.7057. [DOI] [PMC free article] [PubMed] [Google Scholar]
- 29.Subedi A., Macurak M., Gee S.T., Monge E., Goll M.G., Potter C.J., Parsons M.J., Halpern M.E. Adoption of the Q transcriptional regulatory system for zebrafish transgenesis. Methods. 2014;66:433–440. doi: 10.1016/j.ymeth.2013.06.012. [DOI] [PMC free article] [PubMed] [Google Scholar]
- 30.Urasaki A., Morvan G., Kawakami K. Functional dissection of the Tol2 transposable element identified the minimal cis-sequence and a highly repetitive sequence in the subterminal region essential for transposition. Genetics. 2006;174:639–649. doi: 10.1534/genetics.106.060244. [DOI] [PMC free article] [PubMed] [Google Scholar]
- 31.Kwan K.M., Fujimoto E., Grabher C., Mangum B.D., Hardy M.E., Campbell D.S., Parant J.M., Yost H.J., Kanki J.P., Chien C.-B. The Tol2kit: a multisite gateway-based construction kit for Tol2 transposon transgenesis constructs. Dev. Dyn. 2007;236:3088–3099. doi: 10.1002/dvdy.21343. [DOI] [PubMed] [Google Scholar]
- 32.Bergeron S.A., Carrier N., Li G.H., Ahn S., Burgess H.A. Gsx1 expression defines neurons required for prepulse inhibition. Mol. Psychiatry. 2014 doi: 10.1038/mp.2014.106. doi:10.1038/mp.2014.106. [DOI] [PMC free article] [PubMed] [Google Scholar]
- 33.Bergeron S.A., Hannan M.C., Codore H., Fero K., Li G., Moak Z.B., Yokogawa T., Burgess H.A. Brain selective transgene expression in zebrafish using an NRSE derived motif. Front. Neural Circuits. 2012;6:110. doi: 10.3389/fncir.2012.00110. [DOI] [PMC free article] [PubMed] [Google Scholar]
- 34.Gingrich J.C., Davis D.R., Nguyen Q. Multiplex detection and quantitation of proteins on western blots using fluorescent probes. BioTechniques. 2000;29:636–642. doi: 10.2144/00293pf02. [DOI] [PubMed] [Google Scholar]
- 35.Krishnan K., Salomonis N., Guo S. Identification of Spt5 target genes in zebrafish development reveals its dual activity in vivo. PLoS One. 2008;3:e3621. doi: 10.1371/journal.pone.0003621. [DOI] [PMC free article] [PubMed] [Google Scholar]
- 36.Piloto S., Schilling T.F. Ovo1 links Wnt signaling with N-cadherin localization during neural crest migration. Development. 2010;137:1981–1990. doi: 10.1242/dev.048439. [DOI] [PMC free article] [PubMed] [Google Scholar]
- 37.Hamatani T., Carter M.G., Sharov A.A., Ko M.S.H. Dynamics of global gene expression changes during mouse preimplantation development. Dev. Cell. 2004;6:117–131. doi: 10.1016/s1534-5807(03)00373-3. [DOI] [PubMed] [Google Scholar]
- 38.Xie D., Chen C.-C., Ptaszek L.M., Xiao S., Cao X., Fang F., Ng H.H., Lewin H.A., Cowan C., Zhong S. Rewirable gene regulatory networks in the preimplantation embryonic development of three mammalian species. Genome Res. 2010;20:804–815. doi: 10.1101/gr.100594.109. [DOI] [PMC free article] [PubMed] [Google Scholar]
- 39.Hartl D., Irmler M., Römer I., Mader M.T., Mao L., Zabel C., de Angelis M.H., Beckers J., Klose J. Transcriptome and proteome analysis of early embryonic mouse brain development. Proteomics. 2008;8:1257–1265. doi: 10.1002/pmic.200700724. [DOI] [PubMed] [Google Scholar]
- 40.Pavlinkova G., Salbaum J.M., Kappen C. Maternal diabetes alters transcriptional programs in the developing embryo. BMC Genomics. 2009;10:274. doi: 10.1186/1471-2164-10-274. [DOI] [PMC free article] [PubMed] [Google Scholar]
- 41.Nakamura Y., Gojobori T., Ikemura T. Codon usage tabulated from international DNA sequence databases: status for the year 2000. Nucleic Acids Res. 2000;28:292. doi: 10.1093/nar/28.1.292. [DOI] [PMC free article] [PubMed] [Google Scholar]
- 42.Lowe T.M., Eddy S.R. tRNAscan-SE: a program for improved detection of transfer RNA genes in genomic sequence. Nucleic Acids Res. 1997;25:955–964. doi: 10.1093/nar/25.5.955. [DOI] [PMC free article] [PubMed] [Google Scholar]
- 43.Crooks G.E., Hon G., Chandonia J.-M., Brenner S.E. WebLogo: a sequence logo generator. Genome Res. 2004;14:1188–1190. doi: 10.1101/gr.849004. [DOI] [PMC free article] [PubMed] [Google Scholar]
- 44.Markham N.R., Zuker M. UNAFold: software for nucleic acid folding and hybridization. Methods Mol. Biol. 2008;453:3–31. doi: 10.1007/978-1-60327-429-6_1. [DOI] [PubMed] [Google Scholar]
- 45.Csuros M., Rogozin I.B., Koonin E.V. A detailed history of intron-rich eukaryotic ancestors inferred from a global survey of 100 complete genomes. PLoS Comput. Biol. 2011;7:e1002150. doi: 10.1371/journal.pcbi.1002150. [DOI] [PMC free article] [PubMed] [Google Scholar]
- 46.Castillo-Davis C.I., Mekhedov S.L., Hartl D.L., Koonin E.V., Kondrashov F.A. Selection for short introns in highly expressed genes. Nat. Genet. 2002;31:415–418. doi: 10.1038/ng940. [DOI] [PubMed] [Google Scholar]
- 47.Sharp P.M., Li W.H. The codon adaptation index - a measure of directional synonymous codon usage bias, and its potential applications. Nucleic Acids Res. 1987;15:1281–1295. doi: 10.1093/nar/15.3.1281. [DOI] [PMC free article] [PubMed] [Google Scholar]
- 48.Ponnala L. On finding poorly translated codons based on their usage frequency. Bioinformation. 2009;4:63–65. doi: 10.6026/97320630004063. [DOI] [PMC free article] [PubMed] [Google Scholar]
- 49.Iben J.R., Maraia R.J. tRNAomics: tRNA gene copy number variation and codon use provide bioinformatic evidence of a new anticodon:codon wobble pair in a eukaryote. RNA. 2012;18:1358–1372. doi: 10.1261/rna.032151.111. [DOI] [PMC free article] [PubMed] [Google Scholar]
- 50.Crick F.H. Codon–anticodon pairing: the wobble hypothesis. J. Mol. Biol. 1966;19:548–555. doi: 10.1016/s0022-2836(66)80022-0. [DOI] [PubMed] [Google Scholar]
- 51.Agris P.F., Vendeix F.A., Graham W.D. tRNA's wobble decoding of the genome: 40 years of modification. J. Mol. Biol. 2007;366:1–13. doi: 10.1016/j.jmb.2006.11.046. [DOI] [PubMed] [Google Scholar]
- 52.Burgess-Brown N.A., Sharma S., Sobott F., Loenarz C., Oppermann U., Gileadi O. Codon optimization can improve expression of human genes in Escherichia coli: a multi-gene study. Protein Expr. Purif. 2008;59:94–102. doi: 10.1016/j.pep.2008.01.008. [DOI] [PubMed] [Google Scholar]
- 53.Tuller T., Carmi A., Vestsigian K., Navon S., Dorfan Y., Zaborske J., Pan T., Dahan O., Furman I., Pilpel Y. An evolutionarily conserved mechanism for controlling the efficiency of protein translation. Cell. 2010;141:344–354. doi: 10.1016/j.cell.2010.03.031. [DOI] [PubMed] [Google Scholar]
- 54.Karlin S., Mrázek J. What drives codon choices in human genes. J. Mol. Biol. 1996;262:459–472. doi: 10.1006/jmbi.1996.0528. [DOI] [PubMed] [Google Scholar]
- 55.Burge C., Campbell A.M., Karlin S. Over- and under-representation of short oligonucleotides in DNA sequences. Proc. Natl Acad. Sci. U.S.A. 1992;89:1358–1362. doi: 10.1073/pnas.89.4.1358. [DOI] [PMC free article] [PubMed] [Google Scholar]
- 56.Brown C.M., Stockwell P.A., Trotman C.N.A., Tate W.P. Sequence analysis suggests that tetra-nucleotides signal the termination of protein synthesis in eukaryotes. Nucleic Acids Res. 1990;18:6339–6345. doi: 10.1093/nar/18.21.6339. [DOI] [PMC free article] [PubMed] [Google Scholar]
- 57.Poole E.S., Brown C.M., Tate W.P. The identity of the base following the stop codon determines the efficiency of in vivo translational termination in Escherichia coli. EMBO J. 1995;14:151–158. doi: 10.1002/j.1460-2075.1995.tb06985.x. [DOI] [PMC free article] [PubMed] [Google Scholar]
- 58.Jin H., Bjornsson A., Isaksson L.A. Cis control of gene expression in E.coli by ribosome queuing at an inefficient translational stop signal. EMBO J. 2002;21:4357–4367. doi: 10.1093/emboj/cdf424. [DOI] [PMC free article] [PubMed] [Google Scholar]
- 59.Lithwick G., Margalit H. Hierarchy of sequence-dependent features associated with prokaryotic translation. Genome Res. 2003;13:2665–2673. doi: 10.1101/gr.1485203. [DOI] [PMC free article] [PubMed] [Google Scholar]
- 60.Xia X. The +4G site in Kozak consensus is not related to the efficiency of translation initiation. PLoS One. 2007;2:e188. doi: 10.1371/journal.pone.0000188. [DOI] [PMC free article] [PubMed] [Google Scholar]
- 61.Goodman D.B., Church G.M., Kosuri S. Causes and effects of N-terminal codon bias in bacterial genes. Science. 2013;342:475–479. doi: 10.1126/science.1241934. [DOI] [PubMed] [Google Scholar]
- 62.Storz G. An RNA thermometer. Genes Dev. 1999;13:633–636. doi: 10.1101/gad.13.6.633. [DOI] [PubMed] [Google Scholar]
- 63.Nackley A.G., Shabalina S.A., Tchivileva I.E., Satterfield K., Korchynskyi O., Makarov S.S., Maixner W., Diatchenko L. Human catechol-O-methyltransferase haplotypes modulate protein expression by altering mRNA secondary structure. Science. 2006;314:1930–1933. doi: 10.1126/science.1131262. [DOI] [PubMed] [Google Scholar]
- 64.Spence R., Fatema M.K., Reichard M., Huq K.A., Wahab M.A., Ahmed Z.F., Smith C. The distribution and habitat preferences of the zebrafish in Bangladesh. J. Fish Biol. 2006;69:1435–1448. [Google Scholar]
- 65.Barrett L., Fletcher S., Wilton S. Regulation of eukaryotic gene expression by the untranslated gene regions and other non-coding elements. Cell. Mol. Life Sci. 2012;69:3613–3634. doi: 10.1007/s00018-012-0990-9. [DOI] [PMC free article] [PubMed] [Google Scholar]
- 66.Sandberg R., Neilson J.R., Sarma A., Sharp P.A., Burge C.B. Proliferating cells express mRNAs with shortened 3′ untranslated regions and fewer microRNA target sites. Science. 2008;320:1643–1647. doi: 10.1126/science.1155390. [DOI] [PMC free article] [PubMed] [Google Scholar]
- 67.Choi T., Huang M., Gorman C., Jaenisch R. A generic intron increases gene expression in transgenic mice. Mol. Cell. Biol. 1991;11:3070–3074. doi: 10.1128/mcb.11.6.3070. [DOI] [PMC free article] [PubMed] [Google Scholar]
- 68.Pfeiffer B.D., Ngo T.T., Hibbard K.L., Murphy C., Jenett A., Truman J.W., Rubin G.M. Refinement of tools for targeted gene expression in Drosophila. Genetics. 2010;186:735–755. doi: 10.1534/genetics.110.119917. [DOI] [PMC free article] [PubMed] [Google Scholar]
- 69.Moss S.P., Joyce D.A., Humphries S., Tindall K.J., Lunt D.H. Comparative analysis of teleost genome sequences reveals an ancient intron size expansion in the zebrafish lineage. Genome Biol. Evol. 2011;3:1187–1196. doi: 10.1093/gbe/evr090. [DOI] [PMC free article] [PubMed] [Google Scholar]
- 70.Louhichi A., Fourati A., Rebaï A. IGD: a resource for intronless genes in the human genome. Gene. 2011;488:35–40. doi: 10.1016/j.gene.2011.08.013. [DOI] [PubMed] [Google Scholar]
- 71.Chen C.-Y.A., Shyu A.-B. AU-rich elements: characterization and importance in mRNA degradation. Trends Biochem. Sci. 1995;20:465–470. doi: 10.1016/s0968-0004(00)89102-1. [DOI] [PubMed] [Google Scholar]
- 72.Haseloff J., Siemering K.R., Prasher D.C., Hodge S. Removal of a cryptic intron and subcellular localization of green fluorescent protein are required to mark transgenic Arabidopsis plants brightly. Proc. Natl Acad. Sci. U.S.A. 1997;94:2122–2127. doi: 10.1073/pnas.94.6.2122. [DOI] [PMC free article] [PubMed] [Google Scholar]
- 73.Kimchi-Sarfaty C., Oh J.M., Kim I.W., Sauna Z.E., Calcagno A.M., Ambudkar S.V., Gottesman M.M. A ‘silent’ polymorphism in the MDR1 gene changes substrate specificity. Science. 2007;315:525–528. doi: 10.1126/science.1135308. [DOI] [PubMed] [Google Scholar]
- 74.Shaner N.C., Lin M.Z., McKeown M.R., Steinbach P.A., Hazelwood K.L., Davidson M.W., Tsien R.Y. Improving the photostability of bright monomeric orange and red fluorescent proteins. Nat. Methods. 2008;5:545–551. doi: 10.1038/nmeth.1209. [DOI] [PMC free article] [PubMed] [Google Scholar]
- 75.Curado S., Anderson R.M., Jungblut B., Mumm J., Schroeter E., Stainier D.Y. Conditional targeted cell ablation in zebrafish: a new tool for regeneration studies. Dev. Dyn. 2007;236:1025–1035. doi: 10.1002/dvdy.21100. [DOI] [PubMed] [Google Scholar]
- 76.Nott A., Le Hir H., Moore M.J. Splicing enhances translation in mammalian cells: an additional function of the exon junction complex. Genes Dev. 2004;18:210–222. doi: 10.1101/gad.1163204. [DOI] [PMC free article] [PubMed] [Google Scholar]
- 77.Chatterjee S., Min L., Karuturi R.K., Lufkin T. The role of post-transcriptional RNA processing and plasmid vector sequences on transient transgene expression in zebrafish. Transgenic Res. 2010;19:299–304. doi: 10.1007/s11248-009-9312-x. [DOI] [PubMed] [Google Scholar]
- 78.Namy O., Hatin I., Rousset J.P. Impact of the six nucleotides downstream of the stop codon on translation termination. EMBO Rep. 2001;2:787–793. doi: 10.1093/embo-reports/kve176. [DOI] [PMC free article] [PubMed] [Google Scholar]
- 79.Hitoshi N., Ken-ichi Y., Jun-ichi M. Efficient selection for high-expression transfectants with a novel eukaryotic vector. Gene. 1991;108:193–199. doi: 10.1016/0378-1119(91)90434-d. [DOI] [PubMed] [Google Scholar]
- 80.McGrew L.L., Richter J.D. Translational control by cytoplasmic polyadenylation during Xenopus oocyte maturation: characterization of cis and trans elements and regulation by cyclin/MPF. EMBO J. 1990;9:3743–3751. doi: 10.1002/j.1460-2075.1990.tb07587.x. [DOI] [PMC free article] [PubMed] [Google Scholar]
- 81.Zanta-Boussif M.A., Charrier S., Brice-Ouzet A., Martin S., Opolon P., Thrasher A.J., Hope T.J., Galy A. Validation of a mutated PRE sequence allowing high and sustained transgene expression while abrogating WHV-X protein synthesis: application to the gene therapy of WAS. Gene Ther. 2009;16:605–619. doi: 10.1038/gt.2009.3. [DOI] [PubMed] [Google Scholar]
- 82.Drummond D.A., Bloom J.D., Adami C., Wilke C.O., Arnold F.H. Why highly expressed proteins evolve slowly. Proc. Natl Acad. Sci. U.S.A. 2005;102:14338–14343. doi: 10.1073/pnas.0504070102. [DOI] [PMC free article] [PubMed] [Google Scholar]
- 83.Dana A., Tuller T. Determinants of translation elongation speed and ribosomal profiling biases in mouse embryonic stem cells. PLoS Comput. Biol. 2012;8:e1002755. doi: 10.1371/journal.pcbi.1002755. [DOI] [PMC free article] [PubMed] [Google Scholar]
- 84.Stergachis A.B., Haugen E., Shafer A., Fu W., Vernot B., Reynolds A., Raubitschek A., Ziegler S., LeProust E.M., Akey J.M., et al. Exonic transcription factor binding directs codon choice and affects protein evolution. Science. 2013;342:1367–1372. doi: 10.1126/science.1243490. [DOI] [PMC free article] [PubMed] [Google Scholar]
- 85.Clarke T.F.t., Clark P.L. Rare codons cluster. PLoS One. 2008;3:e3412. doi: 10.1371/journal.pone.0003412. [DOI] [PMC free article] [PubMed] [Google Scholar]
- 86.Du S.J., Gong Z., Hew C.L., Tan C.H., Fletcher G.L. Development of an all-fish gene cassette for gene transfer in aquaculture. Mol. Mar. Biol. Biotechnol. 1992;1:290–300. [PubMed] [Google Scholar]
- 87.Bianchi M., Crinelli R., Giacomini E., Carloni E., Radici L., Magnani M. Yin Yang 1 intronic binding sequences and splicing elicit intron-mediated enhancement of ubiquitin C gene expression. PLoS One. 2013;8:e65932. doi: 10.1371/journal.pone.0065932. [DOI] [PMC free article] [PubMed] [Google Scholar]
- 88.Rose A.B. The effect of intron location on intron-mediated enhancement of gene expression in Arabidopsis. Plant J. 2004;40:744–751. doi: 10.1111/j.1365-313X.2004.02247.x. [DOI] [PubMed] [Google Scholar]
- 89.Stuart G.W., McMurray J.V., Westerfield M. Replication, integration and stable germ-line transmission of foreign sequences injected into early zebrafish embryos. Development. 1988;103:403–412. doi: 10.1242/dev.103.2.403. [DOI] [PubMed] [Google Scholar]
- 90.Biankin S.A., Collector M.I., Biankin A.V., Brown L.J., Kleeberger W., Devereux W.L., Zahnow C.A., Baylin S.B., Watkins D.N., Sharkis S.J., et al. A histological survey of green fluorescent protein expression in ‘green’ mice: implications for stem cell research. Pathology. 2007;39:247–251. doi: 10.1080/00313020701230807. [DOI] [PubMed] [Google Scholar]
- 91.Goll M.G., Anderson R., Stainier D.Y.R., Spradling A.C., Halpern M.E. Transcriptional silencing and reactivation in transgenic zebrafish. Genetics. 2009;182:747–755. doi: 10.1534/genetics.109.102079. [DOI] [PMC free article] [PubMed] [Google Scholar]
- 92.Kimura Y., Satou C., Higashijima S. V2a and V2b neurons are generated by the final divisions of pair-producing progenitors in the zebrafish spinal cord. Development. 2008;135:3001–3005. doi: 10.1242/dev.024802. [DOI] [PubMed] [Google Scholar]
Associated Data
This section collects any data citations, data availability statements, or supplementary materials included in this article.