


Abstract
The high-throughput sequencing of nuclease-protected mRNA fragments bound to ribosomes, a technique known as ribosome profiling, quantifies the relative frequencies with which different regions of transcripts are translated. This technique has revealed novel translation initiation sites with unprecedented scope and has furthered investigations into the connections between codon biases and translation rates. Yet the location of the codon being decoded in ribosome footprints is still unknown, and has been complicated by the recent observation of footprints with non-canonical lengths. Here we show how taking into account the variations in ribosome footprint lengths can reveal the ribosome aminoacyl (A) and peptidyl (P) site locations. These location assignments are in agreement with the proposed mechanisms for various ribosome pauses and further enhance the resolution of the profiling data. We also show that GC-rich motifs at the 5′ ends of footprints are found in yeast, calling into question the anti-Shine-Dalgarno effect's role in ribosome pausing.
INTRODUCTION
Protein production, one of the most fundamental biological processes, determines the ability of cells to adapt to their environments. Variations in gene expression allow a cell to modulate which proteins are produced, which in turn establishes the levels of key cellular actors. For example, bacteria have evolved intricately regulated protein synthesis and are able to complete the production of new protein within minutes of stimulation (1). Of the three stages of translation (initiation, elongation and termination), initiation rates are the primary determinants of protein abundance (2,3) and therefore have the largest impact on protein production. There is increasing evidence that differential translation ‘elongation’ influences the folding of nascent polypeptides (4–6), but the extent to which translation elongation is regulated, and how this regulation affects protein folding, is poorly understood.
Pioneering studies using the ribosome profiling technique have addressed key issues of translation by quantitatively sequencing nuclease-protected, ribosome-bound transcript fragments (7–9). The patterns underlying these ribosome ‘footprints’ give clues to nature of the forces behind translation elongation and the relationships between translation kinetics, cellular milieu and the genetic code. The canonical ribosome footprint was determined to be 28 nt long (10,11). As revealed by deep sequencing, however, there are small but substantial populations of footprints which are shorter (12). A priori, there is no clear way to compare footprints of different lengths and such differences obscure the exact position of a ribosome along a message. The extra nucleotides could conceivably occur at either end of the ribosome, an issue that remains unresolved.
Although ribosome profiling data have proven to be highly informative, the location of the codon being decoded within a footprint is still unclear. A growing body of evidence suggests that, under certain conditions, the translation of specific amino acids can impair ribosomal processivity, including proline (13,14), serine (8) and histidine (12). Prolines are thought to impair ribosome processivity during peptidyl transfer, whereas pausing at serine and histidine codons is the result of an increased delay while waiting for ternary complex at the A site. Yet other ribosome pausing, due to the anti-Shine-Dalgarno (aSD) effect (8,15), can presumably occur because of interactions outside the ribosome active site region and thereby require other mechanisms. The relative contributions of all these effects to ribosome pausing are unclear. We hypothesized that a better understanding of how the sequence of a footprint, which reports on the codons being translated, is related to the number of times it occurs in the sequencing library and therefore the pausing propensity, could give us insight into both the location of the ribosome A site and the determinants of ribosome pauses. To test this hypothesis, we analyzed published datasets, both from yeast and Escherichia coli.
MATERIALS AND METHODS
Computing codon frequencies
Briefly, using previously reported datasets, ribosome footprints were processed by determining where they align to the genome with Bowtie (16) and then categorized by length (in codons) using a Perl program. For each length category, the frequencies of codons at each position within the footprint were tabulated, where the position is defined relative to either the 5′ or 3′ end of the footprint. The resulting were structured as 64 2D matrices, where each matrix represents one of the 64 codons and each matrix position represents a codon of a particular footprint length and at a particular footprint position (Figure 1).
Figure 1.
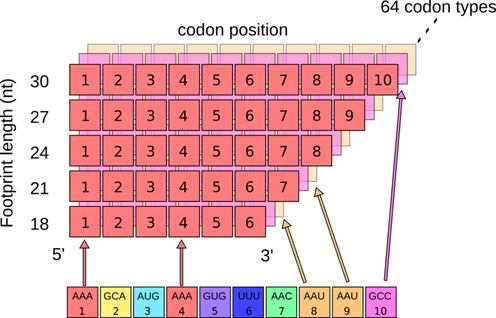
Statistical analysis of footprint codon composition. We count how many times each type of codon occurs in ribosome footprints, while keeping track of the position within the footprint as well as the length of the footprint. This information is stored in a matrix, where the color represents a type of codon and the number is the positioning away from the 3′ end of the footprint.
Computational processing of ribosome profiling sequencing libraries
Data obtained from E. coli cells grown in LB medium are from SRR364368 and SRR364370 (Gene Expression Omnibus (GEO) accession number GSE33671) (17). All other ribosome footprinting data for E. coli cells grown in 3-morpholinopropane-1-sulfonic acid (MOPS) medium come from SRR1067765, SRR1067766, SRR1067767 and SRR1067768 (GSE53767) (18). Yeast data were from cycloheximide datasets SRR1363415 and SRR1363416, untreated datasets SRR1363412-SRR1363414 and 3-AT datasets SRR1363420-SRR1363423 (GSE58321) (12) or SRR950450, SRR1040415, SRR1040423 and SRR1040427 for proline enrichment analysis (GSE50049) (19). Initial processing of the sequencing data was done largely as outlined previously (20). In detail, sequence read archive (SRA) files were converted to FASTQ files using SRA toolkit 2.3.2–5, program fastq-dump. Ends were trimmed using FASTX toolkit version 0.0.13.2, program fastx_clipper, using options -Q33 -a NNN -l 21 -c -n -v, where the sequence NNN was either CTGTAGGCACCATCAAT or AAAAAAAAAAAAAA, depending on the library preparation method.
A Bowtie library of rRNA and tRNA sequences was compiled and Bowtie 1.0.0 was used to remove these sequences from the trimmed fastq file with options –quiet -p 8 -l 23 –un = SRRxxxx.norrna.fq rrna_seqs -q SRRxxxx.trimmed.fq > /dev/null (where SRRxxxx is the input file name of the SRR dataset).
The remaining sequences were aligned using Bowtie against the E. coli MG1655 or Saccharomyces cerevisiae S288c reference genome with options -S -p 8 -l 21 –sam-nohead genome_name -q SRRxxxx.norrna.fq > SRRxxxx.aligned.SAM. Any unaligned reads were discarded using GNU grep version 2.18 by keeping only those lines not matching the pattern ‘XM:i:0’ (grep -v -E ‘XM:i:0’ SRRxxxx.aligned.SAM > SRRxxxx.matched.SAM). A merged file of multiple experimental replicates was then created using GNU cat version 8.21.
The SAM file was converted to a simplified file using a program executed by Perl version 5.18.2. Briefly, sequence mismatches relative to the genomic reference were corrected, based on the reasonable assumption that the majority of mismatches are due to sequencing errors and not to biological variability. These corrected sequences were grouped into sets of identical sequences and mapping positions, keeping track of their mapped genomic positions and the number of occurrences. A Perl program was used to discard reads which were not mapped within coding regions or were within 10 codons of the ends of coding regions. For calculations involving codons, frame was maintained either by adding and/or removing 0 or 1 nt at either end, or by shifting the sequence upstream 0, 1 or 2 nt and making the length a multiple of three. Sequences were then divided into sets of 3 nt, representing the in-frame codons and the codons at each position were tallied, keeping into account the total length of the sequence and the number of times the sequence occurred. The resulting tallies were normalized to percentages and output to a file aligned to either the 5′ or 3′ end. A similar procedure was used to compute nucleotide frequencies, except the footprints were neither divided into sets of triplets nor corrected for reading frame.
Computational processing of mRNA-seq sequencing libraries
SAM files were prepared from SRA files as above (SRR1067773 and SRR1067774, GEO # GSE53767) (18) or (SRR950758, SRR950896, SRR951829 and SRR1040263, GEO # GSE50049) (19). The entire lengths of the reads were aligned to their respective genes and the mean read density across all positions was taken to represent the expression level of a gene. Background mRNA codon frequencies were computed by counting the codons per gene and multiplying by the expression level, and then summing these tallies across all protein coding genes. Unlike Artieri et al. (14), codon-resolution read density corrections were not performed.
Hierarchical clustering of ribosomal footprint codon occupancies
Ribosome footprints were 3′-aligned and the footprint positions were summed across the length classes and normalized, such that, for any position, the sum of the values across all codons at that same position (column) equals 1. Hierarchical clustering of the data was performed using pvclust (21) in R 3.1.1, command pvclust(data, method.dist = ‘cor’, method.hclust = ‘average’, nboot = 100000). The absolute 5′ position, and any positions 12 codons or more from the 3′ end, were ignored to avoid effects from different footprint lengths as a result of the reported 5′ end biases.
GC content visualization of a sequence
To visualize the GC content over a particular sequence range, first the position-specific GC content, defined as 1 for G or C and 0 for A or U, was computed for the entire sequence. Next, a Savitzky-Golay smoothing algorithm, with window size 27 and polynomial degree 4, was applied to the resulting data to help visually discriminate between regions of high or low GC content. The algorithm was implemented in a Perl program.
Visualization of footprint ends over a gene using 2D heat maps
A pre-processed SAM file, with sequencing reads corrected to the genome and identical sequences and mapping positions merged and with the number of identical reads recorded, was scanned line by line and for each read a PTT file was scanned in parallel until a gene was found whose range contained the read mapped position. If a match was found, then the two endpoints were tracked, however many times the read occurred. The end result produces a separate file, for any gene with at least one mapped read, containing the locations of the endpoints for each mapped read as well as their occurrence numbers. These pairs of endpoints were then re-arranged in a two-dimensional (2D) tab-delimited text file, the position within the file (line and tab number) representing the footprint whose 3′ and 5′ ends spanned those regions. At each position in the text file, the number of footprint reads was recorded. Places with no reads were marked with a ‘-,’ and were considered missing when plotting with Gnuplot (version 4.6 patchlevel 3).
Source code
All source code is made available on the GitHub repository https://github.com/atmartens/ribosome_profiling.
RESULTS
LB induces serine pauses 4 codons from the 3′ end in E. coli
It was previously shown that, when grown in LB medium, E. coli ribosome footprints are more likely to contain serine codons than expected (8). This effect was attributed to a depletion of intracellular serine, and thus of aminoacylated tRNASer, due to the preferential metabolism of serine amino acids in the absence of other carbon sources. This mechanism is thought to slow ribosomes at the A site, because the low levels of aminoacylated tRNASer in the cell will cause the ribosome to pause while waiting until a cognate tRNA molecule arrives. We thus reasoned that the analysis of serine codon frequencies in ribosome footprints could reveal the location of the A site in E. coli.
To address this question, the frequencies of serine codons in footprints were calculated. As predicted, all six serine codons are enriched in ribosome footprints (Figure 2). Interestingly, we find that the enrichment is positioned relative to the 3′ end and not the 5′ end. The codon positions 3 through 5 upstream of the 3′ end are highly enriched in serine, with position 4 being the strongest. This result suggests that, in bacteria, the A site is located 4 positions from the 3′ end and that comparisons between ribosome footprints of different lengths require alignments relative to the 3′ end, but not the 5′ end.
Figure 2.
Escherichia coli cells grown in LB display serine enrichment in ribosome footprints. The point of greatest enrichment is 4 codons upstream from the 3′ end, regardless of footprint length, suggesting that longer E. coli footprints have extra sequence at the 5′ end of the ribosome. The codons to the left of the jagged line were looked up from the genome, revealing the sequences of shorter ribosomes prior to nuclease digestion.
Although the most obvious pattern in this dataset is the serine enrichment, we wondered if other codons might likewise have important position-specific biases. To address this question in an unbiased way, we used hierarchical clustering to groups codons by their position-specific enrichments. As expected, we find that all six serine codons cluster together, confirming the serine effect (Supplementary Figure S1) and no other codons exhibited position-specific biases as important as serine in these data.
Prolines can induce pausing in both yeast and bacteria
The incorporation of proline, an imino acid, into a nascent chain is potentially conformationally troublesome due to steric and other effects (13), a property which should affect all domains of life, as evidenced by the existence of special elongation factors for proline in both eukaryotes and bacteria (22–24). This snaring effect has both been measured in vitro, using stop-flow kinetics (13) and using ribosome profiling in yeast (14). Given that this effect is robust, we asked whether it could be used to calibrate the pause location in footprints of different lengths, thus giving an indication of where the ribosome P site was relative to the footprints.
We tallied the occurrences of proline codons at all positions in ribosome footprints, separated by footprint length (Figure 1) and normalized these frequencies by the background frequencies from a parallel mRNA-seq experiment (14). The resulting data can be visualized as a 2D heat map, where hotter colors represent enrichment in ribosome footprints relative to the mRNA background. We confirm that, as previously described in yeast, all four proline codons (CCN) are enriched (Figure 3). Overall, prolines are about 1.5–2.5-fold enriched, with CCA being the most and CCG the least (Figure 3). Furthermore, we find that longer ribosome footprints show similar codon frequencies as shorter footprints, if the footprints are aligned to the 5′ end. The positions which are most enriched in prolines are conserved between the lengths in vertical patterns. For example, proline codon CCA is most highly enriched 4 codons downstream the 5′ end and enrichment is less at the other positions. Since proline incorporation is thought to retard ribosome processivity at the P site, during peptidyl transfer (13), we infer that the greatest enrichment at position four indicates the P site location.
Figure 3.
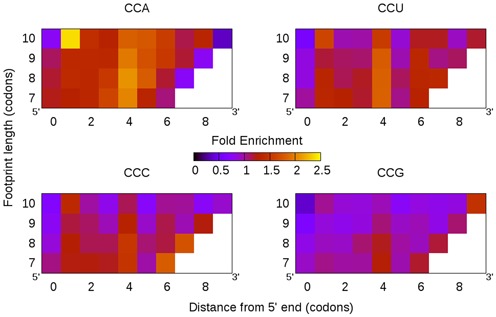
Prolines are enriched in yeast ribosome footprints. Comparing the frequencies of proline codons in mRNA to those in footprints, we find that all four proline codons are over-represented. In particular, the fourth position downstream from the footprint 5′ end is the most enriched, regardless of the length of the footprint, suggesting that yeast footprints align naturally to the 5′ end. Since ribosome stalling during proline incorporation takes place during peptidyl transfer, these data suggest the P site is located 4 codons downstream the 5′ end in yeast.
Curiously, a similar analysis of E. coli data does not reveal this trend. We find that, overall, proline frequencies in ribosome footprints, at any position and of any length, are similar to those in the mRNA background (Figure 4), suggesting either that proline incorporation in E. coli is not slow or that averaging all footprints together might mask the effect. We posited that individual E. coli genes, containing long proline repeats, do experience ribosome pauses. For example, the E. coli gene amiB has the longest stretch of consecutive proline codons (eight). Contrary to the absence of observed pausing for individual prolines, we do find that repeat prolines coincide with a dramatic ribosome pause (Figure 5), suggesting that, at least in extreme situations, prolines can also induce ribosome stalling in E. coli.
Figure 4.
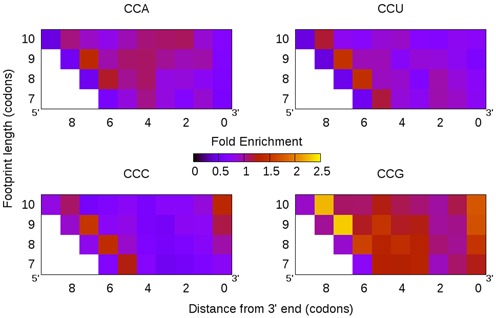
Although the proline codon CCG, and to a lesser extent CCA, is enriched in Escherichia coli footprints, the codons CCU and CCC are not.
Figure 5.
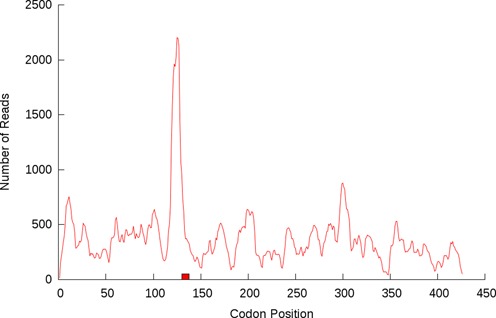
The Escherichia coli gene amiB has eight consecutive proline codons (box, codons 130 to 138) which coincide with a sharp rise in ribosome footprint density, suggesting that, at least in extreme cases, proline residues do retard translation.'
3-AT causes histidine enrichment at all positions
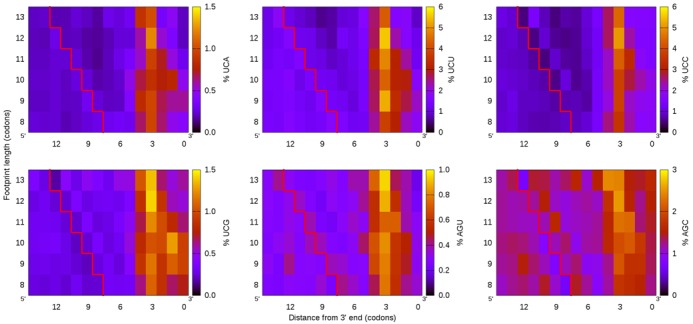
The small molecule 3-AT (3-amino-1,2,4-triazole) was previously shown to specifically inhibit the incorporation of histidines into nascent proteins by reducing the intracellular tRNAHis concentrations. The reduction in tRNA exclusively results in in the enrichment of histidine codons, but not other codons, in ribosome footprints (12). Since a reduction in tRNA will increase the time a ribosome waits at the A-site, whereto tRNA molecules diffuse randomly, we reasoned that a comparison of the histidine codon frequencies in ribosome footprints would reveal the location of the ribosome A site.
As before, the codons were tallied at all positions and categorized by ribosome footprints of different lengths. As shown previously, we find that histidine codons are enriched after 3-AT treatment, at nearly all positions, comprising a much higher fraction of the total number of codons in ribosome footprints than from untreated cells (Figure 6). Although the effect is not limited to a single position, the enrichment at the position 5 codons downstream from the 5′ end is slightly stronger than at other positions. Despite the weak signal, this position is the likeliest candidate of the A site, for it agrees with the proline data, which set the P site 4 codons downstream the 5′ end. Aligning the footprints to the 5′ end, as before, tends to conserve vertical enrichment patterns across footprints of different lengths, again suggesting that, in yeast, the additional mRNA in longer footprints extends from the 3′ end of the ribosome.
Figure 6.
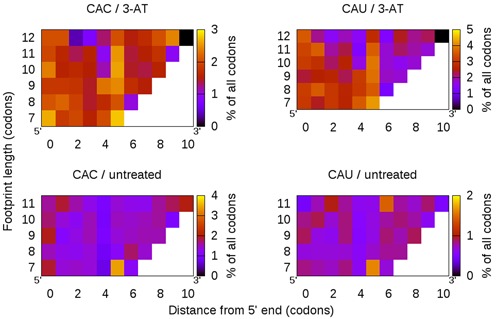
The depletion of intracellular tRNAHis using 3-AT causes a sharp increase in histidines in ribosome footprints (top) compared to untreated cells (bottom). Unlike the proline enrichment, which had a clear position-specific effect, this enrichment is more evenly spread across the length of the footprints. However, a strongly conserved vertical pattern of enrichment at position 5 might indicate the A site position.
GC-rich 5′ sequences are present both in yeast and E. coli
It was previously shown that E. coli and Bacillus subtilis, but not yeast, ribosome footprints have GC-rich 5′ ends (8) and that this effect correlates with footprint length (15). This effect has been explained by the interactions between G-rich mRNA and the C-rich rRNA (3′-CACCUCCU-5′), called the aSD effect, and is a ribosome pausing mechanism which happens away from the A, P or E sites. Given the previously discussed pausing effects, which do take place at the A or P sites, we asked how these different mechanisms contribute to ribosome pauses as measured by ribosome profiling experiments.
To address this question, we tallied the frequencies of all codons, both by position and by footprint length. The aSD model predicts that G-rich codons will be more present than other codons, specifically at the 5′ ends, in a length-dependent manner and will not be enriched in yeast. To see what sequences are ‘missing’ from the shorter footprints, these were extended to 45 nt by looking up the sequences from the genome and aligned to the 3′ end. According to the ‘inch-worm’ hypothesis (15), the aSD model predicts that longer footprints are able to fit inside the ribosome if they bind the rRNA more strongly, giving rise to a correlation between footprint length and 5′ G content. This hypothesis also predicts that, in E. coli, the sequence occurring immediately prior to ‘shorter’ footprints will not be high G, and that in yeast there should be no difference between the nucleotide content of the longer or shorter footprints.
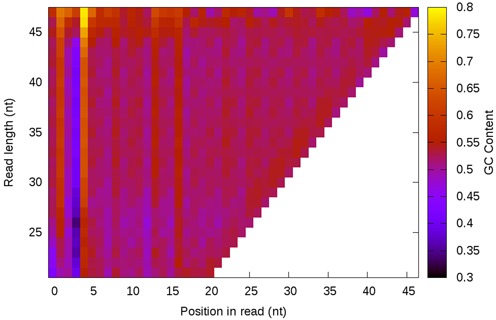
We confirm that E. coli ribosome footprints 5′ ends are G-rich and that this enrichment grows with footprint length (Figure 7). Furthermore, the extended 5′ regions of the shorter footprints are not enriched, supporting the aSD model. However, we notice that the extreme 5′ end position is GC-poor, an observation not predicted by the aSD model. In addition, an analysis of yeast ribosome profiling data also reveals GC-enriched sequence at the 5′ ends of longer footprints (Figure 8), which was not expected.
Figure 7.
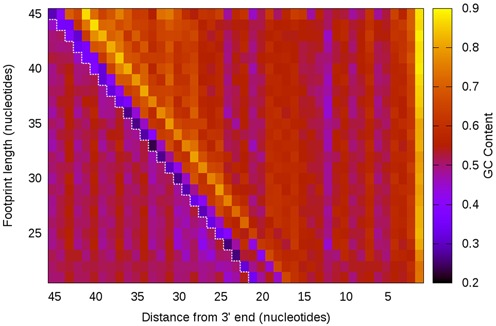
GC content analysis of Escherichia coli ribosome footprints. Footprints were categorized by length and each nucleotide position was measured for its average GC content across all footprints. Shorter footprints were extended to the 5′ end, revealing what the mRNA sequence was prior to nuclease digestion (red dashed line). We see that the 5′ and 3′ ends of footprints, regardless of length, have some strong GC biases. Furthermore, the longer footprints have increasingly high GC content downstream from the 5′ end.
Figure 8.
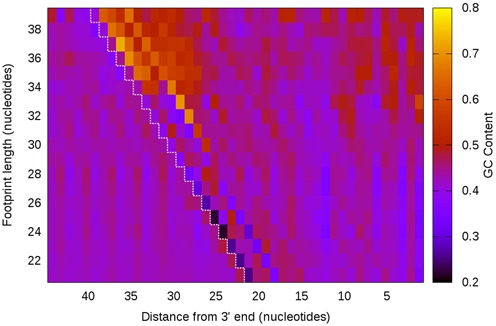
GC content analysis of yeast ribosome footprints.The yeast genome has a lower GC content than the Escherichia coli, as visible by the cooler colors. Nevertheless, we observe, as in E. coli, sequence biases at the ends of the footprints as well as a length-dependent increase in GC content downstream from the 5′ end.
We wondered if some of these nucleotide biases could be due to artifacts from the library preparation or sequencing processes. Nucleotide analyses of mRNA-seq data show how the library-generation process for both mRNA-seq and ribosome profiling do cause nucleotide-level GC biases, but that these 5′ end GC enriched sequences are distinct from the biases observed in the mRNA-seq data (Figure 9). Therefore, a process specific to ribosome profiling likely imparts specific nucleotide biases in the sequencing data.
Figure 9.
GC content analysis of mRNA seq data. To better understand the sequence biases noticed in the ribosome footprinting data, they were compared to mRNA-seq data, which underwent many of the same steps but fundamentally report on different biological phenomena. We find that these data have nucleotide biases near the 5′ ends of the reads, but that there is little to no GC enrichment in a length-dependent manner.
Visualizing footprint densities as a function of read length
The relationships between sequence composition and footprint length demonstrate the importance of accurately visualizing footprint density across transcripts. Given the potential for ambiguity in the comparison of footprints of different lengths, we have developed a graphical method for simultaneously displaying footprint density, along a transcript, of all different lengths. Importantly, this method allows us to interrogate the relationships between ribosome density and mRNA sequence of individual genes, thereby avoiding the problems associated with genome-wide averaging of the sequencing data, as shown above.
For example, we highlight a region within the E. coli gene rpsA, which encodes a highly-expressed protein component of the small ribosome subunit. By plotting the footprint coordinate endpoints on the x and y axes, and the read number as a heat map, we can see how footprint length heterogeneity varies across a gene (Figure 10). Remarkably, we find that regions of low footprint density correlate with low GC regions, exactly as seen in the previous analysis of total ribosome footprints. The nucleotide biases at the ends are also apparent: footprints tend to be GC-poor at either extremity, regardless of length. Similarly, using this method we can see how the peak in read density along the E. coli gene amiB coincides with the eight consecutive proline codons and how these footprints have a slightly altered length profile compared to those from the rest of the gene, a feature which would have remained hidden with more conventional plots.
Figure 10.
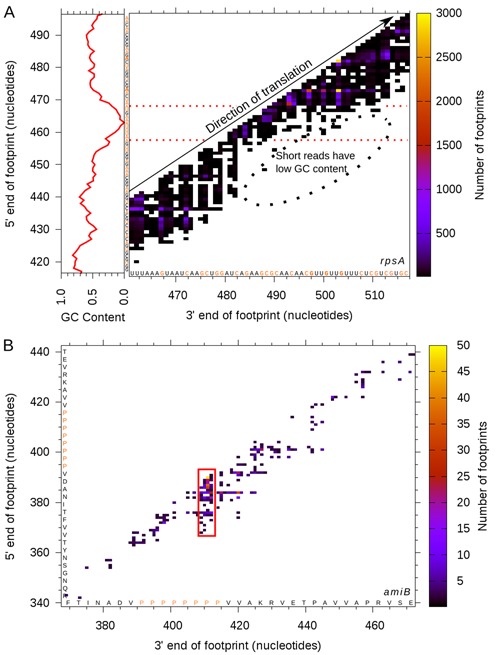
Plotting ribosome footprints by tracking the 3′ and 5′ end coordinates and displaying the read count using a heat map. (A) A section of the highly-expressed Escherichia coli gene rpsA shows areas of high and low sequence coverage, indicating which parts of the transcript have, on average, more or less ribosome density. Using the footprint length information juxtaposed with the average GC content, we can see how there is a strong relationship between the read length and the 5′ GC content. (B) The lower expression level of the gene amiB is reflected by a lot of empty space, but clearly the peak of reads at the eight consecutive prolines stands out.
DISCUSSION
Understanding footprint length differences through position-specific codon frequencies
The principle underlying the ribosome profiling technique is the protection of mRNA from nuclease by the ribosome. Though a typical footprint is 28 nt long, recent evidence has demonstrated that many footprints are longer or shorter. For example, ribosomes which halt at truncated mRNA molecules lack sequence at their 5′ ends, producing ∼15 nt footprints (25). Footprint length heterogeneity has also been associated with different conformations of the ribosome, which can be preferentially selected through the use of small molecule inhibitors of translation elongation (12). Furthermore, the distribution of sequencing read lengths has been used to distinguish between true ribosome footprints and other nucleic acids, such as mRNA or rRNA which is protected from nuclease treatment by non-ribosomal molecular complexes and which therefore do not constitute true ribosome footprints (26). The mechanism by which elongation inhibitors generate footprint length heterogeneity is unknown and these length differences complicate the analysis of ribosome footprinting data: a priori, there is no default way to compare two footprints of different lengths.
Without any further information, it is conceivable that footprints should be aligned to the 5′ end, to the 3′ end, somewhere in between, or that no single alignment is correct. We have empirically found that aligning yeast footprints to the 5′ end preserves the same position-specific codon frequency differences between the different lengths and agrees with previously reported alignment methods in yeast (12). Crucially, two steps of translation, which take place at either the A or P sites and are located one codon apart, are found to cause codon enrichments which are also one codon apart. The distinct mechanistic explanations for these two types of pauses agree with our knowledge of ribosome structure. This agreement is particularly compelling given that the experiments were peformed independently and confirms that ribosome profiling is sensitive enough to detect these types of translation rate differences.
This alignment places the ribosomal P site 4 codons downstream the 5′ end of the footprint and the A site 5 codons away. Longer footprints thus appear to, on average, have extra mRNA at the 3′ end. E. coli footprints, however, align to the 3′ end, as demonstrated by the sharp serine enrichments 4 codons upstream from the 3′ end; the explanation of this difference remains unclear, but suggests that, unlike in yeast, additional mRNA extends past the 5′ end of the mRNA and that different computational methods need to be applied when examining eukaryotic or bacterial datasets.
Sequencing longer footprints to distinguish artifacts from biological mechanism
In addition to the aforementioned position-specific codon biases in footprints, which we can attribute to specific steps during protein synthesis, we also find, as previously reported (14,27), that sequencing data contain substantial GC biases, only some of which are shared between mRNA-seq data and ribosome profiling data. Although these biases are problematic because they complicate the estimates of true molecular levels, in principle it should be possible to partially correct for over- or under-representation of ribosome footprints by using the mRNA-seq data as a reference (14). However, we also notice biases present in the ribosome profiling data, both in yeast and in E. coli, which are absent from the mRNA-seq data. These biases could either be due to library generation steps unique to ribosome profiling or to true translation events. For instance, the 5′ ends of footprints are GC-rich, while the ends of mRNA sequencing reads show no such bias. This type of 5′ enrichment was previously attributed to the aSD effect in E. coli (8,15), but the same effect is also present in yeast, calling into question the hypothesis.
The efficiencies of several in vitro processing steps, such as linker ligation, reverse transcription or polymerase chain reaction, could be impacted by terminal sequence composition. However, these three steps were also used when generating the mRNA-seq data. The defining step during ribosome profiling experiments, which is absent from other sequencing experiments, is the treatment of the sample with nuclease (7). Given that nucleases tend to cut GC-poor sequences (28,29), rather than GC-rich sequence, we propose that longer ribosome footprints result from incomplete nuclease digestion at mRNA 5′ ends. This was hinted at using experiments looking at ribosome stacking on a single bovine transcript, where lesser nuclease treatment revealed longer footprints (11), and could easily be tested by performing ribosome profiling experiments with variable nuclease treatments. If nuclease sensitivity explains footprint length heterogeneity, it would also suggest that different ribosome conformations, such as those induced by small molecule inhibitors of translation (12), have different nuclease susceptibilities. Likewise, the length differences of ‘contaminant’ sequences could be explained by variable nuclease susceptibility in these other molecular complexes (26).
The possible role library generation plays in introducing sequence biases highlights some key steps of the ribosome profiling methodology which must be carried out carefully, lest the data become skewed or misinterpreted. Although a canonical footprint is 28 nt in length, in practice we observe footprints as long as 45 nt. This means that sequencing reads should be at least 50 nt long and that the gel purification of size-selected fragments should likewise include longer molecules. Omitting these precautions will result in the under-representation of GC-rich sequences in the final datasets and might explain why GC-rich 5′ footprint ends were not noticed in the original yeast studies.
SUPPLEMENTARY DATA
Supplementary Data are available at NAR Online.
Acknowledgments
We thank James Wrabl and Jordan White for reading the manuscript.
FUNDING
National Institutes of Health (NIH) [R01-GM63747 to V.J.H.], [Cellular and Molecular Biology graduate student training grant 2T32 GM007231 to A.T.M.]. Funding for open access charge: NIH [R01-GM63747 to V.J.H.].
Conflict of interest statement. None declared.
REFERENCES
- 1.Schleif R., Hess W., Finkelstein S., Ellis D. Induction kinetics of the L-arabinose operon of Escherichia coli. J. Bacteriol. 1973;115:9–14. doi: 10.1128/jb.115.1.9-14.1973. [DOI] [PMC free article] [PubMed] [Google Scholar]
- 2.Mathews M.B., Sonenberg N., Hershey J.W.B. Origins and principles of translational control. In: Matthews MB, Sonenberg N, Hershey JWB, editors. Translational Control in Biology and Medicine. Cold Spring Harbor, NY: Cold Spring Harbor Laboratory Press; 2007. pp. 1–40. [Google Scholar]
- 3.Schwanhäusser B., Busse D., Li N., Dittmar G., Schuchhardt J., Wolf J., Chen W., Selbach M. Global quantification of mammalian gene expression control. Nature. 2011;473:337–342. doi: 10.1038/nature10098. [DOI] [PubMed] [Google Scholar]
- 4.Siller E., DeZwaan D.C., Anderson J.F., Freeman B.C., Barral J.M. Slowing bacterial translation speed enhances eukaryotic protein folding efficiency. J. Mol. Biol. 2010;396:1310–1318. doi: 10.1016/j.jmb.2009.12.042. [DOI] [PubMed] [Google Scholar]
- 5.Spencer P.S., Siller E., Anderson J.F., Barral J.M. Silent substitutions predictably alter translation elongation rates and protein folding efficiencies. J. Mol. Biol. 2012;422:328–335. doi: 10.1016/j.jmb.2012.06.010. [DOI] [PMC free article] [PubMed] [Google Scholar]
- 6.Marin M. Folding at the rhythm of the rare codon beat. Biotechnol. J. 2008;3:1047–1057. doi: 10.1002/biot.200800089. [DOI] [PubMed] [Google Scholar]
- 7.Ingolia N.T., Ghaemmaghami S., Newman J.R.S., Weissman J.S. Genome-wide analysis in vivo of translation with nucleotide resolution using ribosome profiling. Science. 2009;324:218–223. doi: 10.1126/science.1168978. [DOI] [PMC free article] [PubMed] [Google Scholar]
- 8.Li G.-W., Oh E., Weissman J.S. The anti-Shine-Dalgarno sequence drives translational pausing and codon choice in bacteria. Nature. 2012;484:538–541. doi: 10.1038/nature10965. [DOI] [PMC free article] [PubMed] [Google Scholar]
- 9.Ingolia N.T., Lareau L.F., Weissman J.S. Ribosome profiling of mouse embryonic stem cells reveals the complexity and dynamics of mammalian proteomes. Cell. 2011;147:789–802. doi: 10.1016/j.cell.2011.10.002. [DOI] [PMC free article] [PubMed] [Google Scholar]
- 10.Steitz J.A. Polypeptide chain initiation: nucleotide sequences of the three ribosomal binding sites in bacteriophage R17 RNA. Nature. 1969;224:957–964. doi: 10.1038/224957a0. [DOI] [PubMed] [Google Scholar]
- 11.Wolin S.L., Walter P. Ribosome pausing and stacking during translation of a eukaryotic mRNA. EMBO J. 1988;7:3559–3569. doi: 10.1002/j.1460-2075.1988.tb03233.x. [DOI] [PMC free article] [PubMed] [Google Scholar]
- 12.Lareau L.F., Hite D.H., Hogan G.J., Brown P.O. Distinct stages of the translation elongation cycle revealed by sequencing ribosome-protected mRNA fragments. Elife. 2014;3:e01257. doi: 10.7554/eLife.01257. [DOI] [PMC free article] [PubMed] [Google Scholar]
- 13.Pavlov M.Y., Watts R.E., Tan Z., Cornish V.W., Ehrenberg M., Forster A.C. Slow peptide bond formation by proline and other N-alkylamino acids in translation. Proc. Natl. Acad. Sci. U.S.A. 2009;106:50–54. doi: 10.1073/pnas.0809211106. [DOI] [PMC free article] [PubMed] [Google Scholar]
- 14.Artieri C.G., Fraser H.B. Accounting for biases in riboprofiling data indicates a major role for proline in stalling translation. Genome Res. 2014;24:2011–2021. doi: 10.1101/gr.175893.114. [DOI] [PMC free article] [PubMed] [Google Scholar]
- 15.O'Connor P.B.F., Li G.-W., Weissman J.S., Atkins J.F., Baranov P. V. rRNA:mRNA pairing alters the length and the symmetry of mRNA-protected fragments in ribosome profiling experiments. Bioinformatics. 2013;29:1488–1491. doi: 10.1093/bioinformatics/btt184. [DOI] [PMC free article] [PubMed] [Google Scholar]
- 16.Langmead B., Trapnell C., Pop M., Salzberg S.L. Ultrafast and memory-efficient alignment of short DNA sequences to the human genome. Genome Biol. 2009;10:R25. doi: 10.1186/gb-2009-10-3-r25. [DOI] [PMC free article] [PubMed] [Google Scholar]
- 17.Oh E., Becker A.H., Sandikci A., Huber D., Chaba R., Gloge F., Nichols R.J., Typas A., Gross C.A., Kramer G., et al. Selective ribosome profiling reveals the cotranslational chaperone action of trigger factor in vivo. Cell. 2011;147:1295–1308. doi: 10.1016/j.cell.2011.10.044. [DOI] [PMC free article] [PubMed] [Google Scholar]
- 18.Li G.-W., Burkhardt D., Gross C., Weissman J.S. Quantifying absolute protein synthesis rates reveals principles underlying allocation of cellular resources. Cell. 2014;157:624–635. doi: 10.1016/j.cell.2014.02.033. [DOI] [PMC free article] [PubMed] [Google Scholar]
- 19.Artieri C.G., Fraser H.B. Evolution at two levels of gene expression in yeast. Genome Res. 2014;24:411–421. doi: 10.1101/gr.165522.113. [DOI] [PMC free article] [PubMed] [Google Scholar]
- 20.Ingolia N.T., Brar G.a, Rouskin S., McGeachy A.M., Weissman J.S. Genome-wide annotation and quantitation of translation by ribosome profiling. Curr. Protoc. Mol. Biol. 2013 doi: 10.1002/0471142727.mb0418s103. doi:10.1002/0471142727.mb0418s103. [DOI] [PMC free article] [PubMed] [Google Scholar]
- 21.Suzuki R., Shimodaira H. Pvclust: an R package for assessing the uncertainty in hierarchical clustering. Bioinformatics. 2006;22:1540–1542. doi: 10.1093/bioinformatics/btl117. [DOI] [PubMed] [Google Scholar]
- 22.Ude S., Lassak J., Starosta A.L., Kraxenberger T., Wilson D.N., Jung K. Translation elongation factor EF-P alleviates ribosome stalling at polyproline stretches. Science. 2012;339:82–85. doi: 10.1126/science.1228985. [DOI] [PubMed] [Google Scholar]
- 23.Doerfel L.K., Wohlgemuth I., Kothe C., Peske F., Urlaub H., Rodnina M. V. EF-P is essential for rapid synthesis of proteins containing consecutive proline residues. Science. 2012;339:85–88. doi: 10.1126/science.1229017. [DOI] [PubMed] [Google Scholar]
- 24.Gutierrez E., Shin B.-S., Woolstenhulme C.J., Kim J.-R., Saini P., Buskirk A.R., Dever T.E. eIF5A promotes translation of polyproline motifs. Mol. Cell. 2013;51:35–45. doi: 10.1016/j.molcel.2013.04.021. [DOI] [PMC free article] [PubMed] [Google Scholar]
- 25.Guydosh N.R., Green R. Dom34 rescues ribosomes in 3′ untranslated regions. Cell. 2014;156:950–962. doi: 10.1016/j.cell.2014.02.006. [DOI] [PMC free article] [PubMed] [Google Scholar]
- 26.Ingolia N.T., Brar G.A., Stern-Ginossar N., Harris M.S., Talhouarne G.J.S., Jackson S.E., Wills M.R., Weissman J.S. Ribosome profiling reveals pervasive translation outside of annotated protein-coding genes. Cell Rep. 2014;8:1365–1379. doi: 10.1016/j.celrep.2014.07.045. [DOI] [PMC free article] [PubMed] [Google Scholar]
- 27.Hansen K.D., Brenner S.E., Dudoit S. Biases in Illumina transcriptome sequencing caused by random hexamer priming. Nucleic Acids Res. 2010;38:e131. doi: 10.1093/nar/gkq224. [DOI] [PMC free article] [PubMed] [Google Scholar]
- 28.Hörz W., Altenburger W. Sequence specific cleavage of DNA by micrococcal nuclease. Nucleic Acids Res. 1981;9:2643–2658. doi: 10.1093/nar/9.12.2643. [DOI] [PMC free article] [PubMed] [Google Scholar]
- 29.Dingwall C., Lomonossoff G.P., Laskey R.A. High sequence specificity of micrococcal nuclease. Nucleic Acids Res. 1981;9:2659–2673. doi: 10.1093/nar/9.12.2659. [DOI] [PMC free article] [PubMed] [Google Scholar]
Associated Data
This section collects any data citations, data availability statements, or supplementary materials included in this article.