


Abstract
Recent studies have suggested that long non-coding RNAs (lncRNAs) can interact with microRNAs (miRNAs) and indirectly regulate miRNA targets though competing interactions. However, the molecular mechanisms underlying these interactions are still largely unknown. In this study, these lncRNA–miRNA–gene interactions were defined as lncRNA-associated competing triplets (LncACTs), and an integrated pipeline was developed to identify lncACTs that are active in cancer. Competing lncRNAs had sponge features distinct from non-competing lncRNAs. In the lncACT cross-talk network, disease-associated lncRNAs, miRNAs and coding-genes showed specific topological patterns indicative of their competence and control of communication within the network. The construction of global competing activity profiles revealed that lncACTs had high activity specific to cancers. Analyses of clustered lncACTs revealed that they were enriched in various cancer-related biological processes. Based on the global cross-talk network and cluster analyses, nine cancer-specific sub-networks were constructed. H19- and BRCA1/2-associated lncACTs were able to discriminate between two groups of patients with different clinical outcomes. Disease-associated lncACTs also showed variable competing patterns across normal and cancer patient samples. In summary, this study uncovered and systematically characterized global properties of human lncACTs that may have prognostic value for predicting clinical outcome in cancer patients.
INTRODUCTION
In recent years, transcripts that do not code for proteins have been identified by large-scale genomic studies (1–4). These non-coding RNAs (ncRNAs) can be broadly classified as small ncRNAs (< 200 nucleotides, including microRNAs, siRNAs and piRNAs) and long non-coding (lncRNAs) (> 200 nucleotides). MicroRNAs (miRNAs), the most widely studied subclass of small ncRNAs, act at the post-transcriptional level by destabilizing and repressing target mRNAs via the miRNA-induced silencing complex (5). MiRNAs have been implicated in various human diseases, including cancer (6). In contrast, only a small number of human lncRNAs have been functionally characterized; these are known to be involved in a wide range of biological functions (7–9), such as chromatin modification (10), the regulation of cell apoptosis and invasion (11), reprogramming of induced pluripotent stem cells (12) and genomic imprinting (13). In addition, lncRNAs can function as oncogenes (14) or tumor suppressors (15) in the development of human cancers.
Recent studies have reported that lncRNAs can participate in competing endogenous RNAs (ceRNAs) regulations in order to communicate with other RNA transcripts (16–18). By sharing common miRNA-binding sites with mRNAs, lncRNAs compete with miRNA target genes for miRNA molecules, thereby relieving miRNA-mediated target repression. This type of lncRNA-associated competing triplets (lncACTs), which is a subclass of ceRNAs, has been widely observed in human and several other species (19). For example, the lncRNA HULC has been shown to play an important role in tumorigenesis (20) by acting as an endogenous sponge to inhibit miR-372 in liver cancer and reducing miR-372-mediated translational repression of PRKACB (21). Additionally, the pseudogene PTENP1 competes with its coding counterpart, the tumor-suppressor PTEN, for a set of miRNAs (22). The muscle-specific lncRNA linc-MD1 regulates the timing of muscle differentiation by sequestering miR-133 and modulating the expression of MAML1 and MEF2C (23). In Arabidopsis, the overexpression of the lncRNA IPS1 increases PHO2 expression by competing for miR-399 binding (24).
Recently, a ceRDB resource listing potential MRE-containing genes that act as miRNA sponges has been developed (25), although ceRNAs in this database are limited to mRNAs. Other investigators generated a lncRNA-associated ceRNA network based on microarray data from gastric cancer, which was validated for six additional types of cancer (26). Another study proposed that a competitive interaction network of RNAs in glioblastoma mediates cross-talk between canonical oncogenic pathways (27). Data sets obtained from high-throughput bioinformatics analyses have been integrated to predict miRNA–lncRNA interactions; for instance, miRcode predicts human miRNA targets based on lncRNAs in the GENCODE project (28) using the targetscan prediction algorithm, while Linc2GO identified miRNA–lncRNA interactions using miRanda and predicted lncRNA function based on the ceRNA hypothesis (29). However, traditional prediction methods often have a high false positive rate. This was circumvented in DIANA-LncBase by integrating AGO CLIP-Seq data into the miRNA–lncRNA identification pipeline (30). This database provides experimentally verified and computationally predicted miRNA targets on lncRNAs. By integrating Ago CLIP-supported miRNA targets and the hypergeometric test method, starBase v.2.0 applies ceRNAFunction web tools to predict the function of ncRNAs and provides Pan-Cancer ceRNA networks (31). Another lncRNA-associated ceRNA database, lnCeDB, provides tissue-specific information on ceRNAs but contains only a small number of AGO CLIP-supported interactions (32). The cross-species ceRNA database HumanViCe has been established to investigate the cross-talk between host and viral miRNAs involved in viral pathogenesis (33). This framework identified not only ceRNA-related lncRNAs but also circular RNAs. Studies on lncRNA-associated ceRNAs can allow the function of lncRNAs involved in different biological processes to be investigated (29,31). However, these resources have thus far provided only a limited understanding, and the ceRNA hypothesis remains controversial (34,35). Additional resources and research are needed to address the conflicting theories on the mechanisms of ncRNA regulation.
This study systematically identified 5119 functional lncRNA-associated lncACTs through an integrated pipeline with which a comprehensive lncACT cross-talk network was constructed. Specific topological patterns were observed within the disease-associate nodes of the network. LncRNAs from the network were found to have intrinsic miRNA sponge properties as evidenced by transcript size, exon number, expression level and density of miRNA target sites than other lncRNAs. The global competing activity profile enabled an examination of the competitive function of lncACTs and their variability in different cancer types. The majority of lncACTs exhibited competitive activity that was highly specific to a cancer. So-called guilt-by-association functional analyses identified lncACT clusters enriched in cancer-related Gene Ontology (GO) terms and Kyoto Encyclopedia of Genes and Genomes (KEGG) pathways. An evaluation of the expression and competing activities of candidate lncACTs showed that those related to cancer had variable patterns in samples from cancer and matched normal patients. An online database to store and retrieve all lncACTs data, which is available at http://www.bio-bigdata.net/LncACTdb/, provides additional information that can facilitate the study of lncACTs and lncRNA function.
MATERIALS AND METHODS
Data
LncRNA and miRNA annotation and sequence data sets
To construct a comprehensive lncRNA data set for further study, we relied on the non-coding classification of GENCODE, which combines the HAVANA manual annotation and Ensembl automatic annotation pipelines, to achieve an accurate and completely annotated human genome (36). We considered transcript lengths of longer than 200 nt and types of ‘antisense’, ‘non-coding’, ‘processed_transcript’ and ‘lincRNA’ as lncRNAs. This strategy has been used in starBaseV2.0, to define lncRNA transcripts (31), and in a previous study to identify lncRNA genes from The Cancer Genome Atlas (TCGA) sequencing data (37). Cancer name abbreviations of TCGA were listed in Supplementary Table S1. The GENCODE (Aug, 2014) annotation file, in GTF format, was used in this step. Original Ensembl transcript names were used as identifiers for different lncRNAs. LncRNA sequences were obtained from the Ensembl database (GRCH37) (38). The data set contained a total of 9532 lncRNA genes. Human mature miRNA sequences were downloaded from miRBase (release 21) (39); this data set consisted of 2588 mature miRNA sequences.
Experimentally validated miRNA targets and disease-associated genes
Human miRNAs and their targets were downloaded from TarBase (v6.0) (40) and mirTarBase (release 4.5) (41), two reliable online miRNA reference databases that store manually curated collections of experimentally supported miRNA targets. After combining data sets, 43 497 validated non-redundant human miRNA-target pairs were assembled for this study. Experimental interactions between miRNAs and lncRNAs were identified in starBase v2.0 (31) and DIANA-LncBase (30), which provided high-throughput HITS- and PAR-CLIP experimental data as well as the most current in silico target predictions. Disease-associated lncRNAs, miRNAs and coding genes mapping to the global lncACT network were derived from LncRNADisease (42), National Cancer Institute and HMDD (43) databases.
Normal and cancer expression data
We recalculated reads per kilobases per million reads (RPKM) values for the coding/lncRNA genes considered in the study: RPKM = (raw read counts × 10∧9)/(total reads × length of lncRNA/coding genes); with raw read counts = sum of raw read counts in all exons mapped entirely within the lncRNA/coding gene loci; total reads = sum of raw read counts calculated for all exons of a single sample. To avoid ambiguous exon mapping for clusters of overlapping transcripts, we merged overlapping transcripts into a single candidate transcript. Taking into account the TCGA publication embargo, we took only the RNA-seq V2 data for the cancers without publication restrictions. Raw read counts for each exon were derived from exon_quantification files provided by the TCGA level 3 data set. Annotation of exons mapping to coding/lncRNA genes was derived from GENCODE. To evaluate the accuracy of our recalculated RPKM values, we compared our data with Akrami et al.'s study (37), which identified 19 999/10 419 coding/lncRNA genes in TCGA OV and UCEC cancers (available at http://www.larssonlab.org/tcga-lncrnas/). Their RPKM values were calculated using TCGA raw RNA-seq sequence libraries in BAM format. Our recalculated RPKM values were plotted against the true RPKM values, calculated by Akrami et al. (Supplementary Figure S1). High linear correlation was observed between recalculated RPKM and true RPKM values for both OV (R2 > 0.92) and UCEC (R2 > 0.95) data sets. These studies provide compelling evidence for the excellent accuracy of our pipeline in the quantification of gene expression. Illumina RNA (IlluminaHiSeq_RNASeqV2) and miRNA (IlluminaHiSeq_miRNASeq) sequencing data for 12 types of human cancer (Supplementary Table S1) were obtained from TCGA (level 3, version Dec, 2012) through Data Portal (44). Samples with clinical follow-up information were retained for further analysis. LncRNAs identified and used in this work was listed in Supplementary Table S2.
Methods
Integrative approach for identifying miRNA–lncRNA–gene interactions
MiRNA target prediction methods and restrictive criteria (26,30–32) were applied to filter functional miRNA–lncRNA interactions for constructing the competing network. Functional lncACTs were identified through an integrated pipeline by incorporating seed sequence matching (27), CLIP-Seq data filtering (30), the stringent expression correlation model (27) and experimental evidence. Previous studies have shown that lncRNAs can act as miRNA sponges by competing with endogenous mRNAs for miRNA binding (19,21,22), an interaction that can be identified using traditional miRNA target prediction methods (28,29,45). Other studies have integrated different prediction methods to identify functional miRNA–lncRNA pairs (21,46). As a first step, candidate miRNA–lncRNA interactions were predicted using TargetScan (v.6.0) (47), PITA (March 2007 version) (48), miRanda (Nov. 2010 version) (49) and RNAhybrid (v.2.1.1) (50) with default parameters. To maintain accuracy and consistency, the different methods were applied to the same miRNA and lncRNA data set. The number of miRNA–lncRNA interactions resulting from the four prediction methods differed significantly (Figure 1 and Supplementary Figure S2). To select bona fide targets, 4 625 625 miRNA–lncRNA interactions identified using the four methods were integrated into a comprehensive data set. This strategy has been used by previous studies to enlarge the pool of functional miRNA–target interactions (51,52). A comparative analysis (Supplementary Methods) indicated that integrating different algorithms is superior to using any single algorithm alone (Supplementary Figure S3). As a component of lncACTs, miRNA–mRNA interactions were also obtained from reliable reference databases. A total of 43 497 non-redundant miRNA–target pairs were collected (Figure 1).
Figure 1.
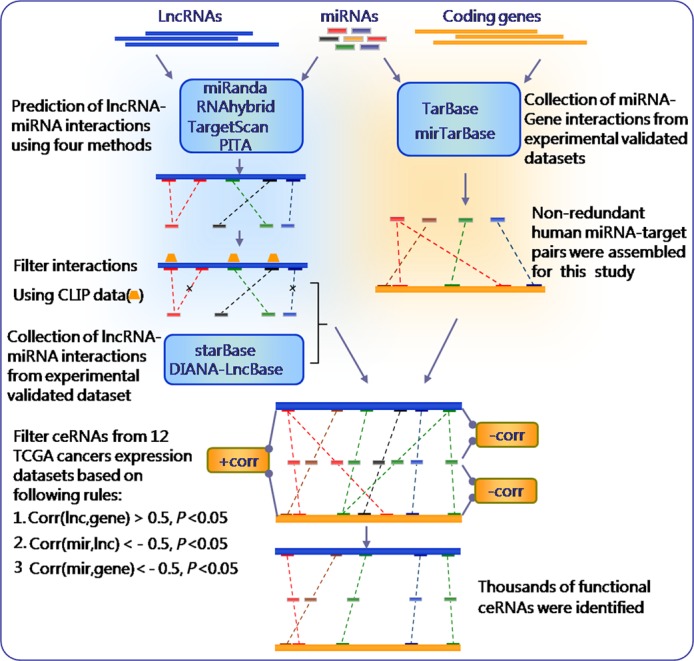
An integrative pipeline for transcriptome-wide identification of lncACTs. Interactions between miRNAs and lncRNAs were predicted using four computational approaches (TargetScan, miRanda, PITA and RNAhybrid) and combined with CLIP data to extract biologically relevant interactions. Experimental evidence for miRNA–lncRNA interactions was integrated into the pipeline. Human miRNAs and target coding gene pairs were obtained from TarBase and mirTarBase, which were combined and integrated into the pipeline as miRNA–mRNA interactions. MiRNA–lncRNA and miRNA–mRNA pairs sharing the same miRNA were merged into an lncRNA–miRNA–mRNA interaction as a candidate lncACT. Functional lncACTs were identified by evaluating correlations with expression in 12 types of cancer data sets and was defined as functional if the expression of the constituents met specific correlation criteria.
Identification of Argonaute (AGO)-CLIP data-supported lncRNAs
The AGO-CLIP-seq data set was integrated into the pipeline to identify experimentally supported miRNA-binding sites on lncRNA sequences. Data were generated using an improved, transcriptome-wide cross-linking approach that directly identified mRNA-binding sites for regulatory miRNA-AGO-containing ribonucleoprotein complexes (53). These data sets were compiled with starBase v2.0, from which 2 059 733 human CLIP-seq peaks were obtained for the present analysis (31). By integrating genome coordinates of CLIP-seq peaks and predicted miRNA-binding sites, 314 729 miRNA–lncRNA interactions were retained for further analysis.
Identification of functional lncACTs based on expression
LncRNA–mRNA pairs found to interact with the same miRNA were defined as candidate lncACTs; 1 430 673 potential lncACTs were identified from 314 729 miRNA–lncRNA and 43 497 miRNA–gene interactions (Figure 1). In a lncACT, the lncRNA competes with mRNA of a coding gene for miRNA binding, which is reflected at the mRNA expression level (19,21,23). Previous studies have indicated that increased lncRNA expression can enhance corresponding coding gene expression (45). In addition, miRNAs are expressed in a tissue-restricted manner (54) and are linked to specific biological processes and diseases. LncRNAs are likewise expressed in certain tissues (55,56) and are associated with a variety of cancers (57). Accordingly, it was hypothesized that specific lncACT interactions occur in cancer. To identify functional lncACTs and test this hypothesis, miRNA, lncRNA and mRNA expression patterns from 12 types of cancer were compared. A functional lncACT was defined for a cancer if it met all of the following criteria: corr (lncRNA, miRNA) < −0.5, P < 0.05; corr (gene, miRNA) < −0.5, P < 0.05; and corr (lncRNA, gene) > 0.5, P < 0.05, where corr (lncRNA, miRNA), corr (gene, miRNA) and corr (lncRNA, gene) represent the Pearson correlation coefficient of miRNA–lncRNA, miRNA–gene and lncRNA–gene interactions, respectively, based on expression values. Ultimately, 5,119 functional lncACTs comprising 335 lncRNAs, 212 miRNAs and 1,312 coding genes were retained for further analysis.
LncACT competing activity score
Expression correlation is a statistically useful method for discerning the association between direct and indirect interacting RNAs and is robust to different normalization methods between mRNA-seq and miRNA-seq data (58). To characterize the strength of competition in lncACTs, the competing activity score was defined as  , where corrml, corrmg and corrlg indicates Pearson correlations for miRNA–lncRNA, miRNA–gene and lncRNA–gene interactions based on expression, with a higher competing activity score indicating greater competition between the lncRNA and miRNA for miRNA binding. For each score, the maximum Pearson correlation P-value was considered as the overall P value. Benchmark analysis has indicated that the competing activity score is a valuable measurement to evaluate the association of competition in lncACTs (Supplementary Figures S4 and S5 and Supplementary Methods).
Tissue specificity score
The specificity of each lncACT was determined by the specificity score, which was calculated based on a previously described method (59) and was defined as:
 |
where N is the number of cancer tissue samples and xi is a component normalized to the maximum value of that component. For example, the activity profile ‘0 0 2 0 0 0 0 2 0 0 8 0’ is defined as having score of 0.95. The range of specificity scores is between 0 and 1, while a perfect specific pattern would be scored as 1.
Betweenness centrality
Betweenness centrality is a measure of a node's centrality in a network and is equal to the number of shortest paths from each node to all others that pass through this node; as such, it reflects the amount of control that a node exerts over the interactions of other nodes in the network. The betweenness centrality of a node n is given by the expression
 |
where pst is the total number of shortest paths from node s to node t and pst(n) is the number of these paths that passes through n.
Identification of competing modules in the network
A biclique module is a complete bipartite graph in which an edge is realized from every vertex of a miRNA set to every vertex of a target gene set. Competing biclique modules consisting of miRNAs and their targets (including mRNAs and lncRNAs) were identified using an algorithm downloaded from the website of the Computational Biology Laboratory in the Department of Computer Science, Iowa State University (http://genome.cs.iastate.edu/supertree/download/biclique/).
Development of the risk score model
A univariate Cox regression analysis was carried out to evaluate the association between survival and expression level of each lncRNA/miRNA/mRNA node in network modules. A risk score formula was developed to evaluate the association between survival and combinations of nodes in the module, which takes into account both the strength and positive/negative association between each node and probability of survival. The integrated risk score for each patient was calculated based on the linear combination of expression values weighted by the regression coefficient from the univariate Cox regression analysis, as follows.
 |
where ri is the Cox regression coefficient of node i from the network, n is the number of nodes in the network and Exp(i) is the expression value of node i in corresponding patient. The median integrated risk score was used as cut-off to classify patients into high and low-risk groups.
Survival analysis
Hierarchical clustering was used to classify cancer patients by their lncACT expression profiles. A Kaplan-Meier survival analysis was performed for the clustered two groups, and statistical significance was assessed using the log-rank test. All analyses were performed on the R 2.13.2 framework.
RESULTS
Global properties of the lncACT cross-talk network
It was assumed that lncRNAs and mRNAs in one lncACT could compete for binding to miRNAs within other lncACTs. This type of cross-talk between lncACTs represents an intricate transcriptional regulatory network that provides insight into how intermolecular relationships dictate cellular behavior. A comprehensive lncACT cross-talk network (CLCN) of miRNA-mediated interactions was reconstituted by combining miRNA–lncRNA–mRNA interactions from different lncACTs (Figure 2A). Detail illustration of how to construct this network is shown in Methods and Supplementary Figure S6. The CLCN had 212 miRNAs interacting with 335 lncRNAs and 1312 mRNAs with a scale-free structure typical of transcriptional regulatory networks (Figure 2C) (27). The CLCN was graphically modeled and separated into three major competing layers: from inside out, the nodes of these layers were lncRNAs, miRNA and mRNAs. The inner lncRNAs indirectly regulated the outer mRNAs through interactions with the intermediate miRNA layer. Based on the specific cellular roles of RNAs, it was concluded that lncRNAs and miRNAs constituted the regulatory layers, while mRNAs were the functional layer of the CLCN. The interfaces between layers were tightly connected and contained a greater number of hub nodes. These high-density areas were indicative of the competition status of the network. Known disease-associated lncRNAs, miRNAs and mRNAs selected from reliable databases (Materials and Methods) were mapped to the network, and 17 lncRNAs, 142 miRNAs and 619 mRNAs were found to be involved in the CLCN (Figure 2B). When topological characteristics of the CLCN were examined, disease-associated nodes were found to have significantly higher degrees and betweenness centrality than other nodes (Figure 2D, E and Supplementary Figure S7). Specific topological patterns reflected the functional importance of disease-associated nodes in the CLCN. A higher degree indicated that the nodes were likely to be hubs, and therefore involved in more competing interactions, while a higher betweenness centrality implied that they acted as bridges connecting different network components and controlling communication. Previous studies have shown that lncRNAs can function by means of cis and trans regulatory mechanisms (60). To determine which of these was used by lncRNAs in the CLCN, the genomic association between lncRNAs and their interacting miRNAs and genes was investigated. Of all CLCN interactions, > 99% had a genomic distance > 1 kb, with an average distance of 5.6 ×10³ kb (Supplementary Figure S8), supporting the observations of previous studies that lncRNAs regulates gene expression in trans by acting as molecular decoys for endogenous miRNAs (19,61). Together, these results demonstrate that the CLCN can provide insight into cancer-associated transcriptional regulatory networks.
Figure 2.

Cross-talk between different functional lncACTs and their network properties. (A) A global lncACT cross-talk network consisting of 335 lncRNAs, 212 miRNAs and 1312 mRNAs was constructed and are arranged as inner, intermediate and outer layers, respectively. Layers were connected through interactions, as seen from the high density of elements at layer interfaces. (B) Disease-associated genes mapped to the global network constituted nodes that exhibited specific topological characteristics compared to other nodes. In A and B, lncRNAs, miRNAs and coding-genes were blue, red and yellow colored. The node degree was indicated by the node size. Disease associated nodes were marked by black circles. (C) The network revealed a power law distribution with slope −1.32 and R2 = 0.87. X axis indicating nodes degree distribution. Y axis indicating frequency of nodes according to X axis. (D and E) Disease-associated nodes had a higher degree and betweenness centrality than other nodes. Data are shown as mean ± SEM. Disease-associated and other nodes were indicated in red and blue along X axis. Average degrees of these two groups of nodes were indicated by Y axis.
Sponge characteristics of lncRNAs in the CLCN
Previous reports have indicated that lncRNAs are generally shorter in length, less conserved, and are expressed at lower levels than coding genes (56). To determine whether lncRNAs involved in the CLCN (lncRNAsin) have intrinsic properties of miRNA sponges, their sponge and related characteristics, including transcript length, exon structure, expression levels, number of miRNA binding sites, and evolutionary conservation were compared to those of lncRNAs not involved in the CLCN (lncRNAsout). Transcripts for lncRNAsin were 1.77-fold longer than for lncRNAsout (average lengths: 1692 nt for lncRNAsin versus 952 nt for lncRNAsout; P = 9.8E-107; Figure 3A). Moreover, lncRNAsin had more exons per transcript than lncRNAsout (4 versus 3; P = 7.6E-47; Figure 3B). The properties of lncRNAsout were consistent with estimates of human lncRNA transcript length and exon number (∼1 kb and 2.9 exons per transcript, respectively) (56). LncRNAsin with longer transcripts and a greater number of exons would be expected to have a higher probability of forming sequence structures that harbor miRNA binding sites. The average expression level of lncRNAsin was ∼2.5-fold higher than lncRNAsout (Figure 3C), and this was positively correlated with the number of lncACTs (Pearson correlation, r = 0.46; P = 1.3E-10) (Figure 3F). These observations indicated that lncRNAsin maintained their competitive capabilities in lncACTs through higher levels of transcript expression. In addition, the density of miRNA binding sites on lncRNAsin calculated using four prediction methods was found to be greater than in lncRNAsout (164.42 sites/kb versus 131.56 sites/kb; P = 3.9E-5; Figure 3D). The UCSC phyloP score, which provides a measure of evolutionary conservation based on multiple alignments of 46 vertebrate species, was used to assess the conservation of lncRNAs. In this step, 33 and 532 antisense lncRNAs were excluded from lncRNAsin and lncRNAsout data sets, respectively, because the conservation status belonged to the corresponding coding gene rather than the lncRNA. LncRNAsin were more highly conserved than lncRNAsout with a 2-fold higher phyloP score (P = 4.3E-4; Figure 3E), indicating a lower selective pressure on these lncRNAs and highlighting the importance of their regulatory function. Thus, lncRNAsin were greater to lncRNAsout in terms of transcript length, exon number, expression level and density of miRNA binding sites, suggesting that they are more suited to functioning as miRNA sponges in biological processes.
Figure 3.
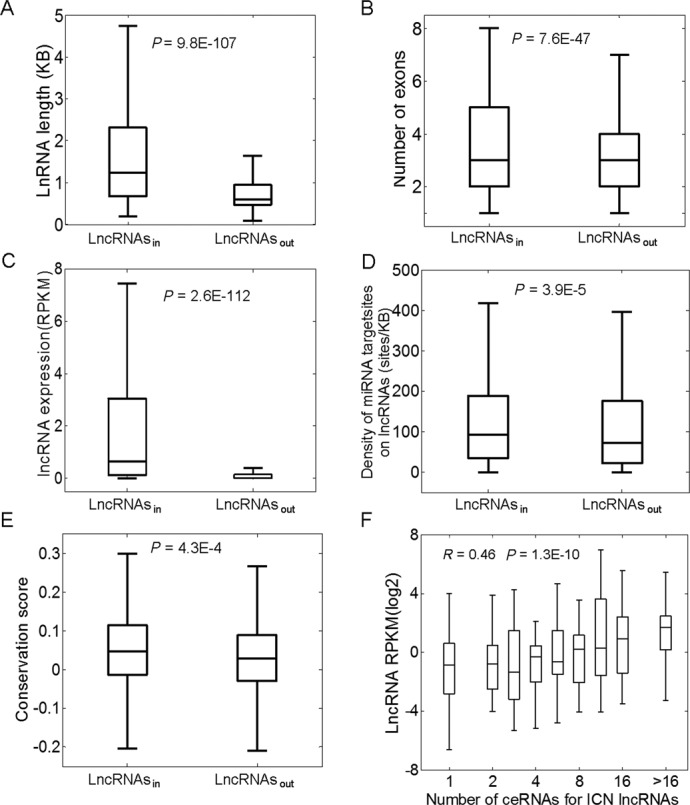
LncRNAsin have more extreme properties than lncRNAsout. In lncRNAsin, (A) transcript length and (B) number of exons was greater; and (C) expression levels (RPKM), (D) miRNA target site density (sites/KB) and (E) conservation scores were higher than in lncRNAsout. (F) Expression levels of lncRNAs in lncACTs were positively correlated with the number of associated lncACTs. Boxplots depict different groups of properties. From bottom to top in each boxplot, the five vertical lines represent the minimum observed value (Min), the first quartile (Q1), the second quartile (Q2) or median, the third quartile (Q3) and the maximum observed value (Max). P values were determined by the Mann-Whitney U test.
Variable competing activity profiles of lncACTs among cancers
To characterize the compactness of each lncACT, competing activity score and corresponding P value were calculated. Cancer-associated lncACTs were identified as those for which the activity difference of the lncACT was observed in cancerous but not in normal samples (P < 0.05). Further, based on cancer-associated lncACTs, cancer-specific lncACTs were those for which the activity difference was observed in one or two cancers. In total, 4265 lncACTs were identified as cancer-specific. Based on the competing activity score of these lncACTs, a global competing activity profile was constructed and clustered by the k-means method. The analysis revealed 12 independent lncACT clusters of which clusters 1–10 were restricted to a specific cancer type (Figure 4A). The profile provided information on the effect of competing lncACT functions on the expression of different types of cancer. Of the 12 cancers, all but LIHC, KIRC and KICH had clearly restricted lncACT clusters. Though associated with the same organ, the activity profile of KIRP differed from those of KIRC and KICH. Similar discrepancies were found between LUAD and LUSC. These results are in agreement with a previous study showing that lncRNAs have unique expression profiles across a broad range of tumors (57). Further, the specificity of the lncACTs was characterized quantitatively by calculating the specificity score for each lncACT using a previously described method (59). The minimum specificity score was ∼0.2, and for the majority of lncACTs (> 70%) the specificity score was > 0.5 (Figure 4B). According to an earlier study, an specificity score < 0.15 indicates a housekeeping gene (59). These results reveal a high degree of specificity for lncACT competing activities in different cancers.
Figure 4.
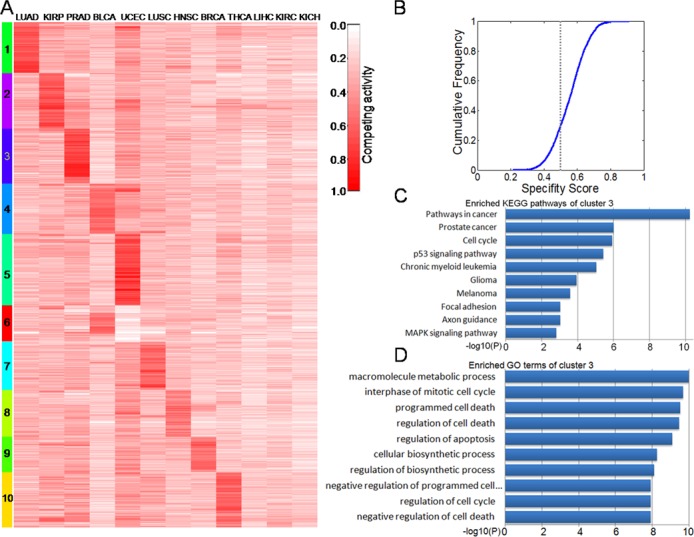
(A) Dynamic changes in activity profiles of lncACTs (rows) in 12 types of cancer (columns). Rows were ordered by a k-means clustering of lncACTs; 10 lncACT clusters had high activity levels in one or two cancers. These clusters comprised of approximately 83% of the 5119 functional lncACTs that were analyzed. Competing activity is indicated by a red colored bar, ranging from 0 to 1. (B) Cumulative distribution of lncACT specificity score. The majority (>70%) of lncACTs had scores of >0.5. The X axis represents the specificity score for each lncACT. The Y axis represents the cumulative frequency of specificity score. (C and D) KEGG pathways and GO terms enriched for lncACT cluster 3, ranked by −log10(P).
Cancer-specific lncACTs associated with critical biological functions
A functional annotation of the 10 lncACT clusters was carried out. Due to the shortage of annotated information, so-called guilt by association analyses are frequently used to predict mammalian lncRNA functions (56,62,63). LncACT functions were presumed based on known functions of competing coding genes in the lncACTs. GOSim (64) and SubpathwayMiner (65) were employed for enrichment analyses of coding genes from each specific clusters based on GO terms and KEGG pathways, and each cluster was annotated with the enriched functions of the corresponding gene set. Processes for the maintenance of cell homeostasis (such as cell cycle regulation and apoptosis) and cancer development-related pathways (such as the focal adhesion and p53 signaling pathways and pathways in cancer) were highly represented. Cluster 3 (a prostate cancer-specific cluster in the activity profile) was enriched in cancer development-related pathways (Figure 4C) and cell cycle-related processes (Figure 4D). In addition, the prostate cancer pathway was significantly associated with this lncACT cluster. We used starBaseV2.0 (31) and Linc2GO (29), which identify lncRNA functions based on ceRNA hypothesis, to predict functions of this cluster. Prostate cancer-related GO terms and pathways were also identified by the two methods (Supplementary Figure S9). A list of enriched GO terms and KEGG pathways for each lncACT cluster is provided in Supplementary Tables S3 and S4.
lncACTs are potential prognostic biomarkers for cancers
Cancer-specific clusters can be used to evaluate the regulatory role of each lncACT at the level of expression. On the other hand, lncACTs can interact and act as co-regulators within a cancer-specific cluster by forming network modules. Such regulatory cross-talk cannot be represented by clusters at the level of expression. Analyzing a disease based on a network can provide a global view of regulatory relationships and all possible competing interactions occurring under given conditions, while partial sub-networks can provide more detailed information on cross-talk between lncACTs. Each of the 10 cancer-specific lncACT clusters (Figure 4A) were converted into an lncRNA–miRNA–mRNA interaction sub-network, with BRCA-specific clusters 4 and 6 merged into the same sub-network. Nine sub-networks were ultimately defined based on cancer-specific clusters of lncACT competing activity profiles (Supplementary Figure S10). Similar to the global network, sub-networks presented a scale-free structure and layered organization (Supplementary Figures S11 and S12). Functional competing modules exhibiting extensive regulatory interactions across sub-network layers were identified using an algorithm (Materials and Methods). In total, 1621 lncACT modules were detected, containing between four and 61 nodes, with an average of 6.4 nodes per module.
To exemplify how these competing modules can provide insight into the pathogenesis of cancer, the BRCA sub-network comprising 95 lncRNAs, 68 miRNAs and 197 mRNAs within 132 functional modules was examined (Figure 5A). A module was identified consisting of five nodes that have all been shown experimentally to play key roles in the development of BRCA (Figure 5B). The downregulation of the lncRNA H19 significantly decreased breast cancer cell growth (14), while its overexpression enhanced the tumorigenic properties (66). The miRNAs miR-17 and miR-20 have been found to inhibit BRCA cell migration and invasion via a heterotypic secreted signal (67,68). The downstream gene thrombospondin-1, an angiogenesis inhibitor regulated by p53 and retinoblastoma was previously shown to be a serological biomarker for BRCA (69). Mitogen-activated protein (MAP)3K12, an activator of MAP kinase pathway, had distinctive patterns of somatic mutations in BRCA (70), as reported in Genes-to-Systems Breast Cancer (71). A strong inverse correlation was observed between the intermediate miRNA layer and lncRNA and mRNA layers, indicating extensive competing interactions within this module (Figure 5B). LncRNA H19 was also a hub related to five competing modules, indicating that H19 could control communication between different functional sub-networks in BRCA (Figure 5C). In another example, the lncRNA MIR22HG, which shared miRNAs with H19, was also the host gene of the miRNA hsa-miR-22 (Figure 5D). These results indicate a functional complementation between MIR22HG and H19 and a potential feedback regulation of MIR22HG by miR-22. Based on these analyses, H19-associated lncACTs likely play important regulatory roles in BRCA progression. To assess the clinical relevance of these findings, a survival analysis (Materials and Methods) was performed on an H19-associated lncACT module (Figure 5B), in which all components have been experimentally confirmed as being involved in BRCA pathogenesis. There were no differences between expression clustered two groups of patients (Supplementary Figure S13). lncACTs of two breast cancer risk genes, BRCA1 and BRCA2 which formed nine lncACTs with two miRNAs and nine lncRNAs were also found no significant results (Supplementary Figure S13). However, when expression profiles in the H19 and BRCA1/2 lncACT module (HB_module) were integrated (Figure 5E) and patients were reclassified into two groups, survival analyses indicated that these lncACTs could distinguish the two groups of patients with different clinical outcomes (Figure 5F). A univariate Cox regression analysis was carried out to evaluate association between survival and expression level of each lncRNA/miRNA/mRNA node in HB_module. BRCA2 (P = 4.43E−02) and miR-20b (P = 8.00E−03) were significantly associated with BRCA survival (Supplementary Table S5). By testing all nodes of HB_module with the risk score model (Materials and Methods), HB_module was found to be the most significant factor associated with survival (P = 3.73E−5 in Supplementary Table S5). To test whether the whole HB_module could better distinguish patients than lncRNAs/miRNAs/mRNAs and combinations thereof, Kaplan-Meier survival curves were generated of the classification based on each node of the module, integration of BRCA2 and miR-20b, H19- and BRCA1/2-associated lncACTs, and all lncRNAs, miRNAs, and coding genes (Supplementary Figure S13). HB_module distinguished BRCA patients better than the others with the most significant P value (P = 3.8E−3), suggesting that it can be used as a potential prognostic biomarker for BRCA.
Figure 5.

Sub-network analysis of competing lncACTs. (A) A BRCA-specific sub-network was derived from the global crosstalk network, which consisted of 95 lncRNAs, 68 miRNAs, 197 mRNAs and contained 132 functional modules. Two example modules are demarcated by circles. The lncRNAs, miRNAs and coding-genes are colored blue, red and yellow, respectively. The node degree is indicated by the node size. (B) One module had five nodes, all of which have been experimentally demonstrated to have key roles in the development of breast cancer. The expression heat map is shown on the right. In the heat map, highly expressed genes are shown in red, low expression genes are shown in green. (C) The lncRNA H19 was identified as a hub that connects five competing modules. (D) The lncRNA MIR22HG is functionally complementary to H19 and interacts with the same miRNAs. A genomic representation of miR-22 is shown in the red bar and MIR22HG is shown on the bottom. Predicted miR-22 target sites on MIR22HG are shown in the black bar, with detailed miRNA binding information of the site nearest to the miR-22 locus illustrated on the right. (E) Hierarchical clustering of 248 patients based on H19 and BRCA1/2 lncACT expression. (F) Kaplan-Meier survival analysis of two groups of patients with different clinical outcomes. Those that showed no progression or who were still alive at the time of the last follow-up were censored (+). Survival days are shown along the X axis. Overall survival rates are shown along the Y axis.
Further exhaustive survival analysis was also performed on each of the 1621 lncACT modules to test whether their expression profiles were associated with cancer prognosis. Two subgroups were identified based on expression, and several lncACT modules could differentiate between patients with good and poor prognosis in various cancers (Supplementary Figure S14A–F). Another lncACT module was identified that could distinguish between two groups of patients with different survival times in BRCA (Supplementary Figure S14A), in which two lncRNAs (LINC00968 and FLG-AS1) competed for miR-335. A Cox regression analysis indicated that none of the individual nodes but rather the whole module was associated with patient survival (Supplementary Table S6). This module could distinguish BRCA patients better than any single node, with the most significant P value (P = 1.4E−6) (Supplementary Figure S15). Most of the miR-335 target genes were associated with human cancers, such as components of the MAPK signaling pathway, pathways in cancer, cell-matrix adhesion, migration and proliferation (Supplementary Tables S7 and S8). Under the competitive regulation of upstream lncRNAs, these processes likely govern the clinical features and outcome of BRCA patients. The miR-335 target gene MERTK in this module is associated with BRCA metastasis and migration (72). The expression profiles and survival curves indicated that patients with poor survival had a higher miR-335 expression level than patients in the other group (t test; P = 1.44E−7) (Supplementary Figure S14A). This was consistent with the results of a study in which gastric cancer cases with a high level of hsa-miR-335 expression had high frequency of recurrence and poor survival (73). The Cox regression analysis for other risk network modules are shown in Supplementary Table S9. The regression coefficients and P values indicated that these modules were the most significant factors associated with patient survival in the corresponding cancer. Thus, functional lncACT modules in the competitive network can provide clinically useful information.
LncACT online database
A free access, online database was developed (http://www.bio-bigdata.net/LncACTdb, or http://bioinfo.hrbmu.edu.cn/LncACTdb) containing 878 cancer-associated, 5119 functionally activated, and > 530 000 computationally predicted lncACTs that were identified by integrating several in silico target prediction methods, AGO-CLIP experimental data, and stringent expression profiles from transcriptome sequencing. LncACTdb can support rapid and advanced searches as well as data downloads (Supplementary Figure S16). Additional features of the LncACTdb include: (1) support of customizable expression profiles to generate user-relevant functional lncACTs; (2) the LncACTFun tool that allows the user to open a lncACT functional location map in the context of a GO-directed acyclic graph and KEGG pathways; and (3) the LncACTView built-in multi-track visualization platform that allows users to browse genome-wide LncACTs. To provide more reliable data set, we kept continuous updating on our data set as soon as GENCODE update the human genome annotation. The LncACTdb can serve as a tool for dissecting the communication network of different classes of RNA and identifying novel cancer biomarkers.
DISCUSSION
Recently, human lncRNAs have been identified in RNA–RNA cross-talk networks as competitors of mRNAs for miRNA binding, thereby regulating mRNA expression levels through an indirect post-transcriptional mechanism (19). A competing RNA interaction network in glioblastoma was proposed to mediate cross-talk between canonical oncogenic pathways (27). However, functional triplets consisting of lncRNAs, mRNAs and miRNAs have not been systematically identified and analyzed. In this study, a transcriptome-wide identification and characterization of these lncACTs was performed, providing a comprehensive resource for studying the regulation of human disease by non-coding molecules.
To the best of our knowledge, there are currently no methods specifically designed to predict miRNA–lncRNA interactions; as such, traditional miRNA target prediction methods have been used to identify target sites on coding transcripts and miRNA–lncRNA interactions (28,29,45), in conjunction with experimental approaches based on immunoprecipitation. AGO-CLIP studies have provided reliable data sets for identifying miRNA-binding sites and predicting miRNA targets (74). Additional criteria such as expression correlation filtering have also been integrated into miRNA–lncRNA identification pipelines. As knowledge of lncRNAs expands, more reliable methods for predicting miRNA–lncRNA interaction are likely to be developed. There was considerable discrepancy in predictions of miRNA–lncRNA interactions using these four methods; therefore, to obtain an accurate assessment of these interactions, an integrative strategy was adopted (51,52). A comparative analysis indicated that this method hosts the highest number of validated miRNA–lncRNA interactions and yields the most significant hypergeometric test P value relative to other methods. In addition, lncRNAs have been shown to act as miRNA sponges for endogenous RNAs (16–19), although the characterization of this function has been limited; it has been suggested that this depends on the lncRNA expression level and total number of functional miRNA binding sites that are shared with a target (27). A systematic characterization of lncACTs showed that their lncRNAs were greater in terms of transcript length, exon number, expression level and density of miRNA binding sites compared to other lncRNAs. These features pointed to a sponge function for lncRNAs in lncACTs. The evolutionary conservation of lncRNAs, indicating a lower selective pressure, also highlighted the importance of their regulatory function. Based on reviewing previous reports, we found a number of known lncACT relationships were present in the lncRNAout (Supplementary Table S10). For example, ceRNA interactions between lncRNA PVT1 and other protein coding genes such as PVT1-CDH1, PVT1-TP53 and PVT1-RUNX1, which were important regulators of breast tissue morphogenesis and development (75); Experimentally verified ceRNAs of H19-Let7family-HMGA2 have been found to promote pancreatic ductal adenocarcinoma invasion (76) and regulate muscle differentiation (77); HOTAIR-miR331-HER2 ceRNA has been identified in gastric cancers (78). The increased rate of HOTAIR and HER2 overexpression were strongly linked to poor outcomes for patients with metastatic and high-grade localized gastric cancers. Indeed, these specific features could potentially be used to classify lncRNAs and identify those that participate in competitive networks.
TCGA data have provided a catalog of genomic alterations identified in tumor and matched normal samples (44), enabling the identification of lncACTs associated with cancers. LncRNAs, miRNAs and genes as well as lncACTs differentially expressed in cancer and matched normal RNA sequence data were identified using the DEGseq R package (79). At the expression level, genes in each cancer-specific cluster were significantly associated with corresponding cancers (fold-change > 1.5; P < 0.01 by DEGseq). 878 lncACTs were associated with at least one differently expressed lncRNA or gene and of these, 371 (42.3%) showed differences in competing activity score of at least 1.5-fold between the two sets of samples. Two patterns emerged from the analysis of lncRNA, miRNA and gene expression and variations in competitive activity in these lncACTs: (1) 252 lncACTs showed competing activities in normal but not cancer samples (Figure 6A); and (2) 119 lncACTs had no competitive interactions in normal samples but did in cancer samples (Figure 6B). In these lncACTs, the difference in competing activity score implied that lncRNA–miRNA-gene interactions were impaired by pathological changes in the cellular environment, resulting in the dysregulation of gene expression possibly through the loss of competitive ability in lncRNAs. For example, the lncRNA DLEU2 indirectly regulated the downstream gene C1QBP in normal samples by binding miR-375. However, the DLEU2/miR-375 interaction was lost in KICH samples, leading to the downregulation of C1QBP expression (Figure 6A). In contrast, 507 (57.7%) of lncACTs showed competing activities in both cancer and normal samples, but with opposite expression patterns (Figure 6C). In these lncACTs, lncRNAs played prominent roles in the competitive interactions, resulting in corresponding changes in miRNA and gene expression. For example, the lncRNA DANCR binds miR-222 and regulates the downstream gene TCEAL1. As proposed by the ceRNA hypothesis (19), in normal samples, DANCR transcripts are highly expressed to maintain its capacity for acting as a sponge for miR-222 molecules. This can indirectly result in the derepression of TCEAL1. Conversely, in cancer samples, the downregulation of DANCR reduces its competitive activity for miR-222, leading to the inhibition of TCEAL1 by miR-222. The suggested regulatory mechanism is illustrated in Supplementary Figure S17. In fact, the TCEAL1 gene is significantly downregulated in esophageal cancer tissue (80). Our findings suggest potential tumor suppressor pathways that are regulated by competing lncRNAs.
Figure 6.

Disease-associated lncACTs exhibit specific expression patterns in cancer and matched normal samples. Illustrations of lncACT expression in cancer and normal states are shown in the left panel. The lncRNAs, miRNAs and coding-genes are colored blue, red and yellow, respectively. Corresponding expression profiles in KICH are shown in the right panel. Highly expressed genes are shown in red, low expression genes are shown in green. (A) The lncACT competing activities were observed in normal but not cancer samples. (B) The lncACT competing activities were not observed in normal samples but were present in cancer samples. (C) The lncACT competing activities were observed in normal and cancer samples, but some constituents showed expression levels that changed in opposite directions.
The secondary structure of a human lncRNA has been experimentally determined and the evolutionary stabilization of RNA structural elements has been studied (81). The functional domains and elements were the fundamental modules responsible for RNA-associated molecular interactions. In future work, taking into account the secondary structure would provide a better understanding of the mechanisms of RNA–RNA crosstalk. Other regulatory mechanisms involving transcription factors, DNA methylation, and copy number variations can also induce the co-expression of lncRNAs and protein-coding genes and can underlie cancer pathology. The ceRNA hypothesis remains controversial (34,35); it has been suggested that the release of target genes from repression occurs at a certain threshold of target abundance irrespective of effective levels of miR-122 in primary hepatocytes and the liver (34). The present study provides insight into potential mechanisms of ncRNA regulation in tumorigenesis. Studies based on the ceRNA hypothesis have provided hints for investigating lncRNA functions. The Linc2GO database is the first to predict lncRNA functions based on this hypothesis (29). By analyzing a large set of Ago-binding sites determined from CLIP-Seq experiments, the ceRNAFunction webtool in starBase v.2.0 can be used to predict the function of ncRNAs (miRNAs, lncRNAs and pseudogenes) and protein-coding genes from ceRNA regulatory networks (31). DIANA-LncBase integrates AGO CLIP-Seq data into the miRNA–lncRNA identification pipeline (30). This database provides experimentally verified and computationally predicted miRNA targets in lncRNAs. Our comprehensive analysis of lncACTs across 12 types of cancer has resulted in an online database for exploring lncRNA function and regulatory interactions. Collectively, these valuable methods can significantly improve our understanding of RNA communication, at the transcriptome level, and provide a timely and valuable resource for non-coding RNA studies.
In summary, the lncACTs activity profiles offered a means of examining the competitive interactions of RNAs that are potentially dysregulated in different types of cancer. These findings expand the existing knowledge of lncRNA characteristics and provide new tools for the dissection of lncACT activity, which can help to elucidate disease processes and offer new targets for therapy.
SUPPLEMENTARY DATA
Supplementary Data are available at NAR Online.
FUNDING
National High Technology Research and Development Program of China [863 Program, 2014AA021102]; National Program on Key Basic Research Project [973 Program, 2014CB910504]; National Natural Science Foundation of China [91439117, 61473106, 31401090]; Undergraduate Innovation Funds of Harbin Medical University [YJSCX2012-228HLJ]. Funding for open access charge: National High Technology Research and Development Program of China [863 Program, 2014AA021102]; National Program on Key Basic Research Project [973 Program, 2014CB910504]; National Natural Science Foundation of China [91439117, 61473106, 31401090]; Undergraduate Innovation Funds of Harbin Medical University [YJSCX2012-228HLJ].
Conflict of interest statement. None declared.
REFERENCES
- 1.Kapranov P., Cheng J., Dike S., Nix D.A., Duttagupta R., Willingham A.T., Stadler P.F., Hertel J., Hackermuller J., Hofacker I.L., et al. RNA maps reveal new RNA classes and a possible function for pervasive transcription. Science. 2007;316:1484–1488. doi: 10.1126/science.1138341. [DOI] [PubMed] [Google Scholar]
- 2.Kapranov P., Cawley S.E., Drenkow J., Bekiranov S., Strausberg R.L., Fodor S.P., Gingeras T.R. Large-scale transcriptional activity in chromosomes 21 and 22. Science. 2002;296:916–919. doi: 10.1126/science.1068597. [DOI] [PubMed] [Google Scholar]
- 3.Birney E., Stamatoyannopoulos J.A., Dutta A., Guigo R., Gingeras T.R., Margulies E.H., Weng Z., Snyder M., Dermitzakis E.T., Thurman R.E., et al. Identification and analysis of functional elements in 1% of the human genome by the ENCODE pilot project. Nature. 2007;447:799–816. doi: 10.1038/nature05874. [DOI] [PMC free article] [PubMed] [Google Scholar]
- 4.Guttman M., Donaghey J., Carey B.W., Garber M., Grenier J.K., Munson G., Young G., Lucas A.B., Ach R., Bruhn L., et al. lincRNAs act in the circuitry controlling pluripotency and differentiation. Nature. 2011;477:295–300. doi: 10.1038/nature10398. [DOI] [PMC free article] [PubMed] [Google Scholar]
- 5.Bartel D.P. MicroRNAs: target recognition and regulatory functions. Cell. 2009;136:215–233. doi: 10.1016/j.cell.2009.01.002. [DOI] [PMC free article] [PubMed] [Google Scholar]
- 6.Farazi T.A., Spitzer J.I., Morozov P., Tuschl T. miRNAs in human cancer. J. Pathol. 2011;223:102–115. doi: 10.1002/path.2806. [DOI] [PMC free article] [PubMed] [Google Scholar]
- 7.Wilusz J.E., Sunwoo H., Spector D.L. Long noncoding RNAs: functional surprises from the RNA world. Genes Dev. 2009;23:1494–1504. doi: 10.1101/gad.1800909. [DOI] [PMC free article] [PubMed] [Google Scholar]
- 8.Wang K.C., Chang H.Y. Molecular mechanisms of long noncoding RNAs. Mol. Cell. 2011;43:904–914. doi: 10.1016/j.molcel.2011.08.018. [DOI] [PMC free article] [PubMed] [Google Scholar]
- 9.Ponting C.P., Oliver P.L., Reik W. Evolution and functions of long noncoding RNAs. Cell. 2009;136:629–641. doi: 10.1016/j.cell.2009.02.006. [DOI] [PubMed] [Google Scholar]
- 10.Bernstein E., Allis C.D. RNA meets chromatin. Genes Dev. 2005;19:1635–1655. doi: 10.1101/gad.1324305. [DOI] [PubMed] [Google Scholar]
- 11.Khaitan D., Dinger M.E., Mazar J., Crawford J., Smith M.A., Mattick J.S., Perera R.J. The melanoma-upregulated long noncoding RNA SPRY4-IT1 modulates apoptosis and invasion. Cancer Res. 2011;71:3852–3862. doi: 10.1158/0008-5472.CAN-10-4460. [DOI] [PubMed] [Google Scholar]
- 12.Loewer S., Cabili M.N., Guttman M., Loh Y.H., Thomas K., Park I.H., Garber M., Curran M., Onder T., Agarwal S., et al. Large intergenic non-coding RNA-RoR modulates reprogramming of human induced pluripotent stem cells. Nat. Genet. 2010;42:1113–1117. doi: 10.1038/ng.710. [DOI] [PMC free article] [PubMed] [Google Scholar]
- 13.Pandey R.R., Mondal T., Mohammad F., Enroth S., Redrup L., Komorowski J., Nagano T., Mancini-Dinardo D., Kanduri C. Kcnq1ot1 antisense noncoding RNA mediates lineage-specific transcriptional silencing through chromatin-level regulation. Mol. Cell. 2008;32:232–246. doi: 10.1016/j.molcel.2008.08.022. [DOI] [PubMed] [Google Scholar]
- 14.Barsyte-Lovejoy D., Lau S.K., Boutros P.C., Khosravi F., Jurisica I., Andrulis I.L., Tsao M.S., Penn L.Z. The c-Myc oncogene directly induces the H19 noncoding RNA by allele-specific binding to potentiate tumorigenesis. Cancer Res. 2006;66:5330–5337. doi: 10.1158/0008-5472.CAN-06-0037. [DOI] [PubMed] [Google Scholar]
- 15.Zhou Y., Zhong Y., Wang Y., Zhang X., Batista D.L., Gejman R., Ansell P.J., Zhao J., Weng C., Klibanski A. Activation of p53 by MEG3 non-coding RNA. J. Biol. Chem. 2007;282:24731–24742. doi: 10.1074/jbc.M702029200. [DOI] [PubMed] [Google Scholar]
- 16.Ebert M.S., Sharp P.A. Emerging roles for natural microRNA sponges. Curr. Biol. 2010;20:R858–R861. doi: 10.1016/j.cub.2010.08.052. [DOI] [PMC free article] [PubMed] [Google Scholar]
- 17.Arvey A., Larsson E., Sander C., Leslie C.S., Marks D.S. Target mRNA abundance dilutes microRNA and siRNA activity. Mol. Syst. Biol. 2010;6:363. doi: 10.1038/msb.2010.24. [DOI] [PMC free article] [PubMed] [Google Scholar]
- 18.Calin G.A., Liu C.G., Ferracin M., Hyslop T., Spizzo R., Sevignani C., Fabbri M., Cimmino A., Lee E.J., Wojcik S.E., et al. Ultraconserved regions encoding ncRNAs are altered in human leukemias and carcinomas. Cancer Cell. 2007;12:215–229. doi: 10.1016/j.ccr.2007.07.027. [DOI] [PubMed] [Google Scholar]
- 19.Salmena L., Poliseno L., Tay Y., Kats L., Pandolfi P.P. A ceRNA hypothesis: the Rosetta Stone of a hidden RNA language. Cell. 2011;146:353–358. doi: 10.1016/j.cell.2011.07.014. [DOI] [PMC free article] [PubMed] [Google Scholar]
- 20.Panzitt K., Tschernatsch M.M., Guelly C., Moustafa T., Stradner M., Strohmaier H.M., Buck C.R., Denk H., Schroeder R., Trauner M., et al. Characterization of HULC, a novel gene with striking up-regulation in hepatocellular carcinoma, as noncoding RNA. Gastroenterology. 2007;132:330–342. doi: 10.1053/j.gastro.2006.08.026. [DOI] [PubMed] [Google Scholar]
- 21.Wang J., Liu X., Wu H., Ni P., Gu Z., Qiao Y., Chen N., Sun F., Fan Q. CREB up-regulates long non-coding RNA, HULC expression through interaction with microRNA-372 in liver cancer. Nucleic Acids Res. 2010;38:5366–5383. doi: 10.1093/nar/gkq285. [DOI] [PMC free article] [PubMed] [Google Scholar]
- 22.Poliseno L., Salmena L., Zhang J., Carver B., Haveman W.J., Pandolfi P.P. A coding-independent function of gene and pseudogene mRNAs regulates tumour biology. Nature. 2010;465:1033–1038. doi: 10.1038/nature09144. [DOI] [PMC free article] [PubMed] [Google Scholar]
- 23.Cesana M., Cacchiarelli D., Legnini I., Santini T., Sthandier O., Chinappi M., Tramontano A., Bozzoni I. A long noncoding RNA controls muscle differentiation by functioning as a competing endogenous RNA. Cell. 2011;147:358–369. doi: 10.1016/j.cell.2011.09.028. [DOI] [PMC free article] [PubMed] [Google Scholar]
- 24.Franco-Zorrilla J.M., Valli A., Todesco M., Mateos I., Puga M.I., Rubio-Somoza I., Leyva A., Weigel D., Garcia J.A., Paz-Ares J. Target mimicry provides a new mechanism for regulation of microRNA activity. Nat. Genet. 2007;39:1033–1037. doi: 10.1038/ng2079. [DOI] [PubMed] [Google Scholar]
- 25.Sarver A.L., Subramanian S. Competing endogenous RNA database. Bioinformation. 2012;8:731–733. doi: 10.6026/97320630008731. [DOI] [PMC free article] [PubMed] [Google Scholar]
- 26.Xia T., Liao Q., Jiang X., Shao Y., Xiao B., Xi Y., Guo J. Long noncoding RNA associated-competing endogenous RNAs in gastric cancer. Sci. Rep. 2014;4:6088. doi: 10.1038/srep06088. [DOI] [PMC free article] [PubMed] [Google Scholar]
- 27.Sumazin P., Yang X., Chiu H.S., Chung W.J., Iyer A., Llobet-Navas D., Rajbhandari P., Bansal M., Guarnieri P., Silva J., et al. An extensive microRNA-mediated network of RNA-RNA interactions regulates established oncogenic pathways in glioblastoma. Cell. 2011;147:370–381. doi: 10.1016/j.cell.2011.09.041. [DOI] [PMC free article] [PubMed] [Google Scholar]
- 28.Jeggari A., Marks D.S., Larsson E. miRcode: a map of putative microRNA target sites in the long non-coding transcriptome. Bioinformatics. 2012;28:2062–2063. doi: 10.1093/bioinformatics/bts344. [DOI] [PMC free article] [PubMed] [Google Scholar]
- 29.Liu K., Yan Z., Li Y., Sun Z. Linc2GO: a human LincRNA function annotation resource based on ceRNA hypothesis. Bioinformatics. 2013;29:2221–2222. doi: 10.1093/bioinformatics/btt361. [DOI] [PubMed] [Google Scholar]
- 30.Paraskevopoulou M.D., Georgakilas G., Kostoulas N., Reczko M., Maragkakis M., Dalamagas T.M., Hatzigeorgiou A.G. DIANA-LncBase: experimentally verified and computationally predicted microRNA targets on long non-coding RNAs. Nucleic Acids Res. 2013;41:D239–D245. doi: 10.1093/nar/gks1246. [DOI] [PMC free article] [PubMed] [Google Scholar]
- 31.Li J.H., Liu S., Zhou H., Qu L.H., Yang J.H. starBase v2.0: decoding miRNA-ceRNA, miRNA-ncRNA and protein-RNA interaction networks from large-scale CLIP-Seq data. Nucleic Acids Res. 2014;42:D92–D97. doi: 10.1093/nar/gkt1248. [DOI] [PMC free article] [PubMed] [Google Scholar]
- 32.Das S., Ghosal S., Sen R., Chakrabarti J. lnCeDB: database of human long noncoding RNA acting as competing endogenous RNA. PLoS One. 2014;9:e98965. doi: 10.1371/journal.pone.0098965. [DOI] [PMC free article] [PubMed] [Google Scholar]
- 33.Ghosal S., Das S., Sen R., Chakrabarti J. HumanViCe: host ceRNA network in virus infected cells in human. Front. Genet. 2014;5:249. doi: 10.3389/fgene.2014.00249. [DOI] [PMC free article] [PubMed] [Google Scholar]
- 34.Denzler R., Agarwal V., Stefano J., Bartel D.P., Stoffel M. Assessing the ceRNA hypothesis with quantitative measurements of miRNA and target abundance. Mol. Cell. 2014;54:766–776. doi: 10.1016/j.molcel.2014.03.045. [DOI] [PMC free article] [PubMed] [Google Scholar]
- 35.Broderick J.A., Zamore P.D. Competitive endogenous RNAs cannot alter microRNA function in vivo. Mol. Cell. 2014;54:711–713. doi: 10.1016/j.molcel.2014.05.023. [DOI] [PubMed] [Google Scholar]
- 36.Derrien T., Johnson R., Bussotti G., Tanzer A., Djebali S., Tilgner H., Guernec G., Martin D., Merkel A., Knowles D.G., et al. The GENCODE v7 catalog of human long noncoding RNAs: analysis of their gene structure, evolution, and expression. Genome Res. 2012;22:1775–1789. doi: 10.1101/gr.132159.111. [DOI] [PMC free article] [PubMed] [Google Scholar]
- 37.Akrami R., Jacobsen A., Hoell J., Schultz N., Sander C., Larsson E. Comprehensive analysis of long non-coding RNAs in ovarian cancer reveals global patterns and targeted DNA amplification. PLoS One. 2013;8:e80306. doi: 10.1371/journal.pone.0080306. [DOI] [PMC free article] [PubMed] [Google Scholar]
- 38.Kersey P.J., Lawson D., Birney E., Derwent P.S., Haimel M., Herrero J., Keenan S., Kerhornou A., Koscielny G., Kahari A., et al. Ensembl Genomes: extending Ensembl across the taxonomic space. Nucleic Acids Res. 2010;38:D563–D569. doi: 10.1093/nar/gkp871. [DOI] [PMC free article] [PubMed] [Google Scholar]
- 39.Kozomara A., Griffiths-Jones S. miRBase: integrating microRNA annotation and deep-sequencing data. Nucleic Acids Res. 2011;39:D152–D157. doi: 10.1093/nar/gkq1027. [DOI] [PMC free article] [PubMed] [Google Scholar]
- 40.Vergoulis T., Vlachos I.S., Alexiou P., Georgakilas G., Maragkakis M., Reczko M., Gerangelos S., Koziris N., Dalamagas T., Hatzigeorgiou A.G. TarBase 6.0: capturing the exponential growth of miRNA targets with experimental support. Nucleic Acids Res. 2012;40:D222–D229. doi: 10.1093/nar/gkr1161. [DOI] [PMC free article] [PubMed] [Google Scholar]
- 41.Hsu S.D., Tseng Y.T., Shrestha S., Lin Y.L., Khaleel A., Chou C.H., Chu C.F., Huang H.Y., Lin C.M., Ho S.Y., et al. miRTarBase update 2014: an information resource for experimentally validated miRNA-target interactions. Nucleic Acids Res. 2014;42:D78–D85. doi: 10.1093/nar/gkt1266. [DOI] [PMC free article] [PubMed] [Google Scholar]
- 42.Chen G., Wang Z., Wang D., Qiu C., Liu M., Chen X., Zhang Q., Yan G., Cui Q. LncRNADisease: a database for long-non-coding RNA-associated diseases. Nucleic Acids Res. 2013;41:D983–D986. doi: 10.1093/nar/gks1099. [DOI] [PMC free article] [PubMed] [Google Scholar]
- 43.Li Y., Qiu C., Tu J., Geng B., Yang J., Jiang T., Cui Q. HMDD v2.0: a database for experimentally supported human microRNA and disease associations. Nucleic Acids Res. 2013;42:D1070–D1074. doi: 10.1093/nar/gkt1023. [DOI] [PMC free article] [PubMed] [Google Scholar]
- 44.Cancer Genome Atlas Research Network. Comprehensive genomic characterization of squamous cell lung cancers. Nature. 2012;489:519–525. doi: 10.1038/nature11404. [DOI] [PMC free article] [PubMed] [Google Scholar]
- 45.Jalali S., Bhartiya D., Lalwani M.K., Sivasubbu S., Scaria V. Systematic transcriptome wide analysis of lncRNA-miRNA interactions. PLoS One. 2013;8:e53823. doi: 10.1371/journal.pone.0053823. [DOI] [PMC free article] [PubMed] [Google Scholar]
- 46.Gong J., Liu W., Zhang J., Miao X., Guo A.Y. lncRNASNP: a database of SNPs in lncRNAs and their potential functions in human and mouse. Nucleic Acids Res. 2014;43:D181–D186. doi: 10.1093/nar/gku1000. [DOI] [PMC free article] [PubMed] [Google Scholar]
- 47.Friedman R.C., Farh K.K., Burge C.B., Bartel D.P. Most mammalian mRNAs are conserved targets of microRNAs. Genome Res. 2009;19:92–105. doi: 10.1101/gr.082701.108. [DOI] [PMC free article] [PubMed] [Google Scholar]
- 48.Kertesz M., Iovino N., Unnerstall U., Gaul U., Segal E. The role of site accessibility in microRNA target recognition. Nat. Genet. 2007;39:1278–1284. doi: 10.1038/ng2135. [DOI] [PubMed] [Google Scholar]
- 49.Betel D., Wilson M., Gabow A., Marks D.S., Sander C. The microRNA.org resource: targets and expression. Nucleic Acids Res. 2008;36:D149–D153. doi: 10.1093/nar/gkm995. [DOI] [PMC free article] [PubMed] [Google Scholar]
- 50.Rehmsmeier M., Steffen P., Hochsmann M., Giegerich R. Fast and effective prediction of microRNA/target duplexes. RNA. 2004;10:1507–1517. doi: 10.1261/rna.5248604. [DOI] [PMC free article] [PubMed] [Google Scholar]
- 51.Ritchie W., Flamant S., Rasko J.E. Predicting microRNA targets and functions: traps for the unwary. Nat. Methods. 2009;6:397–398. doi: 10.1038/nmeth0609-397. [DOI] [PubMed] [Google Scholar]
- 52.Li Y., Xu J., Chen H., Bai J., Li S., Zhao Z., Shao T., Jiang T., Ren H., Kang C., et al. Comprehensive analysis of the functional microRNA-mRNA regulatory network identifies miRNA signatures associated with glioma malignant progression. Nucleic Acids Res. 2013;41:e203. doi: 10.1093/nar/gkt1054. [DOI] [PMC free article] [PubMed] [Google Scholar]
- 53.Hafner M., Landthaler M., Burger L., Khorshid M., Hausser J., Berninger P., Rothballer A., Ascano M., Jr, Jungkamp A.C., Munschauer M., et al. Transcriptome-wide identification of RNA-binding protein and microRNA target sites by PAR-CLIP. Cell. 2010;141:129–141. doi: 10.1016/j.cell.2010.03.009. [DOI] [PMC free article] [PubMed] [Google Scholar]
- 54.Shamimuzzaman M., Vodkin L. Identification of soybean seed developmental stage-specific and tissue-specific miRNA targets by degradome sequencing. BMC Genom. 2012;13:310. doi: 10.1186/1471-2164-13-310. [DOI] [PMC free article] [PubMed] [Google Scholar]
- 55.Orom U.A., Derrien T., Beringer M., Gumireddy K., Gardini A., Bussotti G., Lai F., Zytnicki M., Notredame C., Huang Q., et al. Long noncoding RNAs with enhancer-like function in human cells. Cell. 2010;143:46–58. doi: 10.1016/j.cell.2010.09.001. [DOI] [PMC free article] [PubMed] [Google Scholar]
- 56.Cabili M.N., Trapnell C., Goff L., Koziol M., Tazon-Vega B., Regev A., Rinn J.L. Integrative annotation of human large intergenic noncoding RNAs reveals global properties and specific subclasses. Genes Dev. 2011;25:1915–1927. doi: 10.1101/gad.17446611. [DOI] [PMC free article] [PubMed] [Google Scholar]
- 57.Brunner A.L., Beck A.H., Edris B., Sweeney R.T., Zhu S.X., Li R., Montgomery K., Varma S., Gilks T., Guo X., et al. Transcriptional profiling of long non-coding RNAs and novel transcribed regions across a diverse panel of archived human cancers. Genome Biol. 2012;13:R75. doi: 10.1186/gb-2012-13-8-r75. [DOI] [PMC free article] [PubMed] [Google Scholar]
- 58.Cho S., Jang I., Jun Y., Yoon S., Ko M., Kwon Y., Choi I., Chang H., Ryu D., Lee B., et al. MiRGator v3.0: a microRNA portal for deep sequencing, expression profiling and mRNA targeting. Nucleic Acids Res. 2013;41:D252–D257. doi: 10.1093/nar/gks1168. [DOI] [PMC free article] [PubMed] [Google Scholar]
- 59.Yanai I., Benjamin H., Shmoish M., Chalifa-Caspi V., Shklar M., Ophir R., Bar-Even A., Horn-Saban S., Safran M., Domany E., et al. Genome-wide midrange transcription profiles reveal expression level relationships in human tissue specification. Bioinformatics. 2005;21:650–659. doi: 10.1093/bioinformatics/bti042. [DOI] [PubMed] [Google Scholar]
- 60.Guttman M., Rinn J.L. Modular regulatory principles of large non-coding RNAs. Nature. 2012;482:339–346. doi: 10.1038/nature10887. [DOI] [PMC free article] [PubMed] [Google Scholar]
- 61.Place R.F., Noonan E.J. Non-coding RNAs turn up the heat: An emerging layer of novel regulators in the mammalian heat shock response. Cell Stress Chaperones. 2013;19:159–172. doi: 10.1007/s12192-013-0456-5. [DOI] [PMC free article] [PubMed] [Google Scholar]
- 62.Pauli A., Valen E., Lin M.F., Garber M., Vastenhouw N.L., Levin J.Z., Fan L., Sandelin A., Rinn J.L., Regev A., et al. Systematic identification of long noncoding RNAs expressed during zebrafish embryogenesis. Genome Res. 2012;22:577–591. doi: 10.1101/gr.133009.111. [DOI] [PMC free article] [PubMed] [Google Scholar]
- 63.Dinger M.E., Amaral P.P., Mercer T.R., Pang K.C., Bruce S.J., Gardiner B.B., Askarian-Amiri M.E., Ru K., Solda G., Simons C., et al. Long noncoding RNAs in mouse embryonic stem cell pluripotency and differentiation. Genome Res. 2008;18:1433–1445. doi: 10.1101/gr.078378.108. [DOI] [PMC free article] [PubMed] [Google Scholar]
- 64.Frohlich H., Speer N., Poustka A., Beissbarth T. GOSim–an R-package for computation of information theoretic GO similarities between terms and gene products. BMC Bioinform. 2007;8:166. doi: 10.1186/1471-2105-8-166. [DOI] [PMC free article] [PubMed] [Google Scholar]
- 65.Li C., Li X., Miao Y., Wang Q., Jiang W., Xu C., Li J., Han J., Zhang F., Gong B., et al. SubpathwayMiner: a software package for flexible identification of pathways. Nucleic Acids Res. 2009;37:e131. doi: 10.1093/nar/gkp667. [DOI] [PMC free article] [PubMed] [Google Scholar]
- 66.Lottin S., Adriaenssens E., Dupressoir T., Berteaux N., Montpellier C., Coll J., Dugimont T., Curgy J.J. Overexpression of an ectopic H19 gene enhances the tumorigenic properties of breast cancer cells. Carcinogenesis. 2002;23:1885–1895. doi: 10.1093/carcin/23.11.1885. [DOI] [PubMed] [Google Scholar]
- 67.Yu Z., Willmarth N.E., Zhou J., Katiyar S., Wang M., Liu Y., McCue P.A., Quong A.A., Lisanti M.P., Pestell R.G. microRNA 17/20 inhibits cellular invasion and tumor metastasis in breast cancer by heterotypic signaling. Proc. Natl. Acad. Sci. U.S.A. 2010;107:8231–8236. doi: 10.1073/pnas.1002080107. [DOI] [PMC free article] [PubMed] [Google Scholar]
- 68.Li H., Bian C., Liao L., Li J., Zhao R.C. miR-17–5p promotes human breast cancer cell migration and invasion through suppression of HBP1. Breast Cancer Res. Treat. 2011;126:565–575. doi: 10.1007/s10549-010-0954-4. [DOI] [PubMed] [Google Scholar]
- 69.Suh E.J., Kabir M.H., Kang U.B., Lee J.W., Yu J., Noh D.Y., Lee C. Comparative profiling of plasma proteome from breast cancer patients reveals thrombospondin-1 and BRWD3 as serological biomarkers. Exp. Mol. Med. 2012;44:36–44. doi: 10.3858/emm.2012.44.1.003. [DOI] [PMC free article] [PubMed] [Google Scholar]
- 70.Stephens P., Edkins S., Davies H., Greenman C., Cox C., Hunter C., Bignell G., Teague J., Smith R., Stevens C., et al. A screen of the complete protein kinase gene family identifies diverse patterns of somatic mutations in human breast cancer. Nat. Genet. 2005;37:590–592. doi: 10.1038/ng1571. [DOI] [PubMed] [Google Scholar]
- 71.Mosca E., Alfieri R., Merelli I., Viti F., Calabria A., Milanesi L. A multilevel data integration resource for breast cancer study. BMC Syst. Biol. 2010;4:76. doi: 10.1186/1752-0509-4-76. [DOI] [PMC free article] [PubMed] [Google Scholar]
- 72.Tavazoie S.F., Alarcon C., Oskarsson T., Padua D., Wang Q., Bos P.D., Gerald W.L., Massague J. Endogenous human microRNAs that suppress breast cancer metastasis. Nature. 2008;451:147–152. doi: 10.1038/nature06487. [DOI] [PMC free article] [PubMed] [Google Scholar]
- 73.Yan Z., Xiong Y., Xu W., Gao J., Cheng Y., Wang Z., Chen F., Zheng G. Identification of hsa-miR-335 as a prognostic signature in gastric cancer. PLoS One. 2012;7:e40037. doi: 10.1371/journal.pone.0040037. [DOI] [PMC free article] [PubMed] [Google Scholar]
- 74.Liu C., Mallick B., Long D., Rennie W.A., Wolenc A., Carmack C.S., Ding Y. CLIP-based prediction of mammalian microRNA binding sites. Nucleic Acids Res. 2013;41:e138. doi: 10.1093/nar/gkt435. [DOI] [PMC free article] [PubMed] [Google Scholar]
- 75.Paci P., Colombo T., Farina L. Computational analysis identifies a sponge interaction network between long non-coding RNAs and messenger RNAs in human breast cancer. BMC Syst. Biol. 2014;8:83. doi: 10.1186/1752-0509-8-83. [DOI] [PMC free article] [PubMed] [Google Scholar]
- 76.Ma C., Nong K., Zhu H., Wang W., Huang X., Yuan Z., Ai K. H19 promotes pancreatic cancer metastasis by derepressing let-7's suppression on its target HMGA2-mediated EMT. Tumour Biol. 2014;35:9163–9169. doi: 10.1007/s13277-014-2185-5. [DOI] [PubMed] [Google Scholar]
- 77.Kallen A.N., Zhou X.B., Xu J., Qiao C., Ma J., Yan L., Lu L., Liu C., Yi J.S., Zhang H., et al. The imprinted H19 lncRNA antagonizes let-7 microRNAs. Mol. Cell. 2013;52:101–112. doi: 10.1016/j.molcel.2013.08.027. [DOI] [PMC free article] [PubMed] [Google Scholar]
- 78.Liu X.H., Sun M., Nie F.Q., Ge Y.B., Zhang E.B., Yin D.D., Kong R., Xia R., Lu K.H., Li J.H., et al. Lnc RNA HOTAIR functions as a competing endogenous RNA to regulate HER2 expression by sponging miR-331–3p in gastric cancer. Mol. Cancer. 2014;13:92. doi: 10.1186/1476-4598-13-92. [DOI] [PMC free article] [PubMed] [Google Scholar]
- 79.Wang L., Feng Z., Wang X., Wang X., Zhang X. DEGseq: an R package for identifying differentially expressed genes from RNA-seq data. Bioinformatics. 2010;26:136–138. doi: 10.1093/bioinformatics/btp612. [DOI] [PubMed] [Google Scholar]
- 80.Makino H., Tajiri T., Miyashita M., Sasajima K., Anbazhagan R., Johnston J., Gabrielson E. Differential expression of TCEAL1 in esophageal cancers by custom cDNA microarray analysis. Dis. Esophagus. 2005;18:37–40. doi: 10.1111/j.1442-2050.2005.00432.x. [DOI] [PubMed] [Google Scholar]
- 81.Novikova I.V., Hennelly S.P., Sanbonmatsu K.Y. Structural architecture of the human long non-coding RNA, steroid receptor RNA activator. Nucleic Acids Res. 2012;40:5034–5051. doi: 10.1093/nar/gks071. [DOI] [PMC free article] [PubMed] [Google Scholar]
Associated Data
This section collects any data citations, data availability statements, or supplementary materials included in this article.