Abstract
Study Objectives:
Upper airway stimulation (UAS) is a new approach to treat moderate-to-severe obstructive sleep apnea. Recently, 12-month data from the Stimulation Treatment for Apnea Reduction (STAR) trial were reported, evaluating the effectiveness of UAS in patients intolerant or non-adherent to continuous positive airway pressure therapy. Our objective was to assess the cost-effectiveness of UAS from a U.S. payer perspective.
Design:
A 5-state Markov model was used to predict cardiovascular endpoints (myocardial infarction [MI], stroke, hypertension), motor vehicle collisions (MVC), mortality, quality-adjusted life years (QALYs), and costs. We computed 10-year relative event risks and the lifetime incremental cost-effectiveness ratio (ICER) in $/QALY, comparing UAS therapy to no treatment under the assumption that the STAR trial-observed reduction in mean apnea-hypopnea index from 32.0 to 15.3 events/h was maintained. Costs and effects were discounted at 3% per year.
Setting:
U.S. healthcare system; third-party payer perspective.
Patients or Participants:
83% male cohort with mean age of 54.5 years.
Interventions:
UAS vs. no treatment.
Measurements and Results:
UAS substantially reduced event probabilities over 10 years (relative risks: MI 0.63; stroke 0.75; MVC 0.34), and was projected to add 1.09 QALYs over the patient's lifetime. Costs were estimated to increase by $42,953, resulting in a lifetime ICER of $39,471/QALY.
Conclusions:
Relative to the acknowledged willingness-to-pay threshold of $50,000–$100,000/QALY, our results indicate upper airway stimulation is a cost-effective therapy in the U.S. healthcare system.
Citation:
Pietzsch JB, Liu S, Garner AM, Kezirian EJ, Strollo PJ. Long-term cost-effectiveness of upper airway stimulation for the treatment of obstructive sleep apnea: a model-based projection based on the STAR Trial. SLEEP 2015;38(5):735–744.
Keywords: obstructive sleep apnea, cost effectiveness, hypoglossal nerve, implantable neurostimulators, upper airway stimulation
INTRODUCTION
Obstructive sleep apnea (OSA) is a disorder characterized by recurrent upper airway obstruction during sleep. It affects 6% to 7% of the population1,2 and is associated with increased cardiovascular disease, daytime sleepiness, and reduced quality of life.3 These sequelae are especially pronounced in patients with moderate-to-severe OSA, defined as an apneahypopnea index (AHI) greater than 15 events per hour. Effective diagnosis and treatment of this condition can reduce and control this substantial disease burden.
Continuous positive airway pressure (CPAP) is the first-line treatment for OSA, and it has been proven effective in reducing AHI, cardiovascular risks, and daytime sleepiness. However, many patients are unable to tolerate CPAP, with resulting adherence rates between 39% and 60%.4–6
Recently, upper airway stimulation (UAS) has been introduced as a new therapeutic approach for patients with moderate-to-severe OSA who are intolerant of CPAP therapy. UAS utilizes an implantable device to stimulate the hypoglossal nerve and activate the genioglossus muscle, thereby promoting upper airway patency and alleviating OSA.7
A recent multicenter, prospective, single-group study (the STAR Trial) showed that UAS led to significant objective and subjective improvements in OSA.7 Specifically, in a cohort of CPAP-intolerant patients with moderate-to-severe OSA and a mean age of 54.5 years, mean AHI decreased from 32.0 to 15.3 events per hour. A second study phase examined the outcomes of randomized therapy withdrawal, and showed marked increase in AHI among patients withdrawn from UAS therapy, compared to no significant differences from the 12-month AHI value among patients who remained on UAS therapy.
The objective of this study was to assess the long-term cost-effectiveness of UAS from a U.S. payer perspective, as compared to no treatment. CPAP was not considered as a comparator, as UAS treatment is indicated in patients who have been confirmed to be intolerant of positive airway pressure treatment.
METHODS
Overview
We developed a state-transition (Markov) model to assess the impact of UAS treatment using the Inspire Upper Airway Stimulation system (Inspire Medical Systems; Maple Grove, MN) compared to no treatment. The model's disease-progression component was based in significant part on a previously published Markov model for investigating the cost-effectiveness of CPAP therapy.8 The model projects 3 clinical endpoints (myocardial infarction [MI], stroke, and hypertension), the incidence of motor vehicle collisions (MVC), mortality, quality-adjusted life years (QALYs), and costs.
To compute transition probabilities, we utilized univariate and multivariate risk equations from cohort studies and published data described in greater detail below. Values for other input parameters were derived from systematic searches of literature catalogued in PubMed. Therapy- and procedure-related costs were obtained from average Medicare reimbursement rates for fiscal year 2013. Assumptions made in the base-case analysis were assessed in deterministic and probabilistic sensitivity analyses.
Model Structure and Modeling Framework
The Markov model follows 2 simulated cohorts with moderate-to-severe OSA: UAS-treated and untreated. The same model structure is used for the 2 competing strategies. The model employs a cycle length of 1 month with half-cycle correction. Except where otherwise indicated, all analyses were conducted using a lifetime horizon.
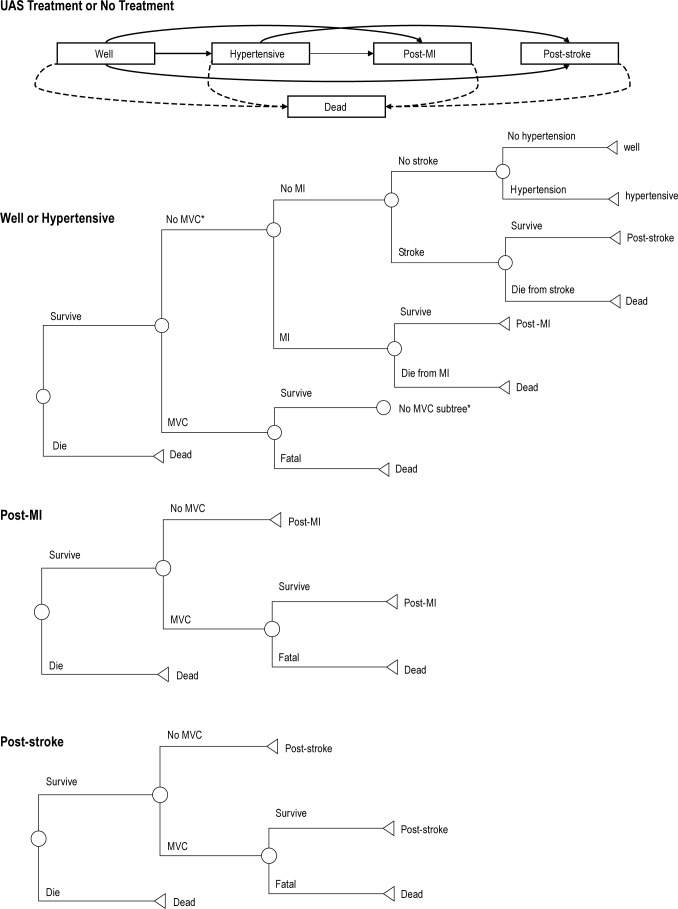
To represent clinical disease progression, the Markov model incorporates 5 primary health states, and tracks the occurrence of stroke, MI, MVC, and death. To account for different mortality risks and costs after the tracked cardiovascular events, the model includes post-stroke and post-MI states in addition to the primary health states. MVC events were tracked but not included in the model as separate states. See Figure 1 for a graphical representation of the model.
Figure 1.
The primary outcome measure was the incremental cost-effectiveness ratio (ICER), defined as the incremental direct costs of medical treatment and consequences divided by the incremental health benefits expressed as quality-adjusted life-years (QALYs). All costs were estimated in 2013 dollars. In line with current guidelines,9 costs and effects were discounted at 3% per year.
The ICER is a common metric used in health-economic analyses to assess the value of an intervention.10 It provides the ratio of added costs required to achieve a defined improvement in outcome, measured in QALY, taking into account both gains in survival and health-related quality of life.9 A therapy is considered to be a good value investment for the healthcare system, if its associated ICER is below the respective healthcare system's willingness-to-pay threshold. In the U.S., the commonly referred threshold is between $50,000 and $100,000 per QALY gained.10 Recent policy comments suggest both of these estimates are rather conservative, and advocate a range of $100,000 to $150,000 per QALY instead.11
Input Parameters
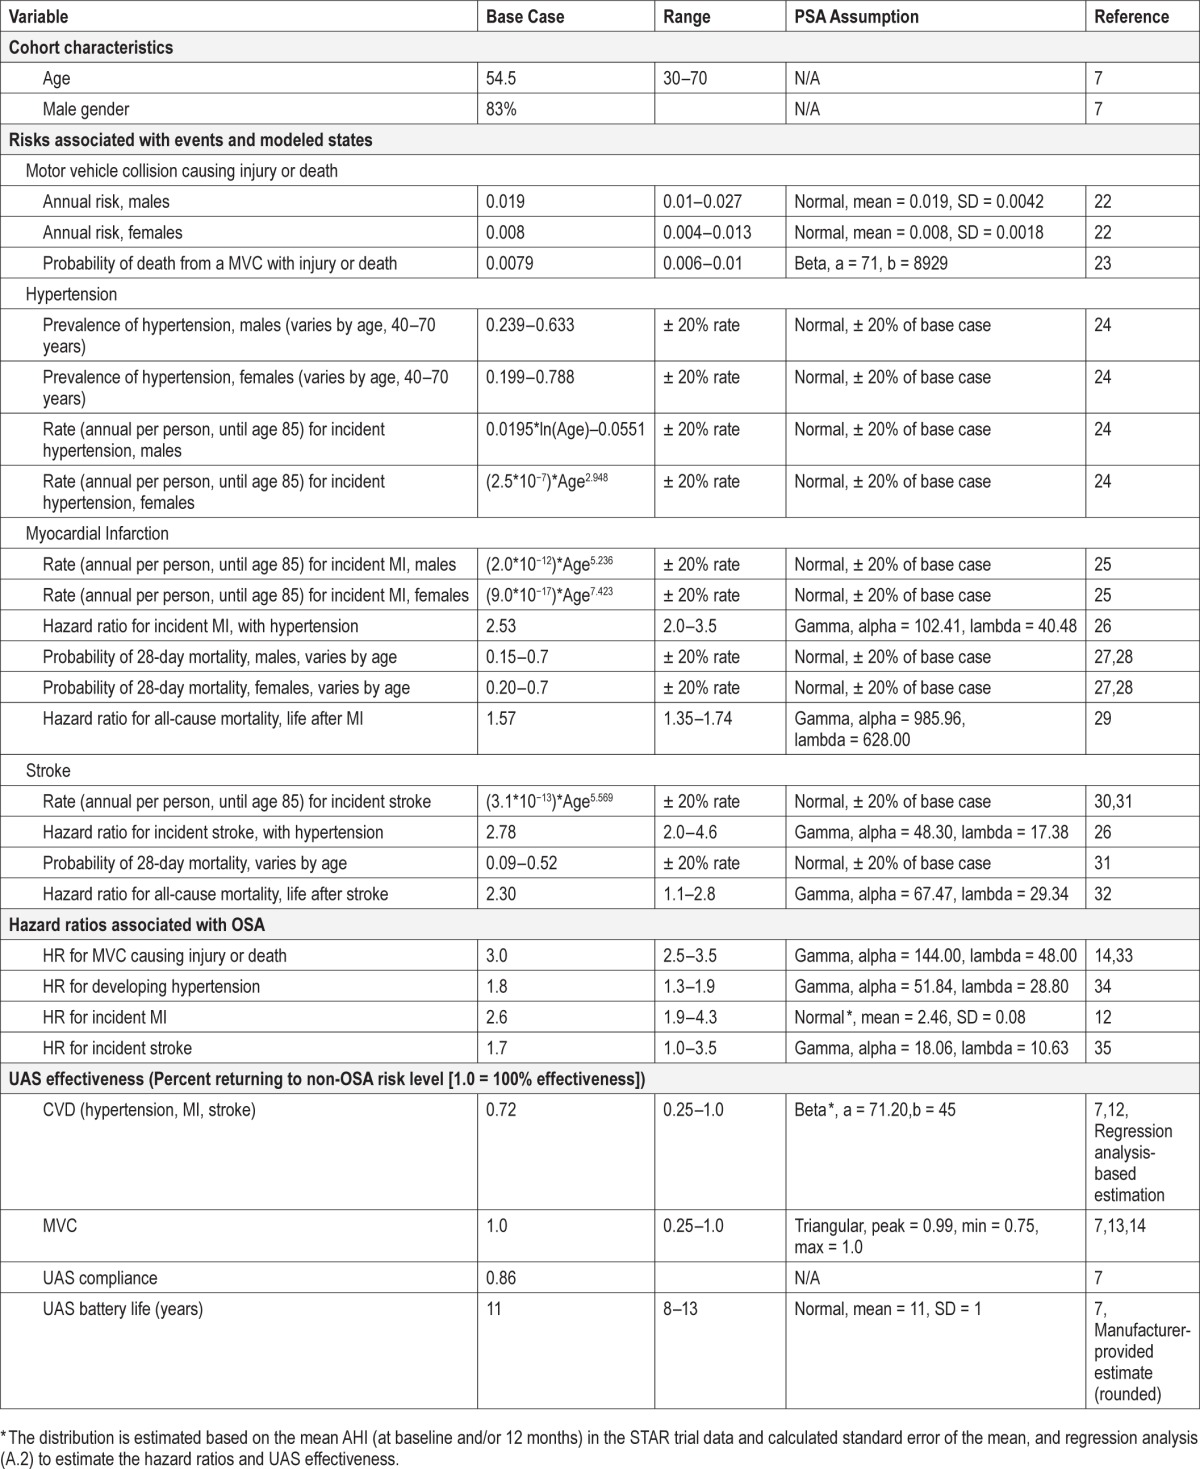
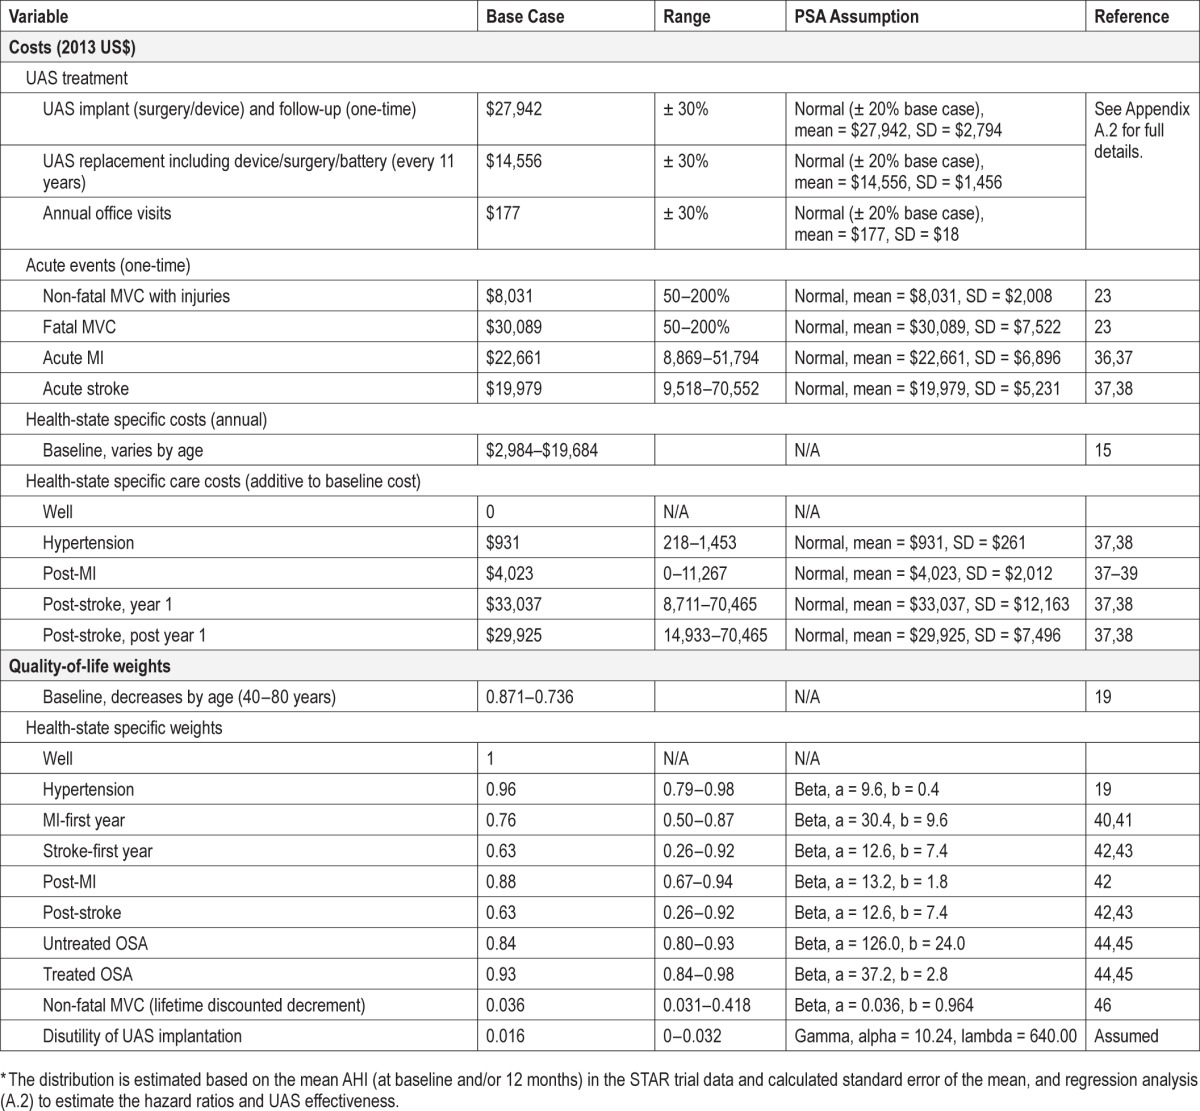
All baseline patient characteristics were modeled identically to those observed in the STAR trial (average age 54.5 years; 83% male; mean AHI 32.0 at baseline). For the modeled UAS cohort, we assumed a mean AHI of 15.3, as was observed at 12 months in the STAR trial. For the untreated cohort, we assumed the baseline mean AHI of 32.0 would be maintained. All other input parameters were derived from systematic searches of the PubMed literature and from published statistics and databases (Table 1).
Table 1.
Model input parameters.
Therapy Effectiveness
To obtain an estimate for the expected reduction in cardiovascular event risk between the UAS-treated and the untreated cohort (mean AHI 15.3 vs. 32.0), we fitted a polynomial regression function based on published longitudinal data12 to estimate the relationship between AHI and elevated cardiovascular risk. Specifically, we employed the observed cardiovascular risk of snorers (AHI of 3.5) to define the baseline cardiovascular event risk of the general population, and then computed hazard ratios for AHI 15.3 and 32.0. These hazard ratios were then multiplied by the baseline probability of cardiovascular events to obtain estimates for the cardiovascular event risks in both modeled cohorts. The approach and detailed computations are outlined in Appendix A.1 (supplemental material).
Using this approach, we obtained hazard ratios of 1.45 and 2.61 for the UAS-treated and untreated cohorts, respectively, suggesting that UAS therapy reduces elevated cardiovascular risk by 71.4%. We further adjusted this cardiovascular risk reduction by assuming that only the 86% of UAS-treated patients who reported daily use of the therapy would incur this risk reduction. For the full cohort, this led to an overall estimate of cardiovascular event risk reduction of 62%.
To confirm the validity of this estimate, we utilized a second measure of treatment effect that is increasingly used by the medical community to estimate overall risk reduction: the percentage of patients who experienced ≥ 50% reduction in mean AHI to an absolute level below 15. In the STAR trial, 61% (n = 78/126) of patients met both of these objectives. Under the assumption that these 61% normalized their cardiovascular risk to baseline, consistent with published findings of the referenced long-term observational study,12 and the conservative assumption that the other 39% of patients did not receive any cardiovascular benefit, this yields an estimated overall cardiovascular risk reduction similar to the 62% obtained from regression analysis above. See Appendix A.1 for further detail.
The risk of motor vehicle collisions (MVC) was assumed to be reduced to the general population risk under UAS treatment. This assumption was made, first, based on the significant difference in Epworth Sleepiness Scale (ESS) scores observed among subjects in the STAR trial (mean ESS of 11.6 at baseline compared to 7.0 at 12 months, a difference of 4.6), which was almost double the difference of 2.37 reported in a recent meta-analysis of studies comparing CPAP to no treatment.13 Second, based on the established evidence that CPAP therapy reduces elevated MVC risk to baseline levels.14
Costs
Costs were considered from a U.S. third-party payer perspective, including only direct healthcare costs. Age-specific baseline healthcare costs were based on average U.S. expenditures.15 Incremental costs associated with the treatment of hypertension, MI, and stroke—and elevated costs after MI or stroke events—were based on reports in the published literature. Healthcare costs associated with non-fatal and fatal MVCs were based on a U.S. Department of Transportation study.
Unless derived from FY 2013 Medicare reimbursement schedules, all cost estimates were converted to 2013 U.S. dollars using the general consumer price index for the United States.16
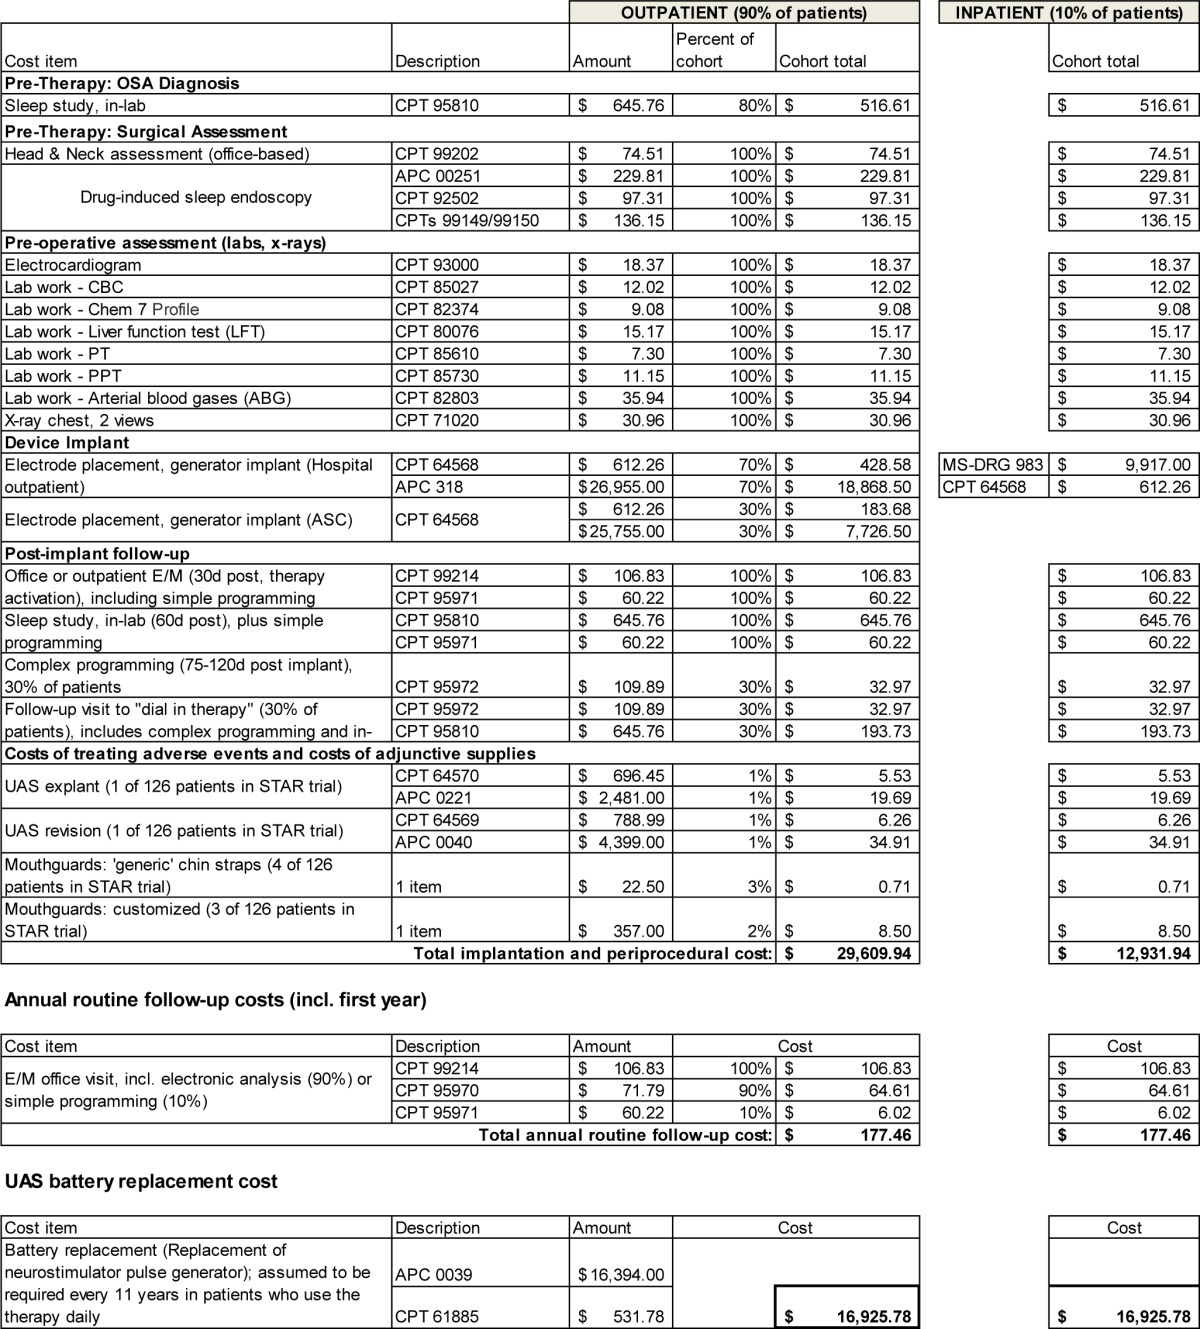
UAS costs included all therapy-related preprocedural and periprocedural costs, the cost of actual surgical implantation of the stimulation device, annual follow-up costs subsequent to implantation, and the cost of eventual battery replacement for the stimulator.
Specifically, preprocedural costs included an attended polysomnogram in a sleep lab for 80% of patients, and an otolaryngologist-head and neck surgeon office visit, drug-induced sleep endoscopy, and costs for preprocedural imaging and lab work for all patients. In line with data from the STAR trial and based on experience of the clinical co-authors (EJK, PJS), it was assumed that 20% of patients had already completed their polysomnogram within a year prior to UAS implantation and thus did not require a repeat diagnosis.
Actual implantation was assumed to be performed as an outpatient procedure in 90% of cases, with the remaining 10% performed as an inpatient procedure. This assumption is supported by the STAR trial and early commercial experience with UAS, as well as Medicare's “two-midnight stay” guidance.17 This reimbursement guidance was implemented in 2013 and requires stays involving less than two midnights to be treated as outpatient cases. In the STAR trial, 16% of patients were discharged the day of implantation, 79% the next day, and 6% were discharged two days after implantation.
For the outpatient setting, costs included the cost of electrode placement and generator implant, under the assumption that 70% of procedures would be performed in a hospital outpatient setting, and 30% in an ambulatory surgical center (ASC) setting. In line with current reimbursement rules, implantation costs also included the cost of initial follow-up 7–14 days post-procedure. In the inpatient setting, costs were assumed to be the national average reimbursement amount of the applicable 2013 Medicare Severity Diagnosis-related Group (MS-DRG) code. Costs for the implant are to be covered by providers from the respective reimbursement amounts, both in the outpatient and inpatient case, and are therefore not separately accounted for.
Therapy activation 30 days after implantation included the costs for an evaluation and management visit and for simple programming of the stimulator. Further, the cost of a follow-up in-laboratory titration polysomnogram was included at 60 days after implantation. This visit was assumed to include simple programming. Based on current clinical experience, we further assumed that 30% of patients required complex programming at 75–120 days post-implant, and an additional 30% would require a follow-up visit with complex programming and repeat titration polysomnogram. To account for costs of procedure-related adverse events, we included costs of one device revision and one explant in the STAR trial cohort of n = 126 patients, as well as the costs for 4 chin straps and 3 customized mouth guards.
In the second and all following years, costs of one annual routine follow-up visit were included. These were assumed to include costs for an evaluation and management visit, electronic analysis for 90% of cases, and simple programming (adjustment of settings) for the remaining 10%. Battery replacement was assumed to occur every 11 years in patients using the device daily, and the costs associated with generator replacement (procedure, new device) were included. Full details for UAS-related costs, including specific reimbursement codes, are provided in Appendix A.2 (supplemental material).
For the comparator group (untreated patients), the model assumed only baseline healthcare costs, costs related to the modeled clinical and nonclinical events, and any applicable follow-on costs to these events. No regular annual office or sleep lab visits were considered.
Mortality and Health-Related Quality of Life
Age- and gender-specific baseline mortality rates were based on 2008 U.S. life tables.18 Adjusted mortality rate excluding CVD mortality to avoid double counting were multiplied with event-specific hazard ratios where applicable (Table 1). Disease-specific mortality rates were adjusted for 1 cycle to reflect increased mortality immediately after the event, which includes the post-MI and post-stroke states.
Utility estimates for the included disease states were obtained from the published literature and were adjusted for different age groups by application of a multiplicative factor.19 UAS-treated patients were assumed to achieve the same health-related quality of life as patients treated with continuous positive airway pressure (CPAP). This assumption was made based on the STAR trial-observed improvements in values for ESS and the Functional Outcomes of Sleep Questionnaire (FOSQ). STAR trial results suggested that treated patients achieved higher absolute improvement in these scores than reported in recent meta-analyses of CPAP studies.13,20 To account for potential temporary disutility associated with UAS implantation and programming, we assumed a utility decrement of 0.2 for a total of 4 weeks.
Analysis of Uncertainty
Comprehensive one-way and probabilistic sensitivity analyses (PSA) were conducted to evaluate the effects of parameter uncertainty. The parameter ranges (Table 1) were derived from the literature, data from the STAR trial, and, where applicable, from expert opinion. For one-way sensitivity analyses, the ICER was computed for each scenario. For the PSA, we performed Monte Carlo simulations (5,000 samples each) separately for male and female cohorts. A PSA involves randomly selecting values from the known or estimated distributions for all input parameters, running the model, and repeating the process. We drew values from 40 distributions. The set of 5,000 results produced characterizes the probability distributions of outcomes resulting from the uncertainty around the input parameters. Results were presented as cost-effectiveness acceptability curves (CEACs), showing the probability UAS is cost-effective depending on a range of willingness-to-pay thresholds between $0 and $100,000 per QALY.
RESULTS
Base Case Results
At base-case assumptions, UAS treatment substantially reduced the risk of cardiovascular events, MVCs, and mortality. The 10-year relative risks of MI and stroke were 0.63 and 0.75, respectively. The 10-year relative risk in expected number of MVCs was 0.34. Over the patient's lifetime, these relative risks were less pronounced (MI 0.81, stroke 0.96, number of MVCs 0.36), owing to the fact that additional events may occur because of increased survival.
The reduction in cardiovascular and MVC event risks resulted in increased mean survival of 1.37 LYs (21.97 vs. 20.60 LYs). Further, this gain in life expectancy, combined with improved health-related quality of life because of fewer clinical events and the generally higher quality of life in treated vs. untreated patients, led to a mean QALY gain of 1.70 over the patient's lifetime (14.90 vs. 13.20 QALYs). Discounted, these gains were 0.73 LYs (15.44 vs. 14.71) and 1.09 QALYs (10.63 vs. 9.54 QALYs). See Table 2 for full details.
Table 2.
Health outcomes and incremental cost-effectiveness results (83% male).

Total costs discounted over a lifetime were $286,497 for UAS compared to $243,543 for no treatment, an incremental difference of $42,953. The discounted ICER was $39,471/ QALY gained (Table 2).
Uncertainty Analyses
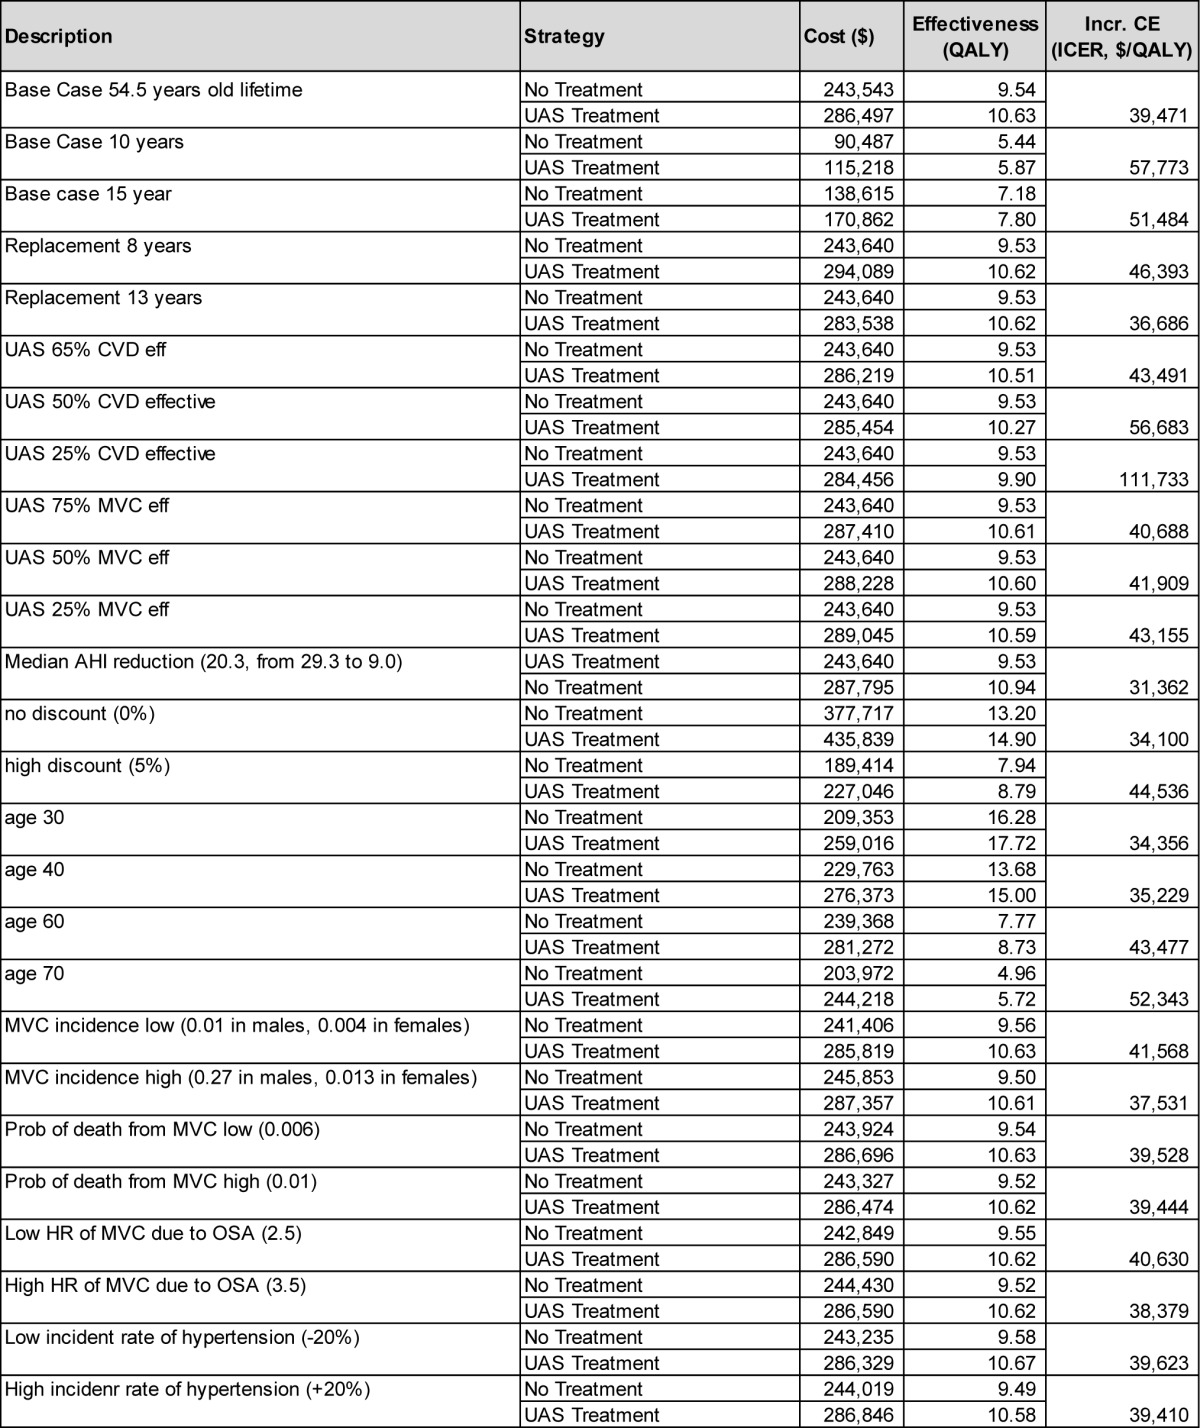
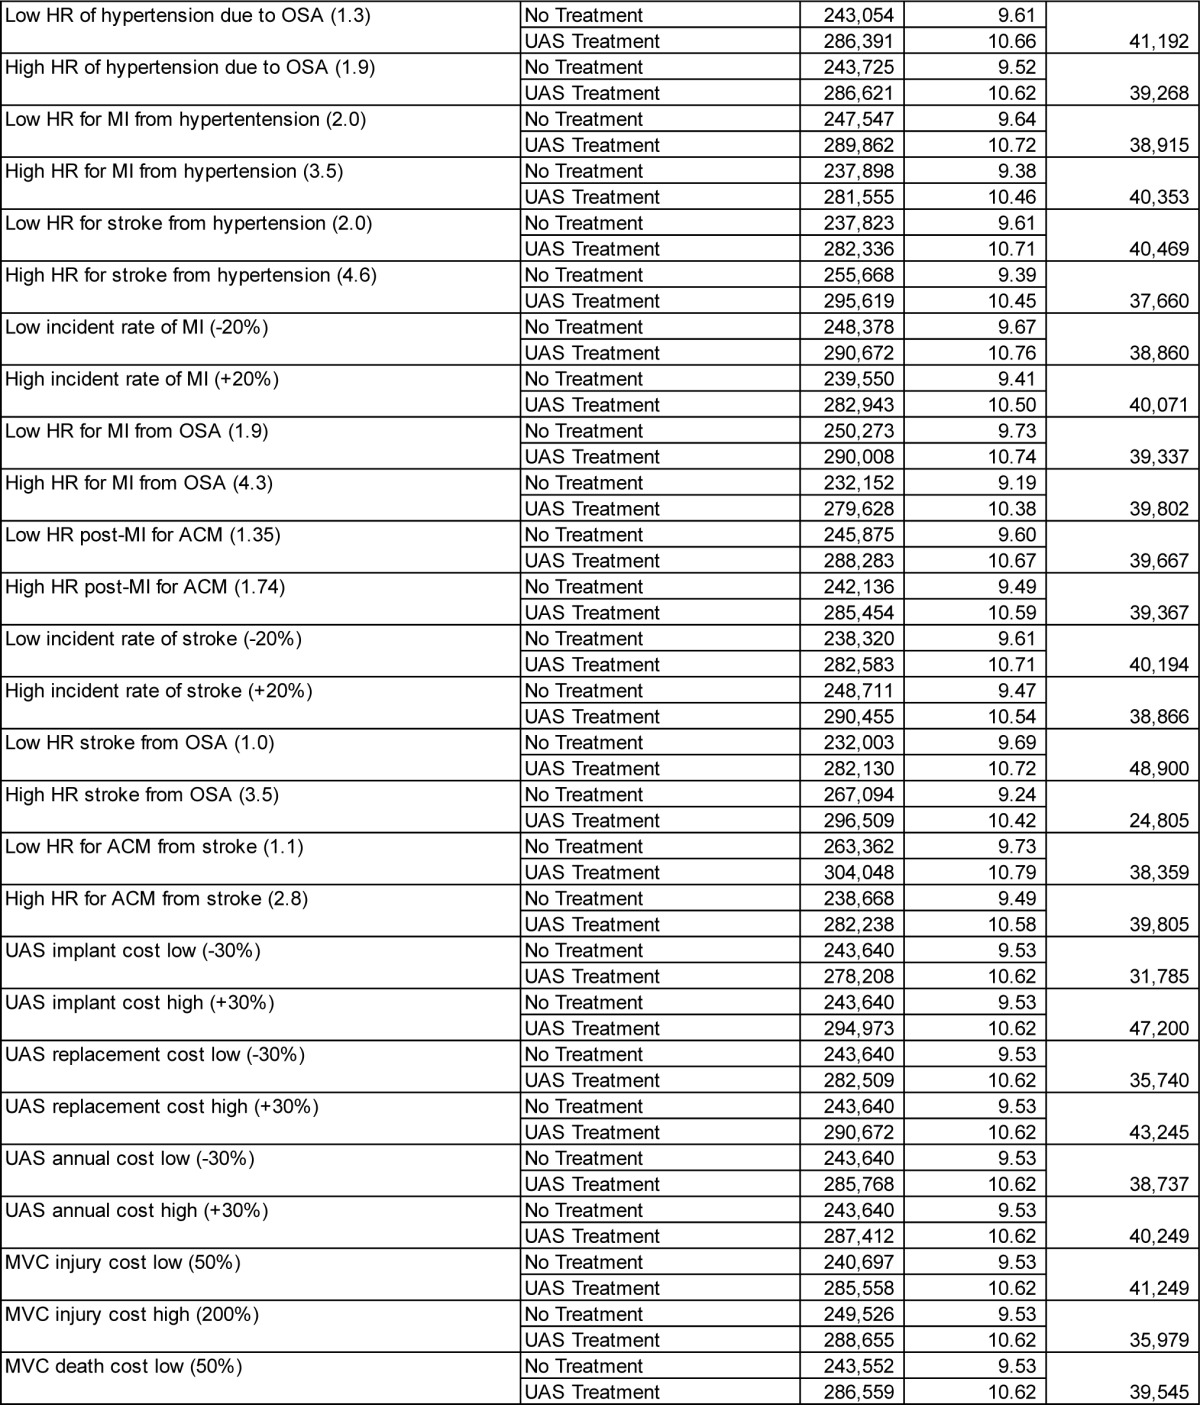
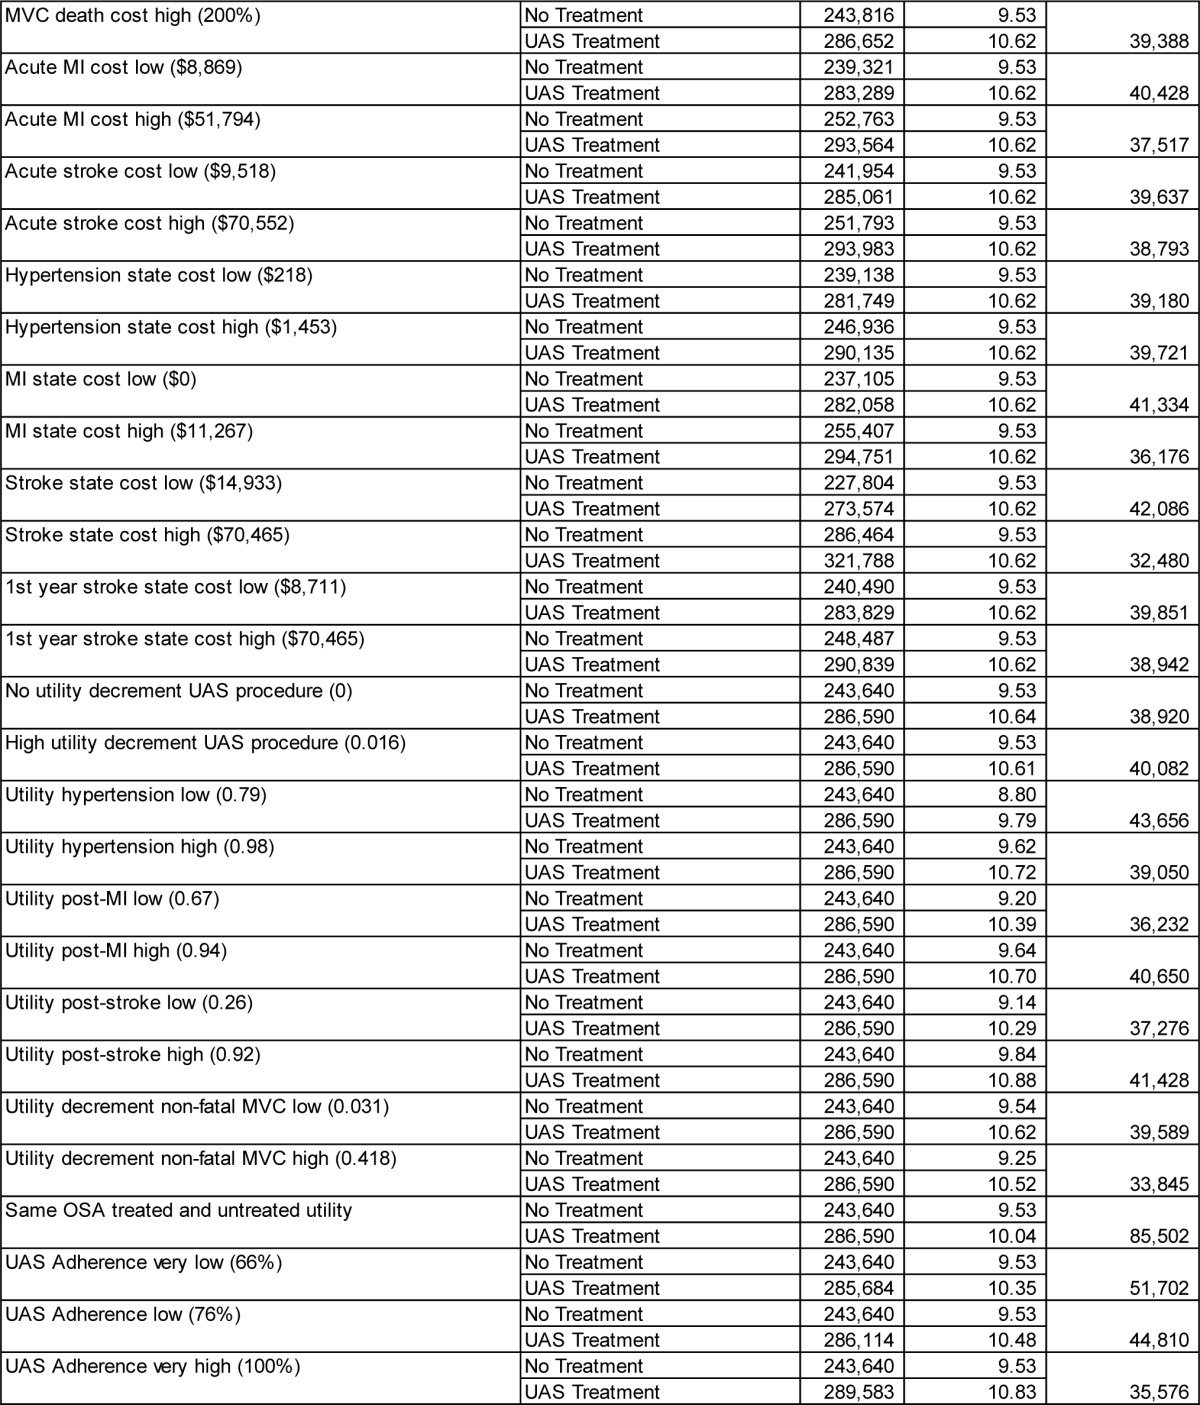
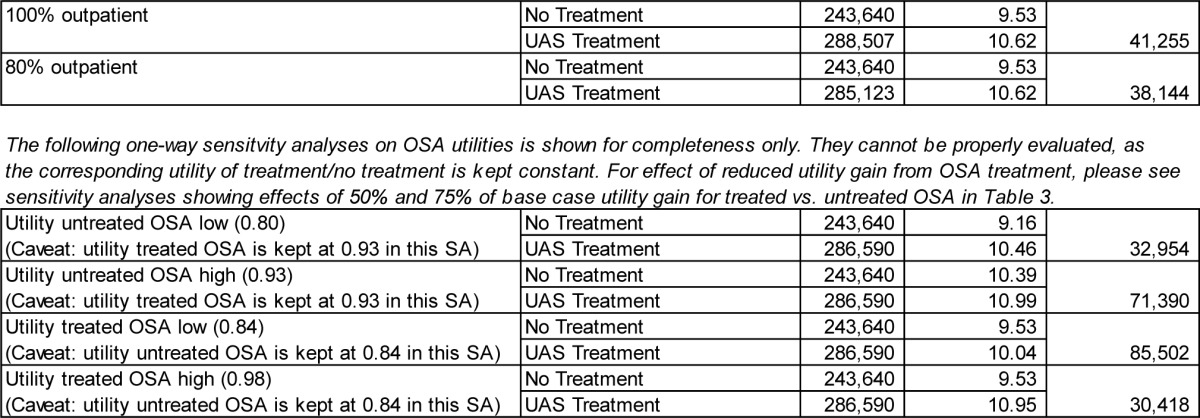
The performed comprehensive deterministic sensitivity analyses showed that varying parameters across the assumed ranges shown in Table 1 did not materially change the cost-effectiveness results. The ICERs remained below $50,000 per QALY gained in most cases, except for some extreme assumptions, e.g., no assumed gain in health-related quality of life between UAS-treated and untreated patients. An overview of key scenario results is shown in Table 3, with the full results for all parameters shown in the supplemental material (Table A.3).
Table 3.
Selected deterministic sensitivity analysis results (remaining scenarios shown in the supplemental material).
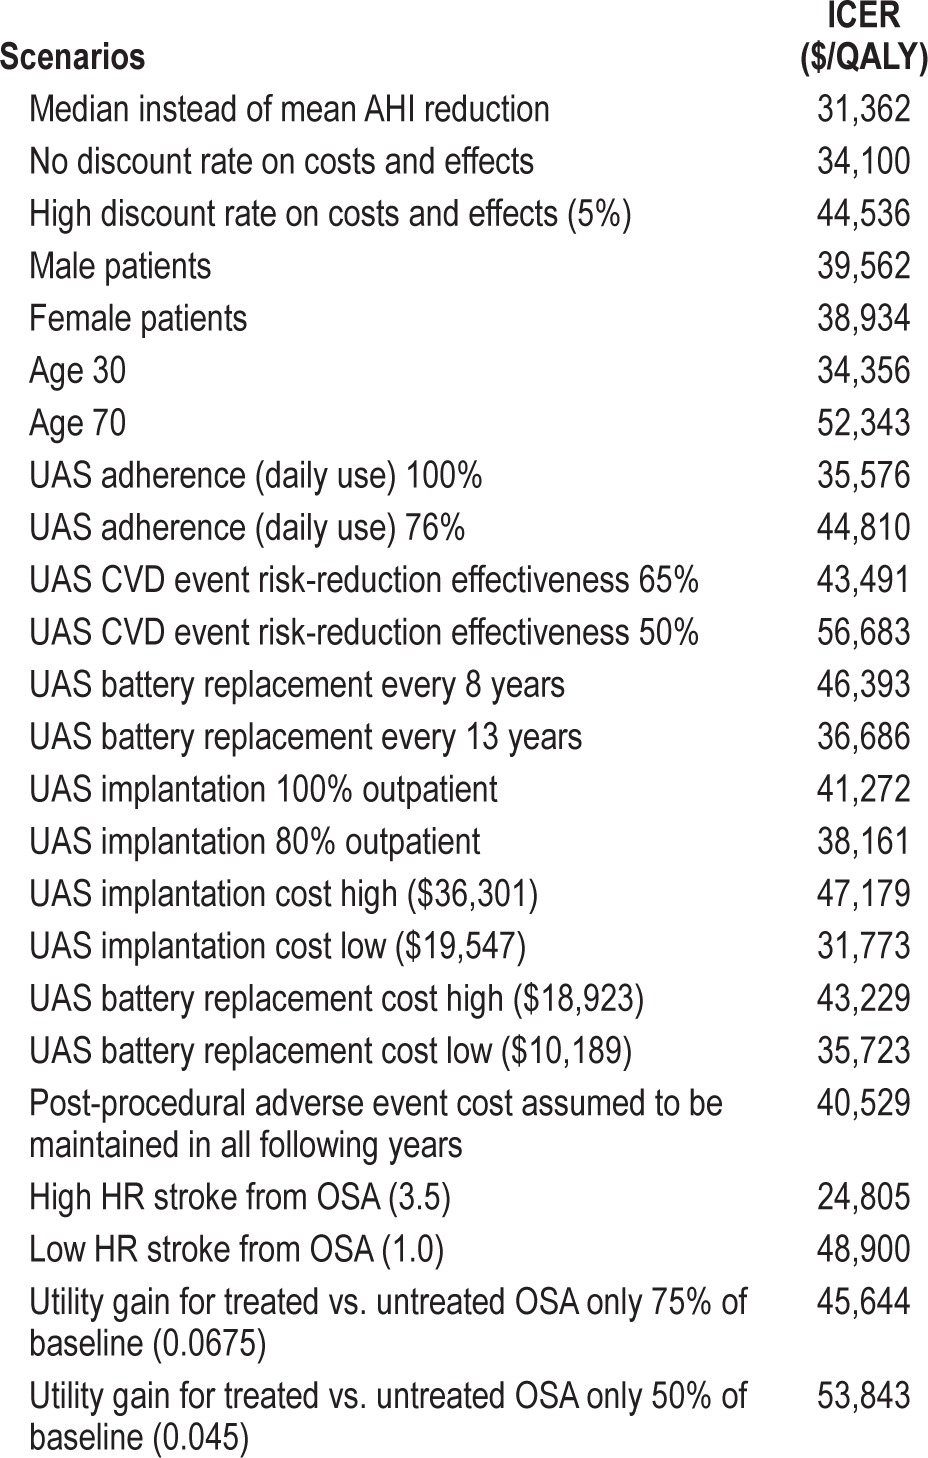
Varying the age of the modeled cohort did not materially change the ICER. The ICER exceeded $50,000/QALY gained only when the mean age was 70 years or higher. Men had a slightly higher ICER than women (at base-case values, men vs. women: $39,579 vs. $38,951 per QALY gained).
If the model horizon is chosen as 10 years instead of lifetime, UAS treatment has an ICER of $57,733/QALY gained. Reducing the model horizon to even shorter timeframes increased the ICER further, because the upfront cost for UAS implantation is fully accounted for in these cases, while associated downstream savings resulting from event reductions are only partially taken into account.
Assuming effectiveness at reducing cardiovascular event risks to be lower than the 71.4% considered in the base case (prior to usage adjustment) leads to gradual increase in the ICER. At 65% effectiveness, the ICER is $43,491/QALY gained; at 50% effectiveness, the ICER is $56,683/QALY gained. A reduction in UAS effectiveness in reducing MVC event rates from the base case 100% to 50% yields an ICER of $41,909/QALY gained.
If there is only a 50% gain in health-related quality of life from OSA treatment (that is, the utility gain is assumed to increase to only 0.885), the ICER of UAS treatment increases to $53,843/QALY gained.
The STAR trial data showed a larger difference in median AHI between baseline and 12-month values (29.3; 9.0), compared to mean AHI (32.0; 15.3). Using median instead of mean AHI levels for the analysis—and thereby running a scenario that emphasizes effectiveness observed in therapy responders— leads to a reduction in the ICER to $31,362/QALY gained.
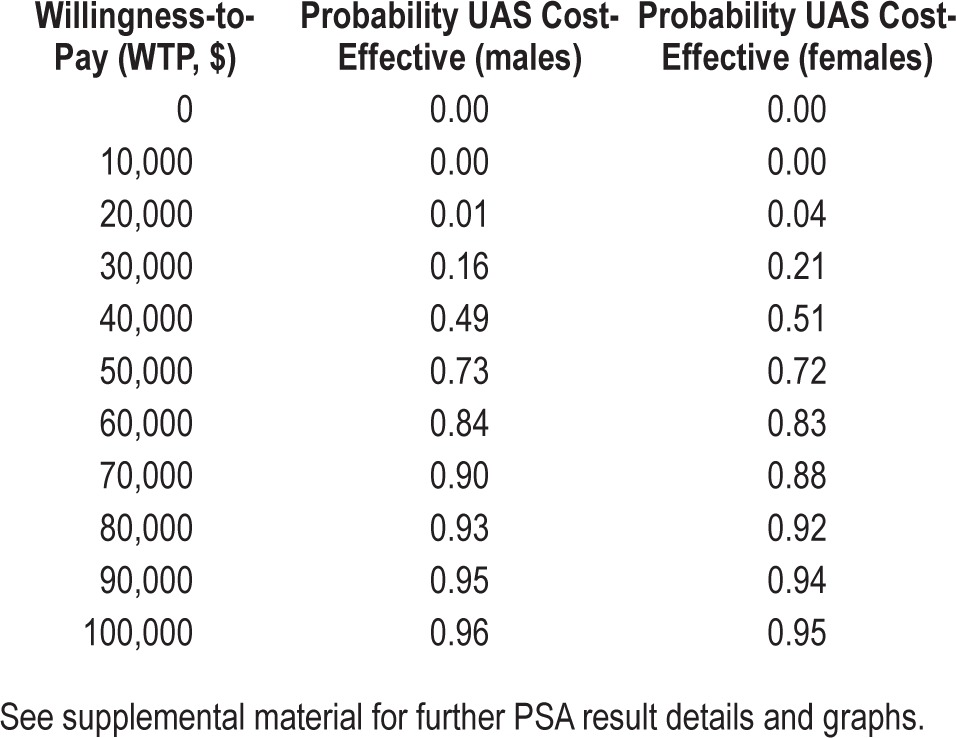
In probabilistic sensitivity analyses, based on separate simulation of male and female cohorts, UAS treatment is preferred in 73% of the time at a willingness-to-pay threshold of $50,000 per QALY, and 96% of the time at $100,000 per QALY, with slight variation between the simulated male and female cohorts. Table 4 shows the cost-effectiveness acceptability for both genders at willingness-to-pay thresholds between $0 and $100,000 per QALY. Further graphs, including ICE scatter plots, are included in the supplemental material.
Table 4.
Probabilistic sensitivity analysis (PSA) results, shown as cost-effectiveness acceptability for male and female cohorts, based on 5,000 Monte Carlo simulations each.
DISCUSSION
With an incremental cost-effectiveness ratio below the commonly accepted threshold of $50,000/QALY over a wide range of assumptions, UAS is a cost-effective strategy when compared to other, well-accepted medical treatments. UAS offers great value over time, despite the upfront cost of the device and implantation. The value of UAS stems from the STAR trial data, with expected substantial reductions in clinical events and motor vehicle collisions projected over the patient's lifetime, as well as resulting gains in quality of life and survival. The projected 10-year reductions in cardiovascular events by 25% to 37% and the projected gain in total quality-adjusted life expectancy of 1.7 years (undiscounted) compare favorably to a wide range of established device-based therapies for chronic medical conditions.
Because UAS treatment is a therapy option for patients who cannot use positive airway pressure therapy or other alternatives, our analysis only compared UAS to no treatment. This is clinically meaningful, as it reflects the reality with UAS treatment. Nevertheless, it still seems appropriate to put our findings in perspective with previously conducted cost-effectiveness analyses of CPAP, specifically the study that provided part of the underlying model used in the current analysis.8 In that study, CPAP was found to have an incremental cost-effectiveness ratio of $15,915/QALY when compared to no treatment. The discounted cost and QALY differences were $26,722 and 1.68, respectively. For the present analysis, using the same cohort assumptions (50-year-old male patients) and compared to no treatment, we found that UAS results in an ICER of $39,437/ QALY, resulting from cost difference of $45,801 and a QALY gain of 1.16. While both therapies have favorable health-economic profiles, UAS is less cost-effective than CPAP.
Our study is subject to a number of limitations. First, as in any model-based health-economic projection, long-term clinical- and cost-effectiveness were estimated based on short-term clinical data; actual long-term effectiveness of UAS therapy may vary. However, 18-month effectiveness data for UAS that was recently reported in a publicly accessible FDA report21 suggests a maintained, stable treatment effect in line with the 12-month results. In our sensitivity analyses, we tested the impact of reduced treatment effectiveness through modeled scenarios of lower effectiveness of cardiovascular event risk reduction and an absence of health-related quality of life benefits, but the cost-effectiveness findings were consistently lower than the accepted threshold levels for health care interventions.
Second, by definition, our model is a simplified representation of actual disease progression that may not always reflect the full spectrum of possible disease pathways. Specifically, the model does not explicitly capture congestive heart failure, diabetes, and cardiovascular arrhythmias—health states that have previously been shown to be improved with effective OSA treatment. Including these additional benefits might have improved the health-economic profile of UAS therapy.
Third, our estimate of cardiovascular event risk reduction relies on a regression analysis-based relationship between AHI and cardiovascular event risk and was based on a study that investigated male patients only.12 Nevertheless, that study encompassed a reasonably large sample size, and offers the most-comprehensive long-term cardiovascular outcomes data available about treated and untreated OSA patients. An alternative approach to modeling the risk reduction—considering the percentage of patients who experienced at least a 50% reduction in mean AHI to an absolute level below 15—and sensitivity analyses yielded similar estimates for UAS-related reductions in cardiovascular event risk. We do not anticipate major differences between female and male patients, but we are limited by the fact that available data from OSA studies, including the STAR trial population, are largely from male patients. Further, both the STAR trial and the referenced observational study populations primarily consist of Caucasians. To evaluate the effect of uncertainty in cardiovascular event risk reduction that may result from the limitations of our approach, we performed extensive sensitivity analyses. The resulting ICER changes were not material and, importantly, did not change the conclusions of our study.
Fourth, the STAR trial population consisted of a selective sample of moderate-to-severe OSA patients, e.g., limited to body mass index (BMI) below 32. These selective inclusion criteria might limit the generalizability of our findings to the broader population of OSA patients. However, one of the purposes of our sensitivity analyses was to enable characterization of cost-effectiveness also in those who may not specifically meet all STAR trial eligibility criteria, and our findings suggest that ICERs are not materially different for cohorts with variations in the studied input parameters.
Fifth, although patient adherence to UAS therapy was high at 12 months in the STAR trial—with 86% of patients reporting daily use—it might be expected that some variation in use would occur during the patient's lifetime. Our base case assumes constant utilization of 86%. We also tested the effects of lower adherence rates.
Finally, our estimates of the specific settings of care and related reimbursement coding—for example, 90% of implantations being performed as outpatient procedures in hospital or ambulatory surgical centers, and 10% as hospital inpatient procedures—rely on clinical trial experience with the therapy in the United States. While we believe our assumptions are a reasonable and accurate reflection of real-world clinical practice, we nevertheless tested the effect of variations in total UAS-related cost.
CONCLUSIONS
Our findings indicate that UAS therapy is a cost-effective treatment strategy for moderate-to-severe OSA patients intolerant to CPAP therapy, if trial-demonstrated effectiveness is maintained over the patient's lifetime.
DISCLOSURE STATEMENT
This study was supported by a grant from Inspire Medical Systems. Dr. Pietzsch is president, CEO, and shareholder of Wing Tech Inc., a technology consulting firm focusing on early-stage assessment of medical technologies. Wing Tech Inc. received consulting fees from Inspire Medical Systems to develop the health-economic model used in this analysis. Dr. Liu and Ms. Garner worked as consultants for Wing Tech Inc. on this project. Dr. Kezirian is a consultant for Inspire Medical Systems and Split Rock Scientific. He has been a consultant and member of the scientific advisory board of Apnex Medical and ReVENT Medical. Dr. Strollo has received grant support from Inspire Medical Systems during the conduct of the STAR Trial; is a member of a scientific advisory panel for ResMed Inc.; and has received grant support from Philips-Respironics.
ACKNOWLEDGMENTS
The previously published health-economic model that provided the basis for part of this study was developed under a grant to Principal Investigator John Linehan, PhD, from the Institute for Health Technology Studies (InHealth), see reference 8. The authors would like to acknowledge InHealth and Dr. Linehan.
Footnotes
A commentary on this article appears in this issue on page 665.
SUPPLEMENTAL MATERIAL
Appendix A.1. Detailed Computation of UAS Costs
Table A.1.
Detailed computation of UAS costs, shown for the two subsets of the overall cohort (US implantation performed in outpatient setting versus in-patient setting).
Appendix A.2. Estimation of UAS Effectiveness in Reducing Cardiovascular Events
In the STAR Trial, the mean pre-treatment (baseline) AHI was 32.0. Twelve months post UAS implantation, the mean AHI was 15.3. Using this information, we estimated the UAS therapy effectiveness in reducing cardiovascular event risk (non-fatal and fatal combined) as follows:
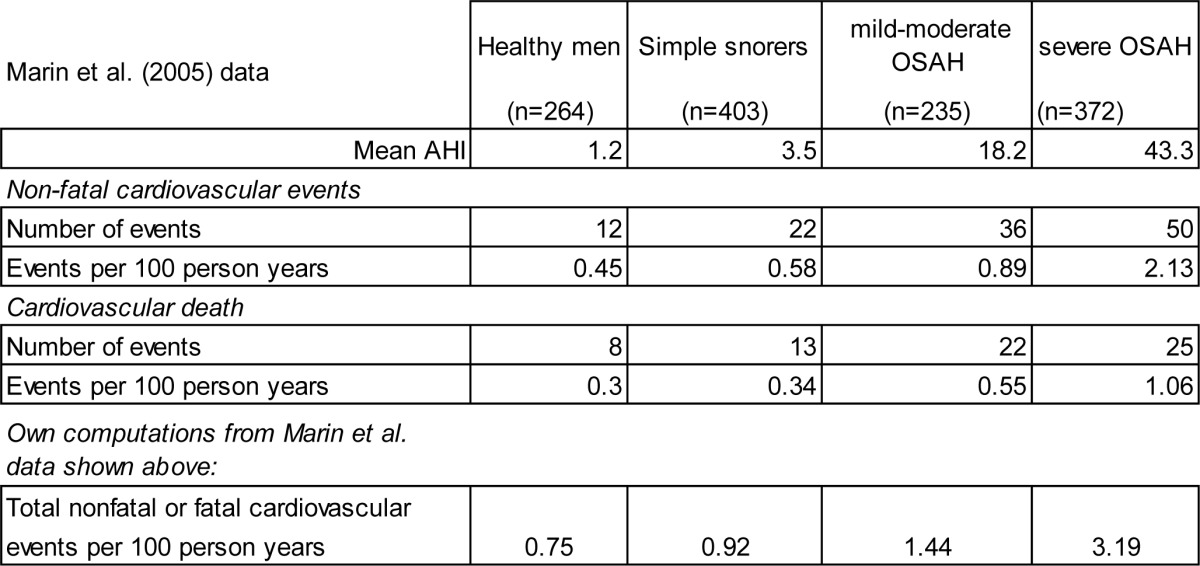
We used data from Marin et al.12 that reported long-term cardiovascular outcomes in CPAP-treated vs. untreated male OSA patients. The Marin study included 264 healthy men, 377 simple snorers, 403 with untreated mild-moderate obstructive sleep apnea-hypopnea, 235 with untreated severe disease, and 372 with the disease and treated with CPAP. Subjects were followed for 10 years to compare incidence of fatal and non-fatal cardiovascular events between cohorts. Table A.2 below shows the subset of nonfatal and fatal cardiovascular event rates reported by Marin et al. that are relevant for our study, and the resulting total event rate, which we computed based on the Marin data.
Table A.2.
Overview of subset of data used from Marin et al. study,12 and resulting total nonfatal or fatal cardiovascular events per 100 person years.
We used the obtained data points to estimate a relationship between AHI and cardiovascular event rates, using a nonlinear (polynomial) regression function. Figure A.1 shows this resulting regression function, as well as the Marin et al.-derived cardiovascular event rates.
Figure A.1.
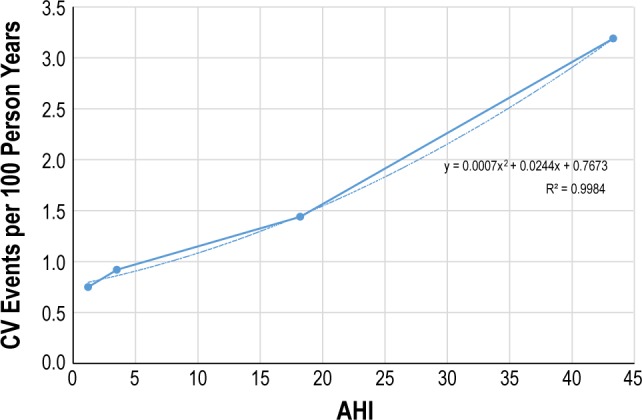
Regression analysis-based approximation estimating functional relationship between AHI and cardiovascular event risk. Large dots show data reported in Marin et al. (2005).
Using this regression function, we then obtained estimates of cardiovascular event rates that could be expected in patients at the AHI levels observed in the STAR Trial. For the baseline mean AHI of 32.0, the resulting CV event rate per 100 person years was 2.26. For an AHI of 15.3 (as observed at 12 months under UAS treatment), the resulting event rate was 1.30.
Next, we computed hazard ratios (HR), using the simple snorer group (AHI of 3.5) as the reference group. This group was chosen because it more closely resembles the baseline AHI that might be observed in the general population; and the general population in turn used as the basis for a number of event hazard ratios used in our overarching health-economic model. Using this approach, we obtained HRs of 2.46 and 1.42, compared to simple snorers, for the STAR Trial baseline vs. 12 month under UAS treatment.
Using these HRs and the simple snorer baseline (HR 1.0), we obtain an overall estimate of risk reduction of OSA-related CV events of (2.46–1.42)/(2.46–1.0) = 71.4%.
In the health-economic model we further assumed that only the 86% of patients who reported using UAS on a daily basis would benefit from this risk reduction, while the remaining 14% would not achieve any CV event risk reduction. For the full UAS cohort, this led to an assumption of ultimate UAS effectiveness in reducing CV event risk of 71.4% × 86% = 61.4%.
Appendix A.3. Detail of Performed Deterministic Sensitivity Analyses
Table A.3.
Detailed results of performed sensitivity analyses (the low and high values are listed in Table 1 of the main text and are only shown in abbreviated form here.
Appendix A.4. Detail of Performed Probabilistic Sensitivity Analysis (PSA)
A total of 5,000 Monte Carlo simulations each were performed for male and female cohorts, sampling from the distributions shown in Table 1.
Below, we show two representations of the results for both the male and female cohorts. The first is the Incremental Cost-effectiveness (ICE) scatter plot, the second the Cost-effectiveness acceptability Curve (CEAC).
The ICE scatter plot shows each of the 5,000 resulting ICERs on the cost-effectiveness plane. The ellipse shows the 95% confidence interval. The dotted line shows the $100,000 per QALY willingness-to-pay threshold.
The CEACs provide a probability that UAS therapy—when compared to no therapy—is cost-effective at the respective Willingness-to-pay threshold (shown are WTPs between $0 and $100,000 per QALY), using common methodological practice of the net-monetary-benefits approach.
Figure A.2a.
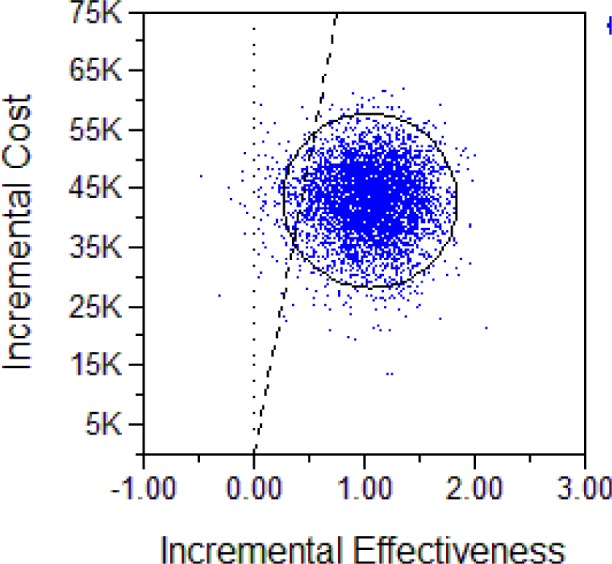
ICE scatter plot, UAS vs. no treatment, male cohort.
Figure A.2b.
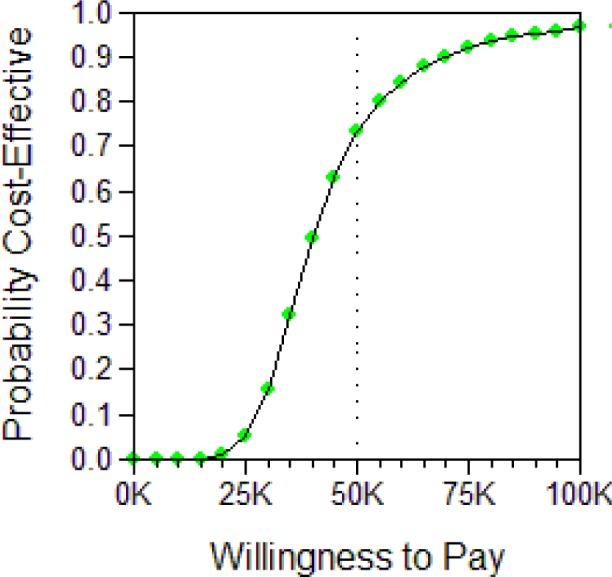
CEAC for UAS vs. no treatment, male cohort.
Figure A.3a.
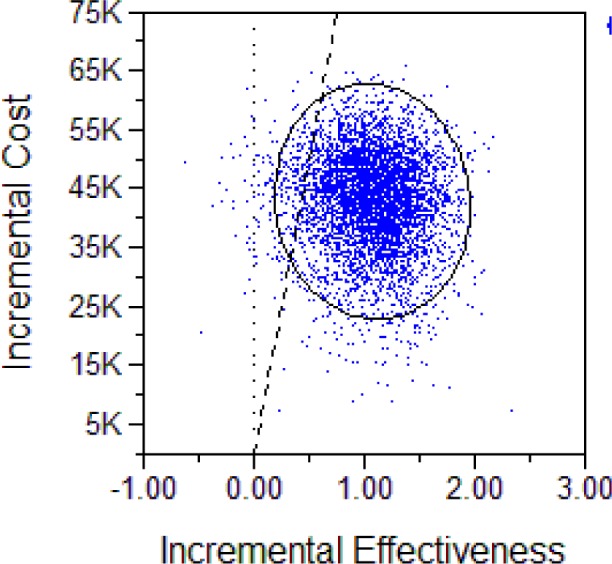
ICE scatter plot for UAS vs. no treatment, female cohort.
Figure A.3b.
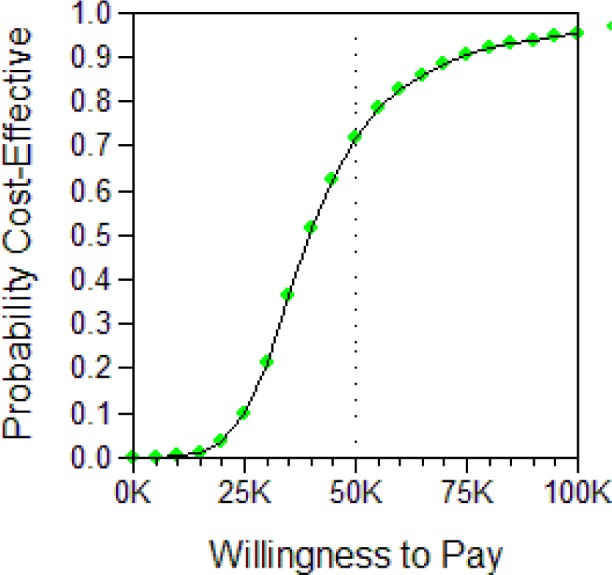
CEAC for UAS vs. no treatment, female cohort.
REFERENCES
- 1.Young T, Palta M, Dempsey J, Skatrud J, Weber S, Badr S. The occurrence of sleep-disordered breathing among middle-aged adults. N Engl J Med. 1993;328:1230–5. doi: 10.1056/NEJM199304293281704. [DOI] [PubMed] [Google Scholar]
- 2.Young T, Evans L, Finn L, Palta M. Estimation of the clinically diagnosed proportion of sleep apnea syndrome in middle-aged men and women. Sleep. 1997;20:705–6. doi: 10.1093/sleep/20.9.705. [DOI] [PubMed] [Google Scholar]
- 3.Young T, Peppard PE, Gottlieb DJ. Epidemiology of obstructive sleep apnea: a population health perspective. Am J Respir Crit Care Med. 2002;165:1217–39. doi: 10.1164/rccm.2109080. [DOI] [PubMed] [Google Scholar]
- 4.Salepci B, Caglayan B, Kiral N, et al. CPAP Adherence of patients with obstructive sleep apnea. Respiratory Care. 2013;58:1467–73. doi: 10.4187/respcare.02139. [DOI] [PubMed] [Google Scholar]
- 5.Weaver TE. Adherence to positive airway pressure therapy. Curr Opin Pulm Med. 2006;12:409–13. doi: 10.1097/01.mcp.0000245715.97256.32. [DOI] [PubMed] [Google Scholar]
- 6.Weaver TE, Grunstein RR. Adherence to continuous positive airway pressure therapy: the challenge to effective treatment. Proc Am Thorac Soc. 2008;5:173–8. doi: 10.1513/pats.200708-119MG. [DOI] [PMC free article] [PubMed] [Google Scholar]
- 7.Strollo PJ, Jr., Soose RJ, Maurer JT, et al. Upper-airway stimulation for obstructive sleep apnea. New Engl J Med. 2014;370:139–49. doi: 10.1056/NEJMoa1308659. [DOI] [PubMed] [Google Scholar]
- 8.Pietzsch JB, Garner A, Cipriano LE, Linehan JH. An integrated health-economic analysis of diagnostic and therapeutic strategies in the treatment of moderate-to-severe obstructive sleep apnea. Sleep. 2011;34:695–709. doi: 10.5665/SLEEP.1030. [DOI] [PMC free article] [PubMed] [Google Scholar]
- 9.Gold MR, Siegel JE, Russell LB, Weinstein MC. Cost-effectiveness in health and medicine. New York: Oxford University Press; 1996. [Google Scholar]
- 10.Cohen DJ, Reynolds MR. Interpreting the results of cost-effectiveness studies. J Am Coll Cardiol. 2008;52:2119–26. doi: 10.1016/j.jacc.2008.09.018. [DOI] [PMC free article] [PubMed] [Google Scholar]
- 11.Neumann PJ, Cohen JT, Weinstein MC. Updating cost-effectiveness — the curious resilience of the $50,000-per-QALY threshold. New Engl J Med. 2014;371:796–7. doi: 10.1056/NEJMp1405158. [DOI] [PubMed] [Google Scholar]
- 12.Marin JM, Carrizo SJ, Vicente E, Agusti AG. Long-term cardiovascular outcomes in men with obstructive sleep apnoea-hypopnoea with or without treatment with continuous positive airway pressure: an observational study. Lancet. 2005;365:1046–53. doi: 10.1016/S0140-6736(05)71141-7. [DOI] [PubMed] [Google Scholar]
- 13.Balk EM, Moorthy D, Obadan NO, et al. Quality AfHRa, editor. Boston, MA: Agency for Healthcare Research and Quality; 2011. Diagnosis and treatment of obstructive sleep apnea in adults; p. 494. (available at http://effectivehealthcare.ahrq.gov/ehc/products/117/683/CER32_SleepApnea_FinalReview_201108.pdf) [PubMed] [Google Scholar]
- 14.George CF. Reduction in motor vehicle collisions following treatment of sleep apnoea with nasal CPAP. Thorax. 2001;56:508–12. doi: 10.1136/thorax.56.7.508. [DOI] [PMC free article] [PubMed] [Google Scholar]
- 15.Meara E, White C, Cutler DM. Trends in medical spending by age, 1963-2000. Health Aff (Millwood) 2004;23:176–83. doi: 10.1377/hlthaff.23.4.176. [DOI] [PubMed] [Google Scholar]
- 16.Labor USDo. CPI Inflation calculator. 2013. [cited 2013 12/18]; Available from: http://www.bls.gov/data/inflation_calculator.htm.
- 17.CMS. 2 Midnight Inpatient Admission Guidance &Patient Status Reviews for Admissions on or after October 1, 2013 2013 [Google Scholar]
- 18.Arias E. United States life tables, 2008. 2012 [PubMed] [Google Scholar]
- 19.Sullivan PW, Ghushchyan V. Preference-Based EQ-5D index scores for chronic conditions in the United States. Med Decis Making. 2006;26:410–20. doi: 10.1177/0272989X06290495. [DOI] [PMC free article] [PubMed] [Google Scholar]
- 20.McDaid C, Griffin S, Weatherly H, et al. Continuous positive airway pressure devices for the treatment of obstructive sleep apnoeahypopnoea syndrome: a systematic review and economic analysis. Health Technol Assess. 2009;13:iii–iv. xi–xiv, 1–119, 43–274. doi: 10.3310/hta13040. [DOI] [PubMed] [Google Scholar]
- 21.Aaberg J. PMA: P130008 - Sponsor's panel briefing package. 2014 [Google Scholar]
- 22.Chang D Analysis NCfSa, editor. Washington, DC: National Highway Traffic Safety Administration; 2008. Comparison of crash fatalities by sex and age group. [Google Scholar]
- 23.Blincoe LJ, Seay A, Zaloshnja E, et al. Administration NHTS, editor. Washington, DC: U.S. Department of Transportation; 2002. The Economic Impact of Motor Vehicle Crashes, 2000. [Google Scholar]
- 24.Cutler JA, Sorlie PD, Wolz M, Thom T, Fields LE, Roccella EJ. Trends in hypertension prevalence, awareness, treatment, and control rates in United States adults between 1988-1994 and 1999-2004. Hypertension. 2008;52:818–27. doi: 10.1161/HYPERTENSIONAHA.108.113357. [DOI] [PubMed] [Google Scholar]
- 25.British_Heart_Foundation_Statistics_Website. HeartStats. British Heart Foundation; 2009. [Google Scholar]
- 26.Psaty BM, Furberg CD, Kuller LH, et al. Association between blood pressure level and the risk of myocardial infarction, stroke, and total mortality: the cardiovascular health study. Arch Intern Med. 2001;161:1183–92. doi: 10.1001/archinte.161.9.1183. [DOI] [PubMed] [Google Scholar]
- 27.Volmink JA, Newton JN, Hicks NR, Sleight P, Fowler GH, Neil HA. Coronary event and case fatality rates in an English population: results of the Oxford myocardial infarction incidence study. The Oxford Myocardial Infarction Incidence Study Group. Heart. 1998;80:40–4. doi: 10.1136/hrt.80.1.40. [DOI] [PMC free article] [PubMed] [Google Scholar]
- 28.Marshall NS, Wong KK, Liu PY, Cullen SR, Knuiman MW, Grunstein RR. Sleep apnea as an independent risk factor for all-cause mortality: the Busselton Health Study. Sleep. 2008;31:1079–85. [PMC free article] [PubMed] [Google Scholar]
- 29.Roger VL, Jacobsen SJ, Weston SA, et al. Trends in the incidence and survival of patients with hospitalized myocardial infarction, Olmsted County, Minnesota, 1979 to 1994. Ann Intern Med. 2002;136:341–8. doi: 10.7326/0003-4819-136-5-200203050-00005. [DOI] [PubMed] [Google Scholar]
- 30.Brown RD, Whisnant JP, Sicks JD, O'Fallon WM, Wiebers DO. Stroke incidence, prevalence, and survival: secular trends in Rochester, Minnesota, through 1989. Stroke. 1996;27:373–80. [PubMed] [Google Scholar]
- 31.Hollander M, Koudstaal PJ, Bots ML, Grobbee DE, Hofman A, Breteler MM. Incidence, risk, and case fatality of first ever stroke in the elderly population. The Rotterdam Study. J Neurol Neurosurg Psychiatry. 2003;74:317–21. doi: 10.1136/jnnp.74.3.317. [DOI] [PMC free article] [PubMed] [Google Scholar]
- 32.Dennis MS, Burn JP, Sandercock PA, Bamford JM, Wade DT, Warlow CP. Long-term survival after first-ever stroke: the Oxfordshire Community Stroke Project. Stroke. 1993;24:796–800. doi: 10.1161/01.str.24.6.796. [DOI] [PubMed] [Google Scholar]
- 33.Barbe F, Sunyer J, de la Pena A, et al. Effect of continuous positive airway pressure on the risk of road accidents in sleep apnea patients. Respiration. 2007;74:44–9. doi: 10.1159/000094237. [DOI] [PubMed] [Google Scholar]
- 34.O'Connor GT, Caffo B, Newman AB, et al. Prospective study of sleep-disordered breathing and hypertension: the Sleep Heart Health Study. Am J Respir Crit Care Med. 2009;179:1159–64. doi: 10.1164/rccm.200712-1809OC. [DOI] [PMC free article] [PubMed] [Google Scholar]
- 35.Yaggi HK, Concato J, Kernan WN, Lichtman JH, Brass LM, Mohsenin V. Obstructive sleep apnea as a risk factor for stroke and death. N Engl J Med. 2005;353:2034–41. doi: 10.1056/NEJMoa043104. [DOI] [PubMed] [Google Scholar]
- 36.Schleinitz MD, Heidenreich PA. A cost-effectiveness analysis of combination antiplatelet therapy for high-risk acute coronary syndromes: clopidogrel plus aspirin versus aspirin alone. Ann Intern Med. 2005;142:251–9. doi: 10.7326/0003-4819-142-4-200502150-00007. [DOI] [PubMed] [Google Scholar]
- 37.Geisler BP, Egan BM, Cohen JT, et al. Cost-effectiveness and clinical effectiveness of catheter-based renal denervation for resistant hypertension. J Am Coll Cardiol. 2012;60:1271–7. doi: 10.1016/j.jacc.2012.07.029. [DOI] [PubMed] [Google Scholar]
- 38.Luengo-Fernandez R, Gray AM, Rothwell PM. Costs of stroke using patient-level data: a critical review of the literature. Stroke. 2009;40:e18–23. doi: 10.1161/STROKEAHA.108.529776. [DOI] [PubMed] [Google Scholar]
- 39.Ramsey SD, Clarke LD, Roberts CS, Sullivan SD, Johnson SJ, Liu LZ. An economic evaluation of atorvastatin for primary prevention of cardiovascular events in type 2 diabetes. Pharmacoeconomics. 2008;26:329–39. doi: 10.2165/00019053-200826040-00005. [DOI] [PubMed] [Google Scholar]
- 40.Glasziou P, Alexander J, Beller E, Clarke P ADVANCE Collaborative Group. Which health-related quality of life score? A comparison of alternative utility measures in patients with Type 2 diabetes in the ADVANCE trial. Health Qual Life Outcomes. 2007;5:21. doi: 10.1186/1477-7525-5-21. [DOI] [PMC free article] [PubMed] [Google Scholar]
- 41.Aasa M, Henriksson M, Dellborg M, et al. Cost and health outcome of primary percutaneous coronary intervention versus thrombolysis in acute ST-segment elevation myocardial infarction-Results of the Swedish Early Decision reperfusion Study (SWEDES) trial. Am Heart J. 2010;160:322–8. doi: 10.1016/j.ahj.2010.05.008. [DOI] [PubMed] [Google Scholar]
- 42.Grosso AM, Bodalia PN, Macallister RJ, Hingorani AD, Moon JC, Scott MA. Comparative clinical- and cost-effectiveness of candesartan and losartan in the management of hypertension and heart failure: a systematic review, meta- and cost-utility analysis. Int J Clin Pract. 2011;65:253–63. doi: 10.1111/j.1742-1241.2011.02633.x. [DOI] [PubMed] [Google Scholar]
- 43.Darlington AS, Dippel DW, Ribbers GM, van Balen R, Passchier J, Busschbach JJ. Coping strategies as determinants of quality of life in stroke patients: a longitudinal study. Cerebrovasc Dis. 2007;23:401–7. doi: 10.1159/000101463. [DOI] [PubMed] [Google Scholar]
- 44.Tousignant P, Cosio MG, Levy RD, Groome PA. Quality adjusted life years added by treatment of obstructive sleep apnea. Sleep. 1994;17:52–60. [PubMed] [Google Scholar]
- 45.Chakravorty I, Cayton R, Szczepura A. Health utilities in evaluating intervention in the sleep apnoea/hypopnoea syndrome. Eur Respir J. 2002;20:1233–8. doi: 10.1183/09031936.00.00014401. [DOI] [PubMed] [Google Scholar]
- 46.Nyman JA, Barleen NA, Kirdruang P. Quality-adjusted life years lost from nonfatal motor vehicle accident injuries. Med Decis Making. 2008;28:819–28. doi: 10.1177/0272989X08318463. [DOI] [PubMed] [Google Scholar]


