Abstract
Objectives
(1) Develop a method to account for the confounding effect of the nasal cycle when comparing pre- and post-surgery objective measures of nasal patency. (2) Illustrate this method by reporting objective measures derived from computational fluid dynamics (CFD) models spanning the full range of mucosal engorgement associated with the nasal cycle in two subjects.
Study Design
Retrospective
Setting
Academic tertiary medical center.
Subjects and Methods
A cohort of 24 nasal airway obstruction patients was reviewed to select the two patients with the greatest reciprocal change in mucosal engorgement between pre- and post-surgery computed tomography (CT) scans. Three-dimensional anatomic models were created based on the pre- and post-operative CT scans. Nasal cycling models were also created by gradually changing the thickness of the inferior turbinate, middle turbinate, and septal swell body. CFD was used to simulate airflow and to calculate nasal resistance and average heat flux.
Results
Before accounting for the nasal cycle, Patient A appeared to have a paradoxical worsening nasal obstruction in the right cavity postoperatively. After accounting for the nasal cycle, Patient A had small improvements in objective measures postoperatively. The magnitude of the surgical effect also differed in Patient B after accounting for the nasal cycle.
Conclusion
By simulating the nasal cycle and comparing models in similar congestive states, surgical changes in nasal patency can be distinguished from physiological changes associated with the nasal cycle. This ability can lead to more precise comparisons of pre and post-surgery objective measures and potentially more accurate virtual surgery planning.
Keywords: nasal airway obstruction, nasal cycle, nasal surgery, septoplasty, nasal resistance, mucosal cooling, computational fluid dynamics (CFD) simulations
INTRODUCTION
The term “nasal cycle” describes spontaneous changes in the engorgement of the nasal mucosa that result in fluctuations in unilateral nasal resistance and airflow. In its classical form, bilateral nasal resistance remains approximately constant, while airflow partitioning switches between the left and right nostrils every 2–3 hours.1,2 The nasal cycle represents a significant challenge when comparing pre- and post-surgery objective measures of nasal airflow. Although 3-fold reductions in unilateral nasal resistance are often achieved by nasal surgery,3–6 unilateral resistance may oscillate 5-fold during the nasal cycle,2 thus obscuring the quantification of the surgical effect. The objective of this manuscript is to develop a method to quantify nasal surgery outcomes, while accounting for the confounding effect of the nasal cycle.
Over the past several years, our research group has applied computational fluid dynamics (CFD) to study nasal airway obstruction (NAO). Our group,7,8 and others,9 recently reported that mucosal heat loss computed with CFD models has a greater correlation to subjective nasal patency scores than traditional objective measures such as nasal resistance. However, our analysis was restricted to patients who showed symmetrical engorgement of the nasal mucosa in both pre- and post-surgery computed tomography (CT) scans because no method was available to distinguish the surgical effect from fluctuations in nasal mucosal engorgement associated with the nasal cycle.7,8
The present study is thus motivated by the need to take the nasal cycle into account when quantifying the effect of NAO surgery in patients who display significant changes in mucosal engorgement between pre- and post-surgery CT scans. We report a new methodology to account for the nasal cycle by creating models that reproduce various engorgement states of the nasal mucosa. Although our models reproduce the entire spectrum of nasal congestion states, we propose comparing objective measures at mid-cycle as a method to compare similar congestive states. We also report objective measures in the state of greatest mucosal congestion of each cavity, based on the recommendation by Eccles1 that the most obstructed state of the cycle is likely to be the most clinically relevant. This methodology is illustrated by reporting nasal resistance and mucosal heat loss in two test subjects. The ability to account for the confounding effect of the nasal cycle is a key element that future virtual surgery planning software will need to take into account when using anatomic models based on single instantaneous imaging.
METHODS
Patient Selection
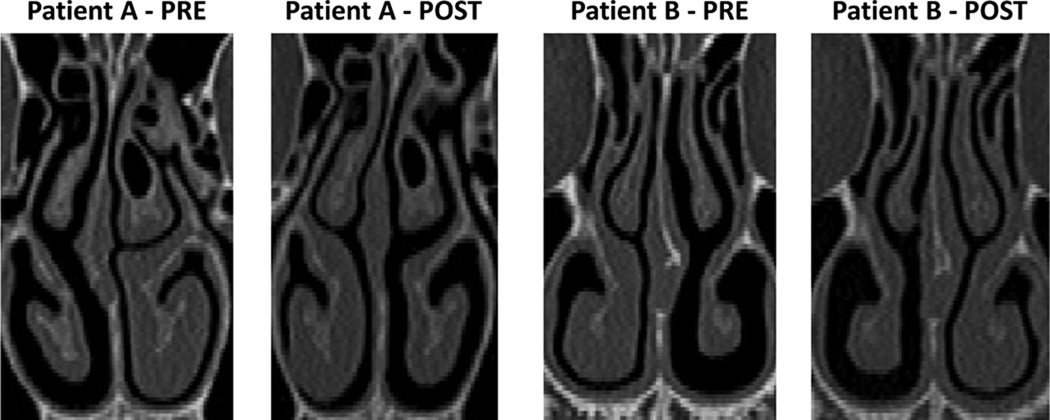
This research was approved by the IRB committee at the Medical College of Wisconsin and informed consent was obtained from each patient. This project is part of a larger study aimed at correlating subjective and objective measures of nasal patency.7,8,10 Twenty four patients undergoing surgery to treat NAO (septoplasty, turbinectomy, and/or rhinoplasty) were recruited. Pre- and post-operative axial CT scans were obtained with 0.6-mm increments and an in-plane resolution of 0.313 mm. A visual comparison of the pre- and post-surgery scans revealed that 12 patients had significant changes in mucosal engorgement due to nasal cycling that ranged from minor (4 patients) to more significant (8 patients). Among these 12 patients, the two patients with greatest reciprocal changes were selected for analysis (Figure 1). Both patients were assumed to be cycling maximally and at opposite extremes when each CT scan was obtained. Patient A underwent a septoplasty with bilateral inferior turbinate outfracturing, while patient B underwent an open septorhinoplasty.
Figure 1. Reciprocal changes in mucosal engorgement due to the nasal cycle between pre-surgery and post-surgery computed tomography scans.
Creation of Pre- and Post-Surgical Models
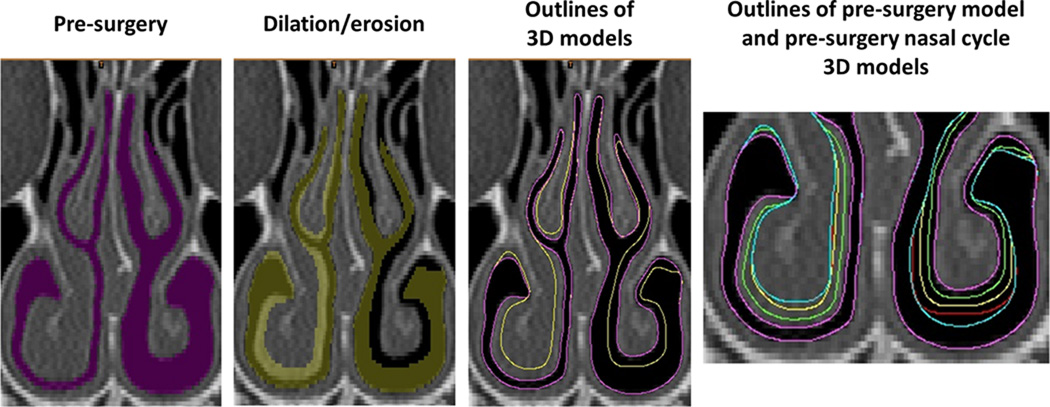
Three dimensional digital models of the pre and post-surgery nasal passages were created in Mimics 16.0 (Materialise Inc., Leuven, Belgium). Briefly, the pre- and post-surgery CT scans of each subject were imported into Mimics 16.0 and a mask (group of voxels) that corresponds to the nasal passage was defined in each scan using a combination of manual editing and automated tools. The nasal cavity masks included the anatomy from the nostrils to the nasopharynx, excluding the paranasal sinuses (Figure 2A). For each subject, the pre-surgical nasal model was co-registered with the post-surgical scan using facial bones so that consistent borders along the sinus ostia could be defined in the pre- and post-surgery models.
Figure 2. Creation of nasal cycle models.
The airspace mask was dilated on the right cavity and eroded on the left cavity. This process was repeated to create several nasal cycle models (magenta = pre-surgery, green = NC1, yellow = NC2, red = NC3, blue = NC4).
Creation of Nasal Cycle Models
Once the pre- and post-surgical airspace masks were created, tissue masks were created of the inferior turbinates, middle turbinates, and septal swell body. The airspace mask was then sequentially dilated or eroded (by 1 to 8 pixels) around the inferior turbinate, middle turbinate and septal swell body (Figure 2). The limit for each dilation/erosion of the airspace mask was the tissue mask of the opposite model. For example, when dilating the airspace mask around the right inferior turbinate of patient B (Figure 2), the post-surgical right inferior turbinate was set as a limit so that the greatest possible change in the geometry of the pre-surgical airspace would not exceed the boundaries of the post-surgical inferior turbinate. Nasal cycle models were created based on both the pre-surgical CT scan and the post-surgical CT scan by using the aforementioned methods. Including the pre- and post-surgery models, a total of 18 CFD models were developed (8 for Patient A, and 10 for Patient B), representing gradual changes in mucosal engorgement due to the nasal cycle.
Computational Fluid Dynamics (CFD) Simulations
Computational fluid dynamics allows for the prediction of fluid movement by solving the Navier-Stokes equations.7,8,11–14 Briefly, each 3D nasal reconstruction was meshed with approximately 4 million tetrahedral cells using ICEM-CFD 14.0 (ANSYS, Inc, Canonsburg, Pennsylvania). Steady-state, laminar, inspiratory airflow simulations were conducted in Fluent 14.0 (ANSYS, Inc) with the following boundary conditions: (1) inlet pressure at the nostrils = 0 Pa, (2) air velocity at the walls equal to zero, and (3) outlet pressure set to a value that resulted in 15 L/min of bilateral airflow, which corresponds to an adult breathing at rest. The boundary conditions for heat transfer simulations were (1) T = 20°C at the nostrils and (2) T = 32.6°C at the nasal mucosa, where T is the air temperature. The value of 32.6°C corresponds to the average nasal mucosa temperature during inspiration, as measured by Lindemann and coauthors.15
Outcome Measures
Nasal resistance (Rnose = ΔP/Q̇V) was defined as the ratio of the transnasal pressure drop ΔP (nostrils to choana) to the volumetric airflow rate Q̇V. Average heat flux was defined as the rate of heat loss from the nasal mucosa to inspired air between the nostrils and the nasal choana, divided by the corresponding surface area.7,10 Airflow partitioning was defined as the ratio between unilateral and bilateral airflow (i.e., the percentage airflow flowing through each nostril). The distance along the nasal cavity was defined as D = z/Lseptum, where z is the distance from the nostrils and Lseptum is the septum length from nostrils to nasal choana. Finally, changes in mucosal engorgement were quantified by the inferior turbinate width, defined as the average width among seven uniformly-spaced coronal cross-sections located at distances 0.3 ≤ D ≤ 0.9.
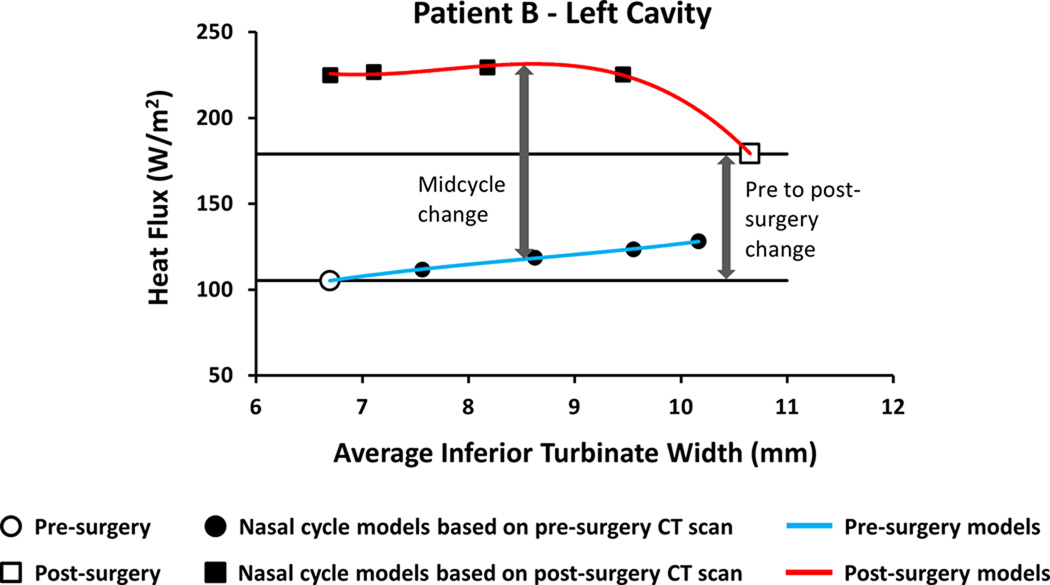
To estimate mid-cycle objective measures of nasal patency, nasal resistance and heat flux were plotted against the average inferior turbinate width. A third order polynomial curve was fit to the data points and the mid-cycle value was estimated based on the fitting curves (Figure 3). Thus, the mid-cycle surgical effect was the difference between the pre-surgical nasal cycle curve and post-surgical nasal cycle curve at the mid-cycle inferior turbinate width.
Figure 3. Method to estimate mid-cycle changes in objective measures of nasal airflow.
Third-order polynomial curves were fitted to the data and mid-cycle values were estimated at the mid-cycle inferior turbinate width.
RESULTS
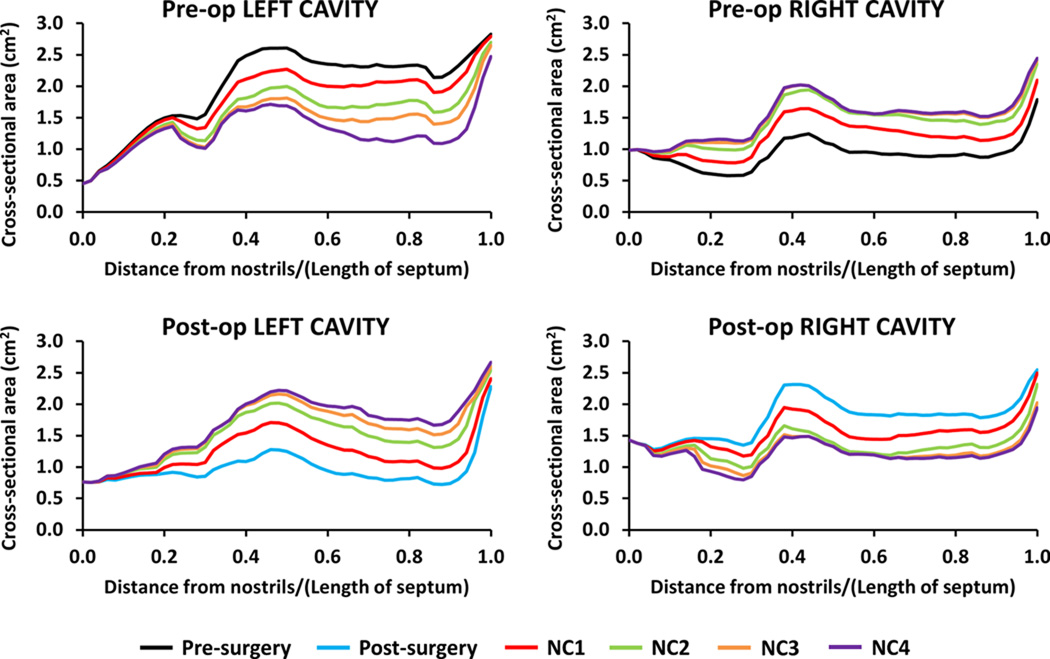
To verify that the nasal cycle models represented a range of nasal mucosa engorgement states, airspace cross-sectional areas were plotted as a function of distance from nostrils (Figure 4). The nasal cycle models spanned a range of cross-sectional areas, from congested to decongested in each cavity. For example, the pre-surgery NC4 model closely reproduced the post-surgery cross-sectional areas. This is consistent with the fact that the pre-surgery NC4 model reproduces the configuration of the inferior and middle turbinates post-surgery. Differences in the cross-sectional areas between corresponding models (e.g., pre-surgery NC4 model vs. post-surgery model) are due to surgical changes, but also to mucosal changes along the nasal floor, superior turbinates, and other areas whose mucosal engorgement was not reproduced because these were deemed to be of minor importance as compared to mucosal changes in the inferior and middle turbinates.
Figure 4. Airspace cross-sectional areas of pre- and post-surgery models of Patient B.
Note that, although the same colors are used, the pre-surgery NC1 model is different from the post-surgery NC1 model, and so on.
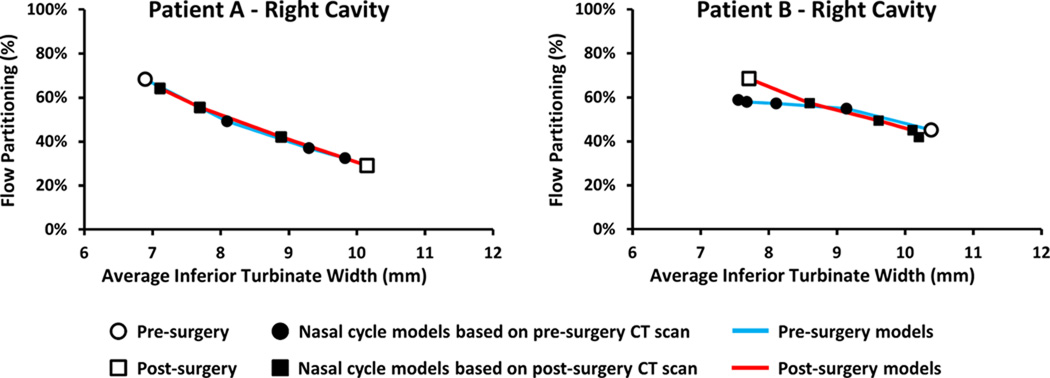
To further validate the models, the percentage of inspired air flowing through each nostril was plotted against the ipsilateral inferior turbinate width (Figure 5). As expected, airflow partitioning reversed between nostrils when mucosal engorgement reversed. For example, pre-surgery 68% of inspired air passed through the right nostril in Patient A, in agreement with the decongested state of the right side turbinates (Figure 1). As the turbinates were made more congested in the right cavity and decongested in the left cavity, airflow partitioning reversed, so that only 32% of airflow passed through the right nostril in the pre-surgery NC4 model. This reversal of airflow partitioning was observed in both patients, pre- and post-surgery, as the turbinate engorgement state reversed (Figure 5). These gradual changes in flow partitioning further demonstrate that the nasal cycle models represent a range of mucosal congestion states.
Figure 5. Airflow partitioning between left and right nostrils for Patients A and B.
Reversal of flow partitioning is consistent with reversal of mucosal congestion from pre- to post-surgery.
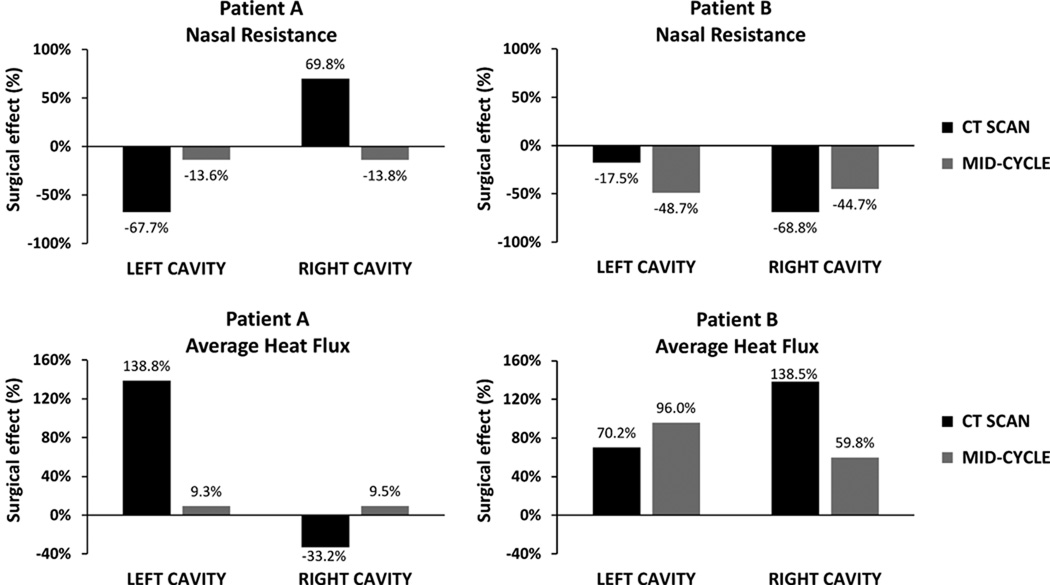
Comparing the pre-surgery and post-surgery models before accounting for the nasal cycle, nasal resistance decreased 68% on the left cavity, but increased 70% on the right cavity, thus suggesting a worsening of symptoms post-operatively (Figure 6). However, the pre- and post-surgery models reflected opposite mucosal engorgement states (Figure 1). At mid-cycle, a 14% post-operative decrease in nasal resistance was estimated for both cavities (Figure 6). A similar trend was observed for mucosal heat loss for Patient A. Models based on the pre- and post-operative CT scans predicted that average heat loss increased post-operatively on the left but decreased on the right cavity. In contrast, at mid-cycle, a 9% increase in the average heat loss was predicted for both cavities. In patient B, nasal resistance reduced from pre to post-surgery on both sides, with an 18% reduction on the left cavity and a 69% reduction on the right cavity (Figure 6). However, the mid-cycle nasal resistance decreases were 49% on the left and 45% on the right. Similarly, unilateral heat flux increased on both sides from the pre-surgery CT scan to the post-surgery CT scan, but mid-cycle estimates differed from estimates before adjusting for the nasal cycle.
Figure 6. Pre-surgery to post-surgery changes in unilateral nasal resistance and average heat flux.
Values based on the CT scans alone are compared to mid-cycle estimates after adjusting for the nasal cycle.
Minimum unilateral flows and maximum unilateral resistances during the nasal cycle are listed in Table 1. In the left cavity of Patient A, a 32% post-surgical reduction in the maximum unilateral resistance resulted in a 46% increase in the minimum flow. This surgical improvement in the left cavity patency in its congested state was associated with a 10% increase in the highest resistance of the right cavity. In patient B, the minimum flow increased 27% and 74% in the left and right cavities, respectively, which is explained by reductions in the maximum resistances of each cavity (Table 1).
Table 1.
Unilateral nasal airflow and resistance in the state of greatest mucosal congestion before and after NAO surgery.
| Patient | Minimum flow (ml/s) |
Maximum resistance (Pa.s/ml) |
|||
|---|---|---|---|---|---|
| Left | Right | Left | Right | ||
| A | Pre-surgery | 68 | 95 | 0.123 | 0.088 |
| Post-surgery | 99 | 86 | 0.084 | 0.097 | |
| Surgical effect | 46% increase | 9% reduction | 32% reduction | 10% increase | |
| B | Pre-surgery | 81 | 70 | 0.179 | 0.208 |
| Post-surgery | 103 | 122 | 0.141 | 0.119 | |
| Surgical effect | 27% increase | 74% increase | 21% reduction | 43% reduction | |
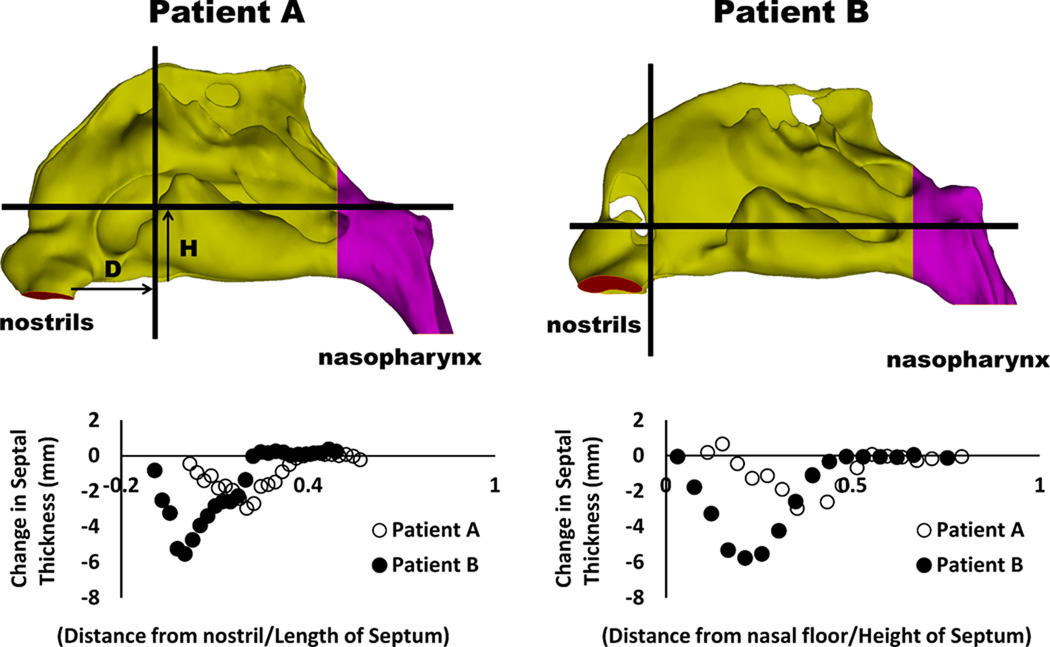
To quantify the surgical changes in nasal anatomy after septoplasty, septal thickness was measured along two planes that were parallel and perpendicular to the nasal floor, respectively (Figure 7). A greater decrease in septal thickness was observed in Patient B, who also had a more anterior septal deviation than Patient A (Figure 7).
Figure 7. Changes in septal thickness after septoplasty.
Measurements were performed along coronal and axial planes with greatest change in septal thickness. Arrows indicate distance from nostrils (D) and distance from nasal floor (H).
DISCUSSION
Many rhinologists have studied the nasal cycle by serial measurements of resistance or cross-sectional area.1,16 Hasegawa and colleagues reported that unilateral resistances in the decongested and congested states are on average 0.18 and 0.82 Pa.s/ml, respectively, in healthy subjects.2 Knight et al. reported that unilateral resistance fluctuates with an average amplitude (difference between maximum and minimum resistances during the cycle) of 0.75 Pa.s/ml.17 Most studies, however, only reported the presence or absence of the nasal cycle and its periodicity.2,18–21 Therefore, there is lack of studies investigating the nasal cycle before and after surgery in NAO patients. In particular, distinguishing surgical changes in nasal resistance from changes associated with the nasal cycle remains a challenge. This study explored the possibility of using CFD simulations to distinguish the surgical changes in nasal patency from physiologic fluctuations associated with the nasal cycle.
Our results demonstrate that CFD models spanning a range of mucosal congestion states can be created to represent the nasal cycle and to more accurately measure the effect of treatment in the surgical management of NAO. The variation of airspace cross-sectional areas (Figure 4) and reversal of flow partitioning (Figure 5) demonstrate that nasal cycle models can be created. The quantification of nasal resistance and mucosal heat loss throughout the nasal cycle allowed the surgical effect to be measured by comparing states of equal mucosal congestion (Figures 3 and 6). Although Patient A had a visibly straighter septum on post-operative CT and reported subjective improvement in symptoms, insignificant changes in resistance and heat loss were observed post-surgery after accounting for the nasal cycle. Patient B had much larger improvements in nasal resistance and heat loss throughout the nasal cycle. This is likely due to Patient B having a much more complex septal deformity preoperatively and also having correction of a more anterior septal deviation (Figure 7).12
One exception to the lack of studies investigating the nasal cycle before and after NAO surgery is the paper by Quine and colleagues.22 Using posterior rhinomanometry, nasal airflow was recorded hourly over a period of 5 hours at a pressure of 75 Pa in 27 NAO patients submitted to inferior turbinate reduction via submucosal diathermy. On average, bilateral nasal airflow increased from 246 ml/s preoperatively to 371 ml/s postoperatively, which represented a statistically significant 51% increase. In a later review article from the same group, Eccles1 advocated using the minimum unilateral airflow (Fmin) during the nasal cycle as “a measure of the most obstructed state of the nasal passage [which] may be a more relevant parameter than total nasal airflow in assessing the severity of nasal obstruction.” Quine and coautors reported that surgery significantly increased Fmin from an average of 69 ml/s to 163 ml/s, a 136% increase (p<0.0001).22 In our study (Table 1), Fmin increased from 68 ml/s preoperatively to 86 ml/s postoperatively in Patient A, and from 70 ml/s to 103 ml/s in Patient B, suggesting that both patients had some relief of nasal obstruction in the state of maximum mucosal congestion.
This paper illustrates that the nasal cycle can influence objective measures of surgical outcomes such as nasal resistance and mucosal cooling. Therefore, while evaluating the effects of nasal surgery, surgeons must keep in mind that patients may be cycling at opposite extremes during their pre-surgery and post-surgery visits. This implies that instantaneous measurements of nasal patency may not reflect how the patient feels over an extended period of time and, sometimes, instantaneous measures can be perplexing, such as the apparent postsurgical increase in the right cavity resistance of Patient A (Figure 6).
Current practice relies on patient subjective complaints, physical exam findings, and physician judgment when planning surgery to correct NAO. However, several groups have been working on a method to simulate surgical approaches, or “virtual surgery”, to allow surgeons to select the optimal surgical therapy.23,24 As this technology improves, practitioners must be mindful of the nasal cycle effect on NAO and will need a method to correct for the fluctuating mucosal engorgement. As shown by our results, the nasal cycle can dramatically influence objective measures of surgical outcomes. Thus, the methodology described in this paper can be used in future CFD studies and potentially in virtual surgery to remove the confounding effect of the nasal cycle.
Some limitations of this manuscript must be noted. First, we assumed that the pre- and post-surgery CT scans were captured at opposite extremes of the nasal cycle. This assumption was based on literature reports that the transition between the congested and decongested states is rapid (< 30 min) in comparison to the half-cycle duration (90 min to 10 hours), so that, at any given time, the nasal mucosa is more likely to be either fully congested or fully decongested rather than in a mid-cycle state.19 Second, our nasal cycle models did not account for mucosal changes along the nasal floor, superior turbinates, and posterior septum because these were more difficult to reproduce in a systematic fashion. Finally, the post-surgical CT scan was used to limit the congestion and decongestion of the turbinates in the pre-surgery nasal cycle models. Although greatly increasing the accuracy of our models, this approach is limited to research groups because post-operative CT scans are not routinely obtained. However, this methodology can be applied to other patients in our cohort who displayed significant nasal cycling between pre- and post-operative CT scans, and it is expected to be valuable to other researchers in the field.
This is the first time that the nasal cycle has been simulated using computational models. Before accounting for the nasal cycle, Patient A appeared to have a paradoxical worsening nasal obstruction in the right nasal cavity. After accounting for the nasal cycle, it was concluded that Patient A had minor improvement in all objective parameters post-surgery, except for an increase in the minimum airflow through the left cavity. Patient B had substantial improvements in all objective measures post-surgery, but the magnitude of change differed after accounting for the nasal cycle. Differences in the magnitude of surgical effect between Patients A and B were partially explained by greater reduction in septal thickness and the correction of a more anterior septal deviation in Patient B. By applying the methodology described herein, future CFD studies may be able to account for the nasal cycle, and thus to more accurately quantify surgical changes in nasal patency.
Acknowledgements
Funded by grant R01EB009557 from the National Institutes of Health/National Institute of Biomedical Imaging and Bioengineering to the Medical College of Wisconsin (MCW) and by subcontract from MCW to the University of North Carolina at Chapel Hill.
This publication was supported in part by the National Center for Research Resources, the National Center for Advancing Translational Sciences, and the Office of the Director, National Institutes of Health, through Grant Number 8KL2TR000056. Its contents are solely the responsibility of the authors and do not necessarily represent the official views of the NIH.
Footnotes
Poster presented at the American Academy of Otolaryngology-Head and Neck Surgery 2014 Annual Meeting, September 21–24, Orlando, FL.
IRB approval: This project was approved by the IRB committee at the Medical College of Wisconsin and informed consent was obtained from each patient.
Author Contributions
Ruchin G. Patel, study design, literature review, development of CFD models, data analysis and interpretation, writer, manuscript preparation and review; Guilherme J. M. Garcia, study design, development of CFD models, CFD simulations, data analysis and interpretation, writer, manuscript preparation and review; Dennis O. Frank-Ito, data analysis and interpretation, manuscript review and editing; Julia S. Kimbell, data analysis and interpretation, manuscript review and editing, John S. Rhee, surgeon, principal investigator, study design, data acquisition, data analysis and interpretation, manuscript review and editing.
REFERENCES
- 1.Eccles R. Nasal airflow in health and disease. Acta Otolaryngol. 2000;120:580–595. doi: 10.1080/000164800750000388. [DOI] [PubMed] [Google Scholar]
- 2.Hasegawa M, Kern EB. Variations in nasal resistance in man: a rhinomanometric study of the nasal cycle in 50 human subjects. Rhinology. 1978;16:19–29. [PubMed] [Google Scholar]
- 3.Broms P, Jonson B, Malm L. Rhinomanometry. IV. A pre- and postoperative evaluation in functional septoplasty. Acta Otolaryngol. 1982;94:523–529. [PubMed] [Google Scholar]
- 4.Jessen M, Ivarsson A, Malm L. Nasal airway resistance and symptoms after functional septoplasty: comparison of findings at 9 months and 9 years. Clin Otolaryngol Allied Sci. 1989;14:231–234. doi: 10.1111/j.1365-2273.1989.tb00366.x. [DOI] [PubMed] [Google Scholar]
- 5.Jessen M, Malm L. The importance of nasal airway resistance and nasal symptoms in the selection of patients for septoplasty. Rhinology. 1984;22:157–164. [PubMed] [Google Scholar]
- 6.Moore M, Eccles R. Objective evidence for the efficacy of surgical management of the deviated septum as a treatment for chronic nasal obstruction: a systematic review. Clin Otolaryngol. 2011;36:106–113. doi: 10.1111/j.1749-4486.2011.02279.x. [DOI] [PubMed] [Google Scholar]
- 7.Sullivan CD, Garcia GJ, Frank-Ito DO, Kimbell JS, Rhee JS. Perception of better nasal patency correlates with increased mucosal cooling after surgery for nasal obstruction. Otolaryngol Head Neck Surg. 2014;150:139–147. doi: 10.1177/0194599813509776. [DOI] [PMC free article] [PubMed] [Google Scholar]
- 8.Kimbell JS, Frank DO, Laud P, Garcia GJ, Rhee JS. Changes in nasal airflow and heat transfer correlate with symptom improvement after surgery for nasal obstruction. J Biomech. 2013;46:2634–2643. doi: 10.1016/j.jbiomech.2013.08.007. [DOI] [PMC free article] [PubMed] [Google Scholar]
- 9.Zhao K, Jiang J, Blacker K, et al. Regional peak mucosal cooling predicts the perception of nasal patency. Laryngoscope. 2014;124:589–595. doi: 10.1002/lary.24265. [DOI] [PMC free article] [PubMed] [Google Scholar]
- 10.Kimbell JS, Garcia GJ, Frank DO, Cannon DE, Pawar SS, Rhee JS. Computed nasal resistance compared with patient-reported symptoms in surgically treated nasal airway passages: a preliminary report. Am J Rhinol Allergy. 2012;26:e94–e98. doi: 10.2500/ajra.2012.26.3766. [DOI] [PMC free article] [PubMed] [Google Scholar]
- 11.Garcia GJ, Bailie N, Martins DA, Kimbell JS. Atrophic rhinitis: a CFD study of air conditioning in the nasal cavity. J Appl Physiol (1985) 2007;103:1082–1092. doi: 10.1152/japplphysiol.01118.2006. [DOI] [PubMed] [Google Scholar]
- 12.Garcia GJ, Rhee JS, Senior BA, Kimbell JS. Septal deviation and nasal resistance: an investigation using virtual surgery and computational fluid dynamics. Am J Rhinol Allergy. 2010;24:e46–e53. doi: 10.2500/ajra.2010.24.3428. [DOI] [PubMed] [Google Scholar]
- 13.Cannon DE, Frank DO, Kimbell JS, Poetker DM, Rhee JS. Modeling nasal physiology changes due to septal perforations. Otolaryngol Head Neck Surg. 2013;148:513–518. doi: 10.1177/0194599812472881. [DOI] [PMC free article] [PubMed] [Google Scholar]
- 14.Frank-Ito DO, Kimbell JS, Laud P, Garcia GJM, Rhee JS. Predicting postsurgery nasal physiology with computational modeling: Current challenges and limitations. Otolaryngol Head Neck Surg. 2014 doi: 10.1177/0194599814547497. [DOI] [PMC free article] [PubMed] [Google Scholar]
- 15.Lindemann J, Leiacker R, Rettinger G, Keck T. Nasal mucosal temperature during respiration. Clin Otolaryngol Allied Sci. 2002;27:135–139. doi: 10.1046/j.1365-2273.2002.00544.x. [DOI] [PubMed] [Google Scholar]
- 16.Stoksted P. Rhinometric measurements for determination of the nasal cycle. Acta Otolaryngol Suppl. 1953;109:159–175. doi: 10.3109/00016485309132516. [DOI] [PubMed] [Google Scholar]
- 17.Knight LC, Eccles R, Reilly M. Cyclical changes in nasal airway resistance and middle ear pressures. Acta Otolaryngol. 1991;111:769–775. doi: 10.3109/00016489109138411. [DOI] [PubMed] [Google Scholar]
- 18.Lang C, Grutzenmacher S, Mlynski B, Plontke S, Mlynski G. Investigating the nasal cycle using endoscopy, rhinoresistometry, and acoustic rhinometry. Laryngoscope. 2003;113:284–289. doi: 10.1097/00005537-200302000-00016. [DOI] [PubMed] [Google Scholar]
- 19.Grutzenmacher S, Lang C, Mlynski R, Mlynski B, Mlynski G. Long-term rhinoflowmetry: a new method for functional rhinologic diagnostics. Am J Rhinol. 2005;19:53–57. [PubMed] [Google Scholar]
- 20.Tahamiler R, Yener M, Canakcioglu S. Detection of the nasal cycle in daily activity by remote evaluation of nasal sound. Arch Otolaryngol Head Neck Surg. 2009;135:137–142. doi: 10.1001/archoto.2008.537. [DOI] [PubMed] [Google Scholar]
- 21.Rohrmeier C, Schittek S, Ettl T, Herzog M, Kuehnel TS. The nasal cycle during wakefulness and sleep and its relation to body position. Laryngoscope. 2014;124:1492–1497. doi: 10.1002/lary.24546. [DOI] [PubMed] [Google Scholar]
- 22.Quine SM, Aitken PM, Eccles R. Effect of submucosal diathermy to the inferior turbinates on unilateral and total nasal airflow in patients with rhinitis. Acta Otolaryngol. 1999;119:911–915. doi: 10.1080/00016489950180270. [DOI] [PubMed] [Google Scholar]
- 23.Pawar SS, Garcia GJM, Kimbell JS, Rhee JS. Objective Measures in Aesthetic and Functional Nasal Surgery: Perspectives on Nasal Form and Function. Facial Plastic Surgery. 2010;26:320–327. doi: 10.1055/s-0030-1262314. [DOI] [PMC free article] [PubMed] [Google Scholar]
- 24.Rhee JS, Pawar SS, Garcia GJM, Kimbell JS. Toward Personalized Nasal Surgery Using Computational Fluid Dynamics. Archives of Facial Plastic Surgery. 2011;13:305–310. doi: 10.1001/archfacial.2011.18. [DOI] [PMC free article] [PubMed] [Google Scholar]


