Abstract
Background: Cancer is a main public health problem all over the world with its high morbidity and mortality. MicroRNA-16 (miRNA-16, miR-16) family members have been considered as potential biomarkers in cancer diagnosis in several previous studies, but their results were inconsistent. Objective: The present meta-analysis was conducted to assess the diagnostic efficacy of miR-16 family for cancer systematically. Methods: Multiple search strategies and random-effects model were used. Pooled sensitivity, specificity and other parameters were calculated. Totally, 1,259 cancer patients and 855 controls from 16 articles were enrolled in this meta-analysis. Results: The pooled results for sensitivity, specificity, positive likelihood ratios (PLR), negative likelihood ratios (NLR), diagnostic odds ratio (DOR) and the area under the curve (AUC) were 0.80 (95% CI: 0.73-0.85), 0.77 (95% CI: 0.70-0.84), 3.5 (95% CI: 2.5-5.0), 0.26 (95% CI: 0.19-0.36), 14 (95% CI: 8-25) and 0.86 (95% CI: 0.82-0.88), respectively. Our subgroup analyses indicated miR-16 family assay was more appropriate in Asian populations. Conclusions: Our findings demonstrated that miR-16 family members have a relatively high value as promising biomarkers in diagnosing cancers. Nevertheless, the clinical application of miR-16 family profiling for cancers diagnosis still needs further large-scale studies and additional improvements of substantiation.
Keywords: MicroRNA-16 family, cancer, meta-analysis, diagnosis
Introduction
Cancer is a key health burden problem all over the world, which has become the first leading cause of death in developed countries and the second leading cause of death in developing countries [1]. Across the world around 12.7 million new cancer cases and 7.6 million new deaths were estimated in 2008, 56% of the cases and 64% of the deaths were in developing world recorded in GLOBOCAN 2008 [2]. In spite of the high morbidity and mortality and low 5-year survival rate among various diseases, the mortality of early stage can be reduced to a certain extent compared with those at advanced stages. Unfortunately, there are no specific clinical detections of cancer in its initial stage, which need more complex diagnostic process. Thus, the improvement in methods of cancer diagnosis at its early stage is urgently needed in nowadays.
Currently, imaging techniques and biopsy have been introduced to identify cancer [3]. These techniques have improved accuracy notably but still remain with certain limitations. Most cancers are asymptomatic at their early stage, therefore imaging techniques, such as CT, MRI and PET-CT, which primarily on morphological features of tumors, would be failure to achieve high accuracy [4]. Although biopsy is the gold standard of cancer diagnostic tools, its invasive feature made it impossible to apply to all the cancer patients, because it could lead to certain medical complications [5]. As the rapid development of several diagnostic techniques, various kinds of early detection method have been proposed. These methods focus on several kinds of biomarkers, including neoplasm-derived proteins, DNA and RNA markers. Their applications are also restricted by their suboptimal sensitivity and specificity [6]. Taken together, increasing incidence rate, low survival rate and less efficient diagnostic tools or biomarkers, all made it urgent to identify a precise, reliable and noninvasive detection. The novel biomarkers will increase the probability of earlier cancer detection and lower the risk of potential harm to patients. That should make a significant improvement in survival rates, and also keep the cost and resource utilization in balance as well.
Recently, several clinical researches have been conducted to evaluate the potential microRNAs (miRNAs) as novel diagnostic markers for cancer diagnosis [7]. MiRNAs are a family of small and non-coding RNA molecules with 18-25 nucleotides in length [8,9]. These miRNAs not only regulate gene-expression but also control a wide array of biological processes such as cellular development, apoptosis, proliferation, differentiation, and tumorigenesis, some of which are associated with carcinogenesis [10]. Recently, some clinical studies demonstrated significant relationships between miRNAs and cancer by putting forward the evidence that the expression level of many miRNAs remarkably alter the association with the stage of cancer [11]. In addition, the expression patterns of miRNAs in cancers with tissue-specific and status-stability in blood or feces, which makes them more promising for the early diagnosis of cancer. Accordingly, we can reach the conclusion that miRNAs may serve as ideal biomarkers of cancer screening, which deserve more attention.
MicroRNA-16 (miRNA-16, miR-16) family was a representative miRNA since it has been widely studied in different types of cancers. MiR-16 family is a big family, including miR-15a/b, miR-16, miR-103, miR-107 and miR-195. Many studies identified miR-16 family members could distinguish cancer patients from non-cancer people. However, the results of diagnostic accuracy and overall risk for prognosis with miRNA-16 family were inconsistent. Considering the limits of the single study, we conduct this systematic review and meta-analysis to evaluate the diagnostic efficacy of miR-16 family with various kinds of cancers.
Materials and methods
Search strategy
Comprehensive databases have been used to identify the relevant studies published up to 19th July, 2014. Databases include PubMed, Web of Science, the Cochrane Library, Embase and Chinese National Knowledge Infrastructure (CNKI). The following medical subject headings (MeSH) and keywords were adopted: (“microRNA-16 family” or “miRNA-16 family” or “miR-16 family”) and (“cancer” or “tumor”) and (“diagnosis” or “ROC curve” or “sensitivity” or “specificity”). For further relevant studies, the references of selected articles were also identified through manual search.
Eligible criteria
All studies included in this meta-analysis were confirmed by miR-16 cancer detection. Sufficient data to support sensitivity and specificity or true-positive (TP), false-positive (FP), true-negative (TN) and false-negative (FN) was another inclusion criteria. Apart from that, included studies should based on humans. There are some exclusion criteria. Studies were published in following formats, editorials, letters, case reports or reviews, were excluded. Studies with duplicate data were not considered. Some studies without a control group or enough samples sizes or qualified data were excluded as well.
Data extraction
All the included studies were carefully reviewed, then the details of each articles, such as author; publication year; country of study; ethnicity of patients; numbers, mean age of patients and controls; source of control; type of specimen; test method of miR-16 family expression; miRNAs expression change; sensitivity and specificity data were extracted. Specific data of sensitivity and specificity were not presented in these articles directly, we have estimated these values from the receiver operator characteristic (ROC) curves manually.
Quality assessment
We systematically evaluated each study’s quality according to the critical review checklist of the QUADAS-2, which is demonstrated to be an efficient method to assess the quality of diagnostic accuracy studies [12]. For each of these seven yes-or-no questions, “yes” get score 1, while others get 0, the highest score is seven.
Statistical methods
We used statistical software, STATA 12.0 (Stata-Corp LP, College Station, TX, USA) to perform all statistical analyses [13]. The following measures with their 95% confidence interval for each study: sensitivity, specificity, the positive likelihood ratio (PLR), negative likelihood ratio (NLR), and diagnostic odds ratio (DOR) [14,15]. The sensitivity and specificity of each included study were used to plot the summary receiver operator characteristic (SROC) curve and the area under the SROC curve (AUC) was also calculated to evaluate perfect discriminatory ability to differentiate patients from normal controls [17,18]. The pooled PLR is defined as the ratio of positive outcome in cases with cancer while the pooled NLR indicates the ratio of positive outcome in those without cancer. Simultaneously, DOR, the odds of PLR to NLR, ranges from zero to infinity, which reflects the performance of discriminatory [16]. In addition, Q test and I 2 values estimate the between-study heterogeneity. A P value less than 0.05 of Q test or I 2 indicate substantial heterogeneity [19,20]. Furthermore, subgroup and meta-regression analyses were carried out to detect the between-study heterogeneity. Publication bias was assessed with Deeks’ funnel plots as a concern for meta-analyses of diagnostic studies [21]. Finally, the Fagan’s nomogram was graphed to calculate post-test probabilities.
Results
Included studies
The selection flowchart of the literature research is presented in Figure 1. The initial search returned a total of 301 articles (298 from database searches and 3 from other sources), of which 30 duplicate publications were excluded. The remaining 271 articles were subjected to the following step of valuation. After titles, abstracts and key words were reviewed, 227 were excluded: 128 were reviews or letters or meta-analysis and 99 were not related to our subjects of research, leaving 44 articles available for further full text review. According to exclusion criteria, 28 records were excluded: 13 were not relevant to diagnosis and 15 lack sufficient data for miR-16 family. Finally, the remaining 16 articles were appropriate for our meta-analysis [22-37].
Figure 1.
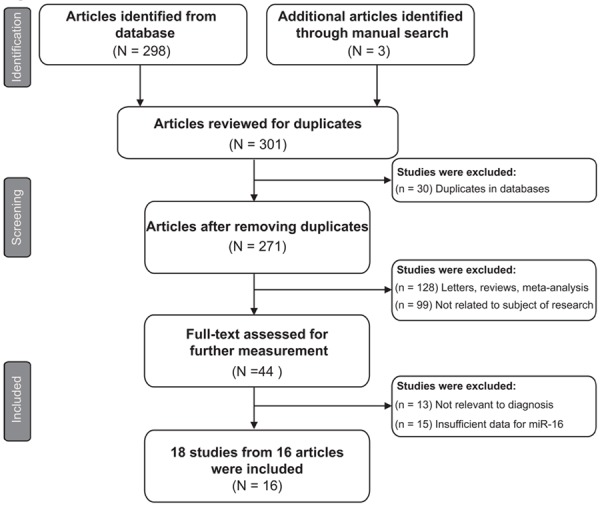
Flow diagram of eligible studies selection process.
Baseline characteristics
The major characteristics of the included articles are shown in Table 1 by order of publication year, ranging from 2009 to 2014. In the present meta-analysis, 18 studies from 16 articles covering 11 types of cancers and containing 2,114 participants (1,259 cancer patients and 855 controls comprised of 554 matched healthy individuals and 301 patients with other benign diseases) were available for analysis. Of the 18 diagnostic studies, 9 were conducted in Asian populations and 9 in Caucasian populations. All of the included studies used the quantitative real-time reverse transcription-PCR (qRT-PCR) method to detect the expression level of miR-16 family members, while 14 of them tested it in blood samples (9 in serum, 4 in plasma, 1 in blood) and 4 in other samples (2 in urine, 1 in tissue, 1 in cerebrospinal fluid-CSF). Overall, the qualified studies were of moderate-high quality with QUADAS-2 scores higher than 3 indicated in a bar graph in Table 1.
Table 1.
Main characteristics of 16 articles included in meta-analysis
| Study ID | Country | Ethnicity | Sample size | Mean age | MiR-16 | Cancer | Control | Specimen | Diagnostic power | QUADAS | |||||
|---|---|---|---|---|---|---|---|---|---|---|---|---|---|---|---|
|
|
|
||||||||||||||
| Case | Control | Case | Control | TP | FP | FN | TN | ||||||||
| Ichimi T, 2009 | Japan | Asian | 104 | 31 | 76 | 70 | miR-195 | Breast cancer | Healthy control | Serum | 95 | 6 | 9 | 25 | 3 |
| Heneghan HM, 2010 | Ireland | Caucasian | 83 | 63 | 55.1 | 52.1 | miR-195 | Breast cancer | Healthy control | Blood | 73 | 6 | 10 | 57 | 5 |
| Baraniskin A, 2011 | Germany | Caucasian | 23 | 30 | 64 | N.A. | miR-15b | PCNSL | Neurologic disorder | CSF | 21 | 7 | 2 | 23 | 4 |
| Mahn R, 2011 | Germany | Caucasian | 37 | 38 | N.A. | N.A. | miR-16 | Prostate cancer | HBV, Healthy control | Serum | 20 | 12 | 17 | 26 | |
| 37 | 38 | N.A. | N.A. | miR-195 | Prostate cancer | BPH | Serum | 28 | 16 | 9 | 22 | ||||
| Qu KZ, 2011 | USA | Caucasian | 105 | 107 | 55 | 51 | miR-16 | Liver cancer | Chronic liver disease | Serum | 76 | 12 | 29 | 95 | 5 |
| Bryant RJ, 2012 | UK | Caucasian | 78 | 28 | 70 | 63 | miR-107 | Prostate cancer | Healthy control | Plasma | 52 | 16 | 26 | 12 | 4 |
| Fang C, 2012 | China | Asian | 75 | 77 | 55.36 | 54 | miR-15a | DLBCL | Healthy control | Serum | 60 | 18 | 15 | 59 | 3 |
| 75 | 77 | 55.36 | 54 | miR-16 | DLBCL | Healthy control | Serum | 71 | 37 | 4 | 40 | ||||
| Maclellan SA, 2012 | Canada | Caucasian | 33 | 26 | 63 | 62 | miR-16 | Oral cancer | Healthy control | Serum | 20 | 2 | 13 | 24 | 4 |
| Miah S, 2012 | UK | Caucasian | 68 | 53 | 71 | 58 | miR-15a | Bladder cancer | Benign urinary disease | Urine | 35 | 15 | 33 | 38 | 5 |
| 68 | 53 | 71 | 58 | miR-15b | Bladder cancer | Benign urinary disease | Urine | 46 | 10 | 22 | 43 | ||||
| Wang X, 2012 | China | Asian | 50 | 50 | 49.86 | 48.55 | miR-103 | Breast cancer | Healthy control | Serum | 42 | 15 | 8 | 35 | 3 |
| Liu X, 2013 | China | Asian | 217 | 73 | 45.93 | 40.08 | miR-16 | Nasopharyngeal cancer | Nasopharyngitis | Plasma | 149 | 36 | 68 | 37 | 3 |
| Ng EK, 2013 | Hong Kong | Asian | 185 | 145 | 59 | 58 | miR-16 | Breast cancer | Healthy control | Plasma | 161 | 16 | 24 | 129 | 4 |
| Yang C, 2013 | China | Asian | 133 | 80 | N.A. | 46.8 | miR-15b | Astrocytoma | Healthy control | Serum | 113 | 16 | 20 | 64 | 4 |
| Tsukamoto O, 2014 | Japan | Asian | 28 | 14 | N.A. | N.A. | miR-195 | Endometrial cancer | Healthy control | Tissue | 25 | 2 | 3 | 12 | 5 |
| Zhu C, 2014 | China | Asian | 40 | 40 | 53.83 | 53.55 | miR-16 | Gastric cancer | Healthy control | Plasma | 36 | 2 | 4 | 38 | 3 |
N.A., not available; PCNSL, primary central nervous system lymphoma; DLBCL, diffuse large B cell lymphoma; BPH, benign prostate hyperplasia; UCC, urothelial cell carcinoma; CSF, cerebrospinal fluid; QUADAS, quality assessment of diagnostic accuracy studies.
Diagnostic accuracy of miRNA-16 family detection
Forest plots of data from the 18 studies on the sensitivity and specificity of miR-16 family assay in diagnosing cancer are shown in Figure 2. Since there appeared to be significant heterogeneity between studies in sensitivity and specificity data (I 2 = 86.60% and I 2 = 86.17%, respectively), the random effects model was adopted for this meta-analysis. The pooled results with their 95% CIs were listed in Table 2. The overall sensitivity and specificity were 0.80 (95% CI: 0.73-0.85) and 0.77 (95% CI: 0.70-0.84), respectively. Other overall parameters were also calculated and displayed in the table: pooled PLR was 3.5 (95% CI: 2.5-5.0), NLR was 0.26 (95% CI: 0.19-0.36), and DOR was 14 (95% CI: 8-25). Furthermore, we generated the SROC curve while the value of AUC was 0.86 and its 95% CI was 0.82-0.88. The results implied that miR-16 family members had a good level of overall correctness.
Figure 2.
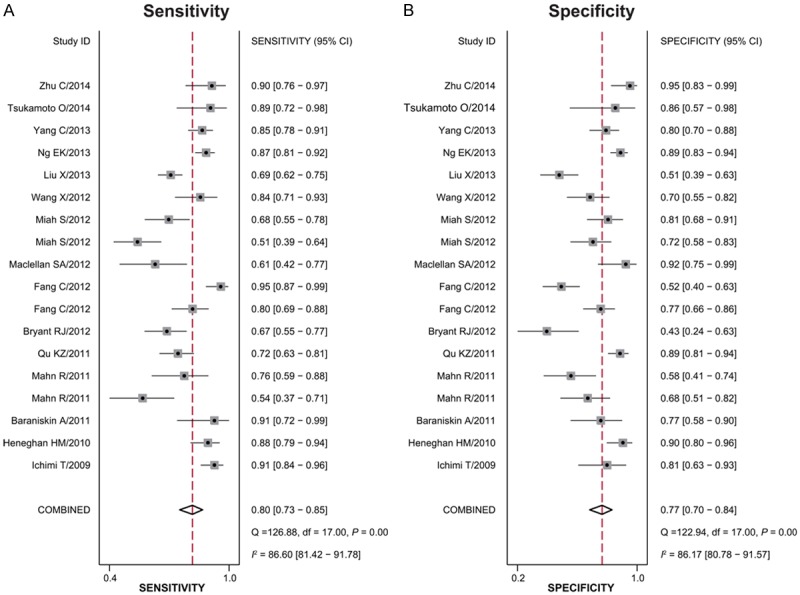
Forest plot of mean sensitivity (A) and specificity (B) for miR-16 family assay in cancer detection of each study included.
Table 2.
Overall and stratified analyses of miR-16 family for cancer detection
| Subtype | SEN [95% CI] | SPE [95% CI] | PLR [95% CI] | NLR [95% CI] | DOR [95% CI] | AUC [95% CI] |
|---|---|---|---|---|---|---|
| Ethnicity | ||||||
| Asian | 0.86 [0.81-0.90] | 0.78 [0.66-0.86] | 3.9 [2.4-6.2] | 0.18 [0.12-0.27] | 22 [10-48] | 0.90 [0.87-0.92] |
| Caucasian | 0.71 [0.61-0.78] | 0.77 [0.66-0.86] | 3.1 [1.9-5.0] | 0.38 [0.27-0.54] | 8 [4-18] | 0.80 [0.76-0.83] |
| Specimen Types | ||||||
| Unhealthy control | 0.68 [0.60-0.76] | 0.73 [0.61-0.81] | 2.5 [1.7-3.7] | 0.44 [0.33-0.59] | 6 [3-11] | 0.75 [0.71-0.79] |
| Healthy control | 0.85 [0.79-0.89] | 0.81 [0.70-0.88] | 4.4 [2.7-7.0] | 0.19 [0.13-0.27] | 24 [11-49] | 0.90 [0.87-0.92] |
| Overall studies | 0.80 [0.73-0.85] | 0.77 [0.70-0.84] | 3.5 [2.5-5.0] | 0.26 [0.19-0.36] | 14 [8-25] | 0.86 [0.82-0.88] |
SEN, sensitivity; SEP, specificity; PLR, positive likelihood ratio; NLR, negative likelihood ratios; DOR, diagnostic odds ratio; AUC, area under the curve; CI, confidence interval.
Subgroup analyses and meta-regression
In order to access the between-study heterogeneity, subgroup analyses based on ethnicity (Asian or Caucasian) and control (healthy control or unhealthy control) were conducted. The pooled sensitivity, specificity, PLR, NLR, and DOR for each subgroup are displayed in Table 2. For studies based on ethnicity, the results showed that the accuracy of miR-16 family detection in Asians (sensitivity, 0.86; specificity, 0.78; PLR, 3.9; NLR, 0.18; DOR, 22; AUC, 0.90) was better than in Caucasians (sensitivity, 0.71; specificity, 0.77; PLR,3.1; NLR, 0.38; DOR, 8; AUC, 0.80) (Figure 3A, 3B). In respect to the the difference between healthy control and controls with other benign diseases, the sensitivity, specificity and AUC for healthy control were 0.85, 0.81 and 0.90, respectively, and for controls with other diseases, the corresponding values were 0.68, 0.73 and 0.75. In addition, the SROC curve for the two groups is shown in Figure 3C, 3D, indicating that healthy control may be a better choice than unhealthy control in cancer detection. We also conducted the meta-regression for confirmation in Figure 4, indicating that ethnicity and control selection had an important influence with a P value < 0.05. This approved the results of subgroup analyses mentioned above.
Figure 3.
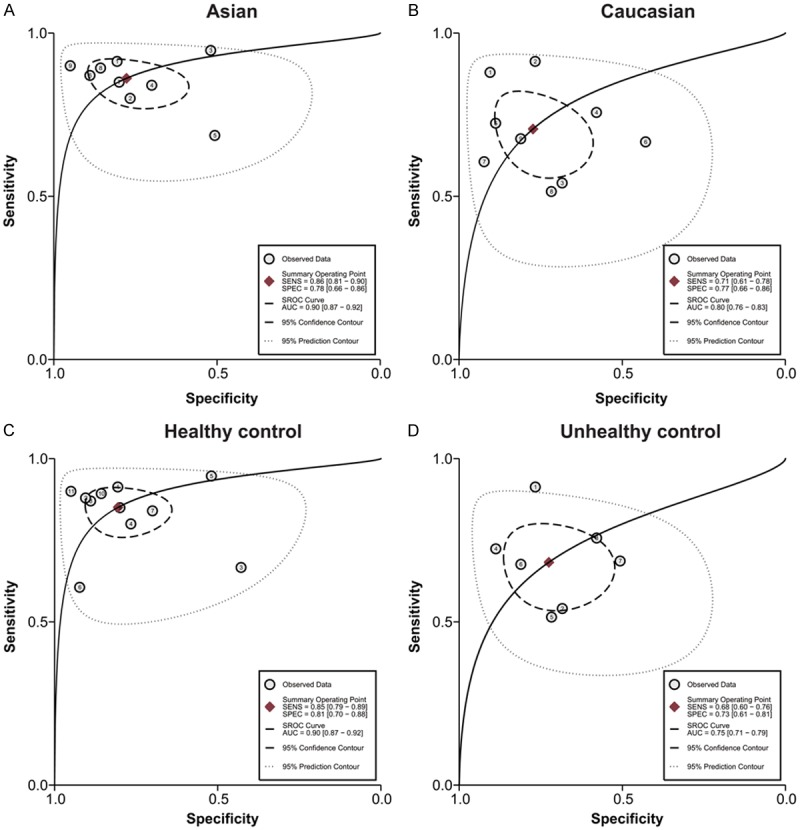
The SROC of the miR-16 family assay for cancer diagnosis (A: SROC for Asian population; B: SROC for Caucasian population; C: SROC for healthy controls; D: SROC for controls with other disease).
Figure 4.
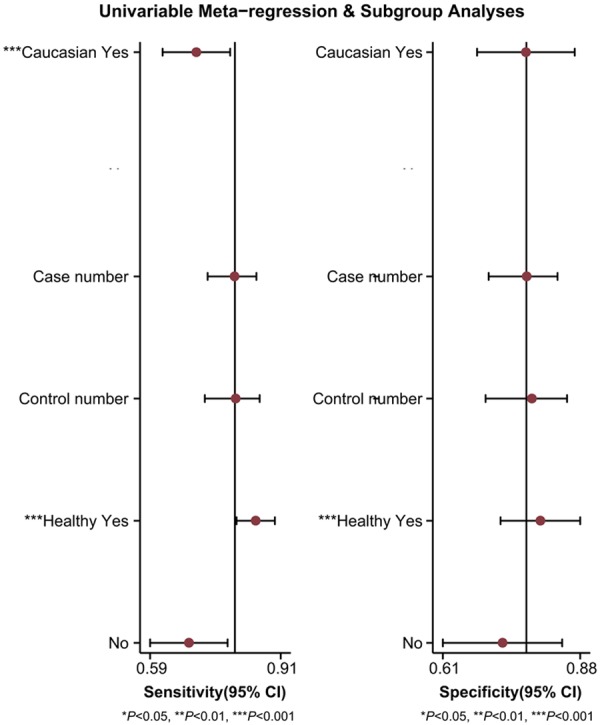
Univariate meta-regression and subgroup analyses for sensitivity and specificity.
Sensitivity analysis and publication bias
Goodness of fit and bivariate normality analyses (Figure 5A, 5B) suggested each included study had only minimal influence on the overall estimates. Influence analysis (Figure 5C) and outlier detection (Figure 5D) identified no outlier studies. Hence, the random-effect bivariate model was robust for the calculation of the pooled estimates. Finally, the Deeks’ funnel plot asymmetry test was used to evaluate the potential publication bias. As shown in Figure 6, the slope coefficient was associated with a P-value of 0.63, and the funnel plots were almost symmetric, which suggested no significant publication bias.
Figure 5.
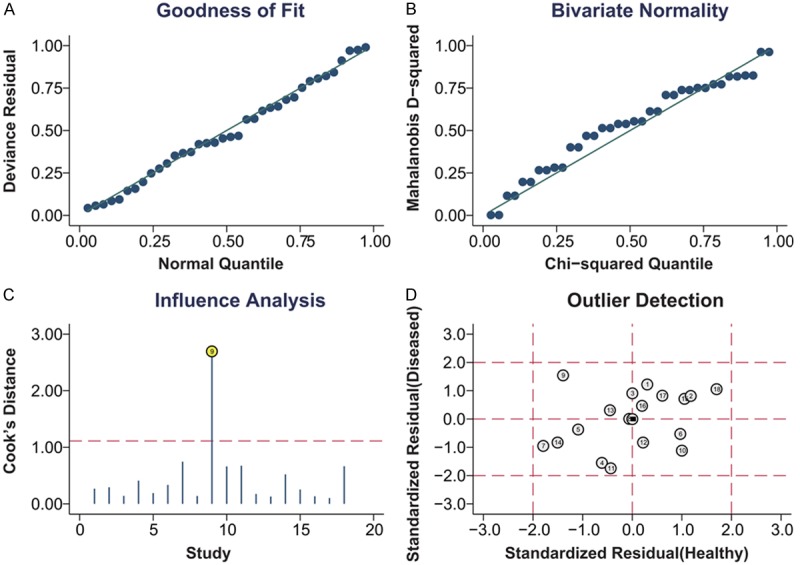
Graphical depiction of residual-based goodness-of-fit (A), bivariate normality (B), influence (C) and outlier detection (D).
Figure 6.
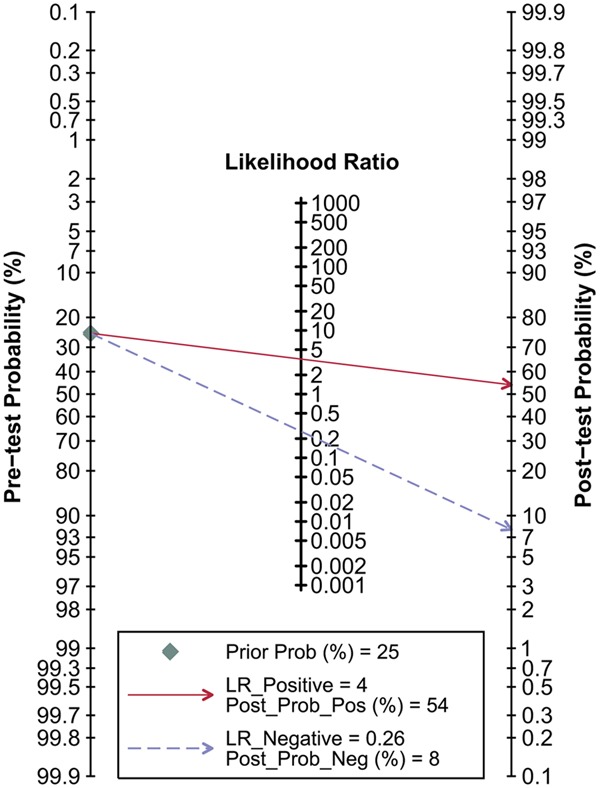
Deeks’ funnel plot with superimposed regression line in this meta-analysis.
Fagan’s nomogram and post-test probabilities
Figure 7 depicted the Fagan’s nomogram, which describes how to use diagnostic finding from miRNA-16 family assay to calculate post-test probability of cancers. Multiply the pretest odds by the likelihood ratio, and we can have a rough idea about the post-test odds of having cancer for general patients. To be specific, for any people with a pre-test probability of 25% to have cancers, if a positive result with PLR value at 4, the post-test probability to have cancers would rise to 54%; by contrast, a negative result with NLR value at 0.26 would lower the post-test probability to 8% in the same condition, showing the importance of miR-16 family assay as initial screening method for cancers.
Figure 7.
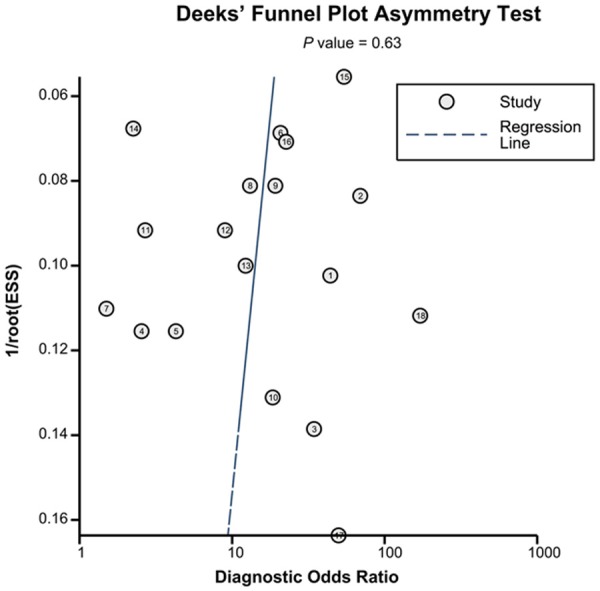
Fagan’s nomogram for estimating post-test possibilities.
Discussion
Cancer remains one of the leading causes of disease-related death across the world, for the most part, owing to the absence of effective approaches for early-stage detection and classification. Options for using imaging techniques and biopsy for the early screening of cancer have limitations such as invasive, unpleasant procedures and potential sampling errors. Conventional cancer-specific biomarkers can hardly meet the qualification of sensitivity and specificity in cancer diagnosing, which also hampers the clinic application. Therefore, ideal biomarkers of tumors are widely searched and miRNAs attached great attention as a novel suitable candidate for its great potential and high stability. Recently, the diagnostic value of miR-16 family was studied and abnormal expression in various cancers was found, which may approved the relationship between miR-16 and cancer. In the meta-analysis of Zhu et al., the pooled sensitivity and specificity of miR-16 in cancer diagnosis were 90% and 79.3% in diagnosing gastric cancer, showed that the measurement of elevated miR-16 levels in plasma could be a potential marker for gastric cancer [22]. Moreover, Ng et al. have also proposed the potential of miR-16 as an available diagnostic method that conducted a meta-analysis in the diagnosis of breast cancer (87% sensitivity and 89% specificity) [25]. However, a study published in 2011 by Mahn et al. showed that the detection of miR-16 expression only yielded 54.1% sensitivity and 68.4% specificity in the diagnosis of prostate cancer [33]. In this meta-analysis, therefore, we summarize the recent findings discussing the feasibility of measuring the aberrant miR-16 expression levels for diagnosis of cancers. And to the best of our knowledge, this study is the first evidence-based meta-analysis concentrating on the overall diagnostic accuracy of miR-16 as diagnostic tools in cancers.
Overall, as shown in Table 2, our meta-analysis revealed that employing miR-16 family members as biomarkers for cancer detection achieved a summary sensitivity of 0.80 (95% CIs: 0.73-0.85), specificity of 0.77 (95% CI: 0.70-0.84) and AUC of 0.86 (95% CIs: 0.82-0.88). These parameters point out that using miR-16 family assays may turn out 20% false-negative and 23% false-positive test results, which is not high enough in accuracy but more reliable compared with conventional molecule-based biomarkers such as CEA, CYFRA 21-1 and TPS [38]. The high AUC of 0.86 shows the trade-off between sensitivity and specificity and reflects an overall high level of diagnostic accuracy. The pooled DOR was 14 (95% CI: 8-25), implying that miR-16 family members can be useful diagnostic biomarkers. A PLR value of 3.50 suggests that cancer patients have a nearly 3.5-fold higher possibility of being tested positive by miR-16 family assays compares with non-cancer patients, however, less than the critical value for dependability of 10 [39]. The NLR was 0.26, meaning the probability of being false-negative is 26% in the tests, which is not low enough to low out cancer. Plus, the Fagan’s nomogram showed the importance of miR-16 family assay as initial screening method for calculating post-test probabilities of cancers. All in all, even though the PLR and NLR are less than ideal, miR-16 family members have a comparative correctness. Hence, they could be employed as invasive and efficient clinical biomarkers.
Heterogeneity should be noticed since it can be a potential problem when interpreting the results for the meta-analysis and thus subgroup analyses basedon ethnicity (Asian or Caucasian) and control (healthy control or unhealthy control) were conducted. On the one hand, the accuracy was higher in Asian populations, showing that various genetic background and environmental variations may influence the tests [40]. On the other hand, the healthy controls showed a higher accuracy than controls of patients with other diseases. A possible explanation for the conclusion is the different stability of miR-16 family members in different controls. Correspondingly, we conducted a meta-regression and found that both of the factors mentioned above affected heterogeneity. Other factors such as different conditions of laboratory, different cut-off criteria and individual difference can also produce influences. In addition to the factors mentioned above, the outlier studies could also present inter-study heterogeneity [41]. As showed in the Figure 5D, there is no outlier study in our meta-analysis.
Our meta-analysis includes several advantages. First of all, it is the first meta-analysis to demonstrate the overall accuracy of miR-16 family in detecting human cancers. Secondly, we adopted a precise screening process to make sure that only high-class literatures were involved in present study. Furthermore, comprehensive methods were performed such as subgroup analyses and meta-regression to minimize potential influence of heterogeneity. In addition, no outlier studies or significant publication bias was found in this meta-analysis. It is all these strengths that make the statistical power of our study stronger.
Still, several limitations should be noted in our study. Firstly, the factor that miR-16 levels possibly have changed after surgeries are not evaluated and may increase the uncertainty of the basic characteristic. And a limited number of cancer type is contained since there are only 18 publications included, therefore, further validations are needed for an ultimate conclusion. Simultaneously, miR-16 family includes several members thus more sufficient evidence may needs to be investigated for some members. What’ more, language restrictions are not employed when searching relevant literatures and no studies included statistic concerning African populations. Lastly, inconsistent cut-off values and limited subjects lead to the contradictory outcomes of different studies as well.
In conclusion, the present meta-analysis assessed miR-16 family members as promising biomarkers in diagnosing cancers. Although the PLR and NLR were not ideal enough, the sensitivity and AUC were relatively high, confirming a relative high value of miR-16 family assay in noninvasive screening test for cancers. Besides, our subgroup analysis showed miR-16 family assay was more appropriate in Asian populations. Nevertheless, the clinical application of miR-16 family profiling for cancers diagnosis still needs further studies and additional improvements for substantiation.
Disclosure of conflict of interest
None.
References
- 1.Martinez-Perez B, de la Torre-Diez I, Lopez-Coronado M. Mobile health applications for the most prevalent conditions by the World Health Organization: review and analysis. J Med Internet Res. 2013;15:e120. doi: 10.2196/jmir.2600. [DOI] [PMC free article] [PubMed] [Google Scholar]
- 2.Levi F, Ferlay J, Galeone C, Lucchini F, Negri E, Boyle P, La Vecchia C. The changing pattern of kidney cancer incidence and mortality in Europe. BJU Int. 2008;101:949–958. doi: 10.1111/j.1464-410X.2008.07451.x. [DOI] [PubMed] [Google Scholar]
- 3.Ljungberg B, Cowan NC, Hanbury DC, Hora M, Kuczyk MA, Merseburger AS, Patard JJ, Mulders PF, Sinescu IC. EAU guidelines on renal cell carcinoma: the 2010 update. Eur Urol. 2010;58:398–406. doi: 10.1016/j.eururo.2010.06.032. [DOI] [PubMed] [Google Scholar]
- 4.Duffy MJ. Role of tumor markers in patients with solid cancers: A critical review. Eur J Intern Med. 2007;18:175–184. doi: 10.1016/j.ejim.2006.12.001. [DOI] [PubMed] [Google Scholar]
- 5.Srigley JR, Delahunt B. Uncommon and recently described renal carcinomas. Mod Pathol. 2009;22(Suppl 2):S2–S23. doi: 10.1038/modpathol.2009.70. [DOI] [PubMed] [Google Scholar]
- 6.Silva-Santos RM, Costa-Pinheiro P, Luis A, Antunes L, Lobo F, Oliveira J, Henrique R, Jeronimo C. MicroRNA profile: a promising ancillary tool for accurate renal cell tumour diagnosis. Br J Cancer. 2013;109:2646–2653. doi: 10.1038/bjc.2013.552. [DOI] [PMC free article] [PubMed] [Google Scholar]
- 7.Ma L, Zhao J, Li T, He Y, Wang J, Xie L, Qin X, Li S. Association between Tumor necrosis factor-alpha gene polymorphisms and prostate cancer risk: a meta-analysis. Diagn Pathol. 2014;9:74. doi: 10.1186/1746-1596-9-74. [DOI] [PMC free article] [PubMed] [Google Scholar]
- 8.Wu CW, Ng SS, Dong YJ, Ng SC, Leung WW, Lee CW, Wong YN, Chan FK, Yu J, Sung JJ. Detection of miR-92a and miR-21 in stool samples as potential screening biomarkers for colorectal cancer and polyps. Gut. 2012;61:739–745. doi: 10.1136/gut.2011.239236. [DOI] [PubMed] [Google Scholar]
- 9.Imperiale TF, Ransohoff DF, Itzkowitz SH, Turnbull BA, Ross ME. Fecal DNA versus fecal occult blood for colorectal-cancer screening in an average-risk population. N Engl J Med. 2004;351:2704–2714. doi: 10.1056/NEJMoa033403. [DOI] [PubMed] [Google Scholar]
- 10.Fakih MG, Padmanabhan A. CEA monitoring in colorectal cancer. What you should know. Oncology (Williston Park) 2006;20:579–587. discussion 588, 594, 596 passim. [PubMed] [Google Scholar]
- 11.Ferracin M, Veronese A, Negrini M. Micromarkers: miRNAs in cancer diagnosis and prognosis. Expert Rev Mol Diagn. 2010;10:297–308. doi: 10.1586/erm.10.11. [DOI] [PubMed] [Google Scholar]
- 12.Whiting PF, Rutjes AW, Westwood ME, Mallett S, Deeks JJ, Reitsma JB, Leeflang MM, Sterne JA, Bossuyt PM. QUADAS-2: a revised tool for the quality assessment of diagnostic accuracy studies. Ann Intern Med. 2011;155:529–536. doi: 10.7326/0003-4819-155-8-201110180-00009. [DOI] [PubMed] [Google Scholar]
- 13.Zamora J, Abraira V, Muriel A, Khan K, Coomarasamy A. Meta-DiSc: a software for meta-analysis of test accuracy data. BMC Med Res Methodol. 2006;6:31. doi: 10.1186/1471-2288-6-31. [DOI] [PMC free article] [PubMed] [Google Scholar]
- 14.Deeks JJ. Systematic reviews in health care: Systematic reviews of evaluations of diagnostic and screening tests. BMJ. 2001;323:157–162. doi: 10.1136/bmj.323.7305.157. [DOI] [PMC free article] [PubMed] [Google Scholar]
- 15.Glas AS, Lijmer JG, Prins MH, Bonsel GJ, Bossuyt PM. The diagnostic odds ratio: a single indicator of test performance. J Clin Epidemiol. 2003;56:1129–1135. doi: 10.1016/s0895-4356(03)00177-x. [DOI] [PubMed] [Google Scholar]
- 16.Monzo M, Navarro A, Bandres E, Artells R, Moreno I, Gel B, Ibeas R, Moreno J, Martinez F, Diaz T, Martinez A, Balague O, Garcia-Foncillas J. Overlapping expression of microRNAs in human embryonic colon and colorectal cancer. Cell Res. 2008;18:823–833. doi: 10.1038/cr.2008.81. [DOI] [PubMed] [Google Scholar]
- 17.Walter SD. Properties of the summary receiver operating characteristic (SROC) curve for diagnostic test data. Stat Med. 2002;21:1237–1256. doi: 10.1002/sim.1099. [DOI] [PubMed] [Google Scholar]
- 18.Jones CM, Athanasiou T. Summary receiver operating characteristic curve analysis techniques in the evaluation of diagnostic tests. Ann Thorac Surg. 2005;79:16–20. doi: 10.1016/j.athoracsur.2004.09.040. [DOI] [PubMed] [Google Scholar]
- 19.Higgins JP, Thompson SG, Deeks JJ, Altman DG. Measuring inconsistency in meta-analyses. BMJ. 2003;327:557–560. doi: 10.1136/bmj.327.7414.557. [DOI] [PMC free article] [PubMed] [Google Scholar]
- 20.Jackson D, White IR, Thompson SG. Extending DerSimonian and Laird’s methodology to perform multivariate random effects meta-analyses. Stat Med. 2010;29:1282–1297. doi: 10.1002/sim.3602. [DOI] [PubMed] [Google Scholar]
- 21.Deeks JJ, Macaskill P, Irwig L. The performance of tests of publication bias and other sample size effects in systematic reviews of diagnostic test accuracy was assessed. J Clin Epidemiol. 2005;58:882–893. doi: 10.1016/j.jclinepi.2005.01.016. [DOI] [PubMed] [Google Scholar]
- 22.Zhu C, Ren C, Han J, Ding Y, Du J, Dai N, Dai J, Ma H, Hu Z, Shen H, Xu Y, Jin G. A five-microRNA panel in plasma was identified as potential biomarker for early detection of gastric cancer. Br J Cancer. 2014;110:2291–2299. doi: 10.1038/bjc.2014.119. [DOI] [PMC free article] [PubMed] [Google Scholar]
- 23.Tsukamoto O, Miura K, Mishima H, Abe S, Kaneuchi M, Higashijima A, Miura S, Kinoshita A, Yoshiura Ki, Masuzaki H. Identification of endometrioid endometrial carcinoma-associated microRNAs in tissue and plasma. Gynecol Oncol. 2014;132:715–21. doi: 10.1016/j.ygyno.2014.01.029. [DOI] [PubMed] [Google Scholar]
- 24.Yang C, Wang C, Chen X, Chen S, Zhang Y, Zhi F, Wang J, Li L, Zhou X, Li N, Pan H, Zhang J, Zen K, Zhang CY, Zhang C. Identification of seven serum microRNAs from a genome-wide serum microRNA expression profile as potential noninvasive biomarkers for malignant astrocytomas. Int J Cancer. 2013;132:116–127. doi: 10.1002/ijc.27657. [DOI] [PubMed] [Google Scholar]
- 25.Zeng Z, Wang J, Zhao L, Hu P, Zhang H, Tang X, He D, Tang S. Potential role of microRNA-21 in the diagnosis of gastric cancer: a meta-analysis. PLoS One. 2011;8:e73278. doi: 10.1371/journal.pone.0073278. [DOI] [PMC free article] [PubMed] [Google Scholar]
- 26.Liu X, Luo HN, Tian WD, Lu J, Li G, Wang L, Zhang B, Liang BJ, Peng XH, Lin SX, Peng Y, Li XP. Diagnostic and prognostic value of plasma microRNA deregulation in nasopharyngeal carcinoma. Cancer Biol Ther. 2013;14:1133–42. doi: 10.4161/cbt.26170. [DOI] [PMC free article] [PubMed] [Google Scholar]
- 27.Wang X, Wu X, Yan L, Shao J. [Serum miR-103 as a potential diagnostic biomarker for breast cancer] . Nan Fang Yi Ke Da Xue Xue Bao. 2012;32:631–634. [PubMed] [Google Scholar]
- 28.Miah S, Dudziec E, Drayton RM, Zlotta AR, Morgan SL, Rosario DJ, Hamdy FC, Catto JW. An evaluation of urinary microRNA reveals a high sensitivity for bladder cancer. Br J Cancer. 2012;107:123–128. doi: 10.1038/bjc.2012.221. [DOI] [PMC free article] [PubMed] [Google Scholar]
- 29.Maclellan SA, Lawson J, Baik J, Guillaud M, Poh CF, Garnis C. Differential expression of miRNAs in the serum of patients with high-risk oral lesions. Cancer Med. 2012;1:268–274. doi: 10.1002/cam4.17. [DOI] [PMC free article] [PubMed] [Google Scholar]
- 30.Fang C, Zhu DX, Dong HJ, Zhou ZJ, Wang YH, Liu L, Fan L, Miao KR, Liu P, Xu W, Li JY. Serum microRNAs are promising novel biomarkers for diffuse large B cell lymphoma. Ann Hematol. 2012;91:553–559. doi: 10.1007/s00277-011-1350-9. [DOI] [PubMed] [Google Scholar]
- 31.Bryant RJ, Pawlowski T, Catto JW, Marsden G, Vessella RL, Rhees B, Kuslich C, Visakorpi T, Hamdy FC. Changes in circulating microRNA levels associated with prostate cancer. Br J Cancer. 2011;106:768–774. doi: 10.1038/bjc.2011.595. [DOI] [PMC free article] [PubMed] [Google Scholar]
- 32.Qu KZ, Zhang K, Li H, Afdhal NH, Albitar M. Circulating microRNAs as biomarkers for hepatocellular carcinoma. J Clin Gastroenterol. 2011;45:355–360. doi: 10.1097/MCG.0b013e3181f18ac2. [DOI] [PubMed] [Google Scholar]
- 33.Mahn R, Heukamp LC, Rogenhofer S, von Ruecker A, Muller SC, Ellinger J. Circulating microRNAs (miRNA) in serum of patients with prostate cancer. Urology. 2011;77:1265.e9–16. doi: 10.1016/j.urology.2011.01.020. [DOI] [PubMed] [Google Scholar]
- 34.Baraniskin A, Kuhnhenn J, Schlegel U, Chan A, Deckert M, Gold R, Maghnouj A, Zollner H, Reinacher-Schick A, Schmiegel W, Hahn SA, Schroers R. Identification of microRNAs in the cerebrospinal fluid as marker for primary diffuse large B-cell lymphoma of the central nervous system. Blood. 2011;117:3140–3146. doi: 10.1182/blood-2010-09-308684. [DOI] [PubMed] [Google Scholar]
- 35.Heneghan HM, Miller N, Lowery AJ, Sweeney KJ, Newell J, Kerin MJ. Circulating microRNAs as novel minimally invasive biomarkers for breast cancer. Ann Surg. 2010;251:499–505. doi: 10.1097/SLA.0b013e3181cc939f. [DOI] [PubMed] [Google Scholar]
- 36.Heneghan HM, Miller N, Kelly R, Newell J, Kerin MJ. Systemic miRNA-195 differentiates breast cancer from other malignancies and is a potential biomarker for detecting noninvasive and early stage disease. Oncologist. 2010;15:673–682. doi: 10.1634/theoncologist.2010-0103. [DOI] [PMC free article] [PubMed] [Google Scholar]
- 37.Ichimi T, Enokida H, Okuno Y, Kunimoto R, Chiyomaru T, Kawamoto K, Kawahara K, Toki K, Kawakami K, Nishiyama K, Tsujimoto G, Nakagawa M, Seki N. Identification of novel microRNA targets based on microRNA signatures in bladder cancer. Int J Cancer. 2009;125:345–352. doi: 10.1002/ijc.24390. [DOI] [PubMed] [Google Scholar]
- 38.Sanfiorenzo C, Ilie MI, Belaid A, Barlesi F, Mouroux J, Marquette CH, Brest P, Hofman P. Two panels of plasma microRNAs as non-invasive biomarkers for prediction of recurrence in resectable NSCLC. PLoS One. 2013;8:e54596. doi: 10.1371/journal.pone.0054596. [DOI] [PMC free article] [PubMed] [Google Scholar]
- 39.Deeks JJ, Altman DG. Diagnostic tests 4: likelihood ratios. BMJ. 2013;329:168–169. doi: 10.1136/bmj.329.7458.168. [DOI] [PMC free article] [PubMed] [Google Scholar]
- 40.Abd-El-Fattah AA, Sadik NA, Shaker OG, Aboulftouh ML. Differential microRNAs expression in serum of patients with lung cancer, pulmonary tuberculosis, and pneumonia. Cell Biochem Biophys. 2013;67:875–884. doi: 10.1007/s12013-013-9575-y. [DOI] [PubMed] [Google Scholar]
- 41.Wang D, Mou ZY, Zhai JX, Zong HX, Zhao XD. [Application of Stata software to test heterogeneity in meta-analysis method] . Zhonghua Liu Xing Bing Xue Za Zhi. 2008;29:726–729. [PubMed] [Google Scholar]


