Abstract
Objective: Cancer-associated fibroblasts (CAFs; α-SMA positivity), as a representative of the tumor microenvironment, play an important role in influencing the proliferation, invasion and metastasis of cancer cells. The objective is to investigate the prognostic value of CAFs density in esophageal squamous cell carcinoma (ESCC) after surgery. Method: A total of 95 patients who underwent esophagectomy for ESCC in 2007 were included in this study. These specimens were immunostained with α-smooth muscle actin (α-SMA) antibodies to quantify CAFs. Antibodies D2-40 and CD34 were used to evaluate the lymphatic vessel density (LVD) and microvessel density (MVD) of the lesions. The Cox proportional hazards model was used to determine the hazard ratio of CAFs density on 3-year overall survival and 3-year disease-free survival. The correlation between CAFs density and lymphatic vessel density (LVD) or microvessel density (MVD) were analyzed. Results: 3-year overall survival rate in the CAF-poor group (63%) was significantly better than those in the CAF-rich group (42%) (P < 0.01). In the Cox univariate and multivariate analysis of 3-year overall survival, the hazard ratio (HR) of CAFs density was 1.870 (95% CI 1.033-3.385; P = 0.039) and 2.196 (95% CI 1.150-4.193; P = 0.017), respectively. CAFs density was proved to be an independent prognostic factor for 3-year overall survival. CAFs density correlated significantly with increased LVD and MVD in ESCC. Conclusion: CAFs density may be a marker for predicting prognosis and guiding therapeutic management of ESCC.
Keywords: Esophageal squamous cell carcinoma, survival, cancer-associated fibroblasts, lymphatic vessel density, microvessel density
Introduction
Esophageal carcinoma is the eighth most common cancer, and the sixth cause of cancer mortality in the world [1]. The incidence of esophageal cancer varies in different genders and areas. In China and other East Asia countries, more than 90% of cases are esophageal squamous cell carcinoma (ESCC). Esophageal cancer is 3 to 4 times more common among males than females in worldwide. In north China, the area with the highest incidence of ESCC, male patients is more susceptible than female to the ESCC due to tobacco use and alcohol consumption [2]. As a highly lethal disease, the overall survival rate of ESCC is less than 20%. It is important to find new and reliable markers for predicting prognosis and guiding therapeutic management of ESCC.
Carcinoma was long viewed as a disease of transformed epithelial cells. However, tumor progression is not achieved solely by the evolving cancer cells. Stromal components-the microenvironment of the tumor-also play a key role in this process [3]. Fibroblasts are an important component of the tumor stroma. As reactive fibroblasts, carcinoma-associated fibroblasts play an essential role in some aspects of cancer biology including transformation, progression, tumor growth, and drug resistance [4], and their presence in large numbers is often associated with the development of high-grade malignancies and poor prognosis [5]. Recently, CAFs density was proved to be associated with poor prognosis in rectal cancer after chemoradiotherapy, mobile tongue cancer [6,7]. To our knowledge, the prognostic value of CAFs density remained to be explored for ESCC.
The objective of this study was to evaluate the prognostic value of CAFs density in ESCC, and its relationship with lymphatic vessel density (LVD) and microvessel density (MVD).
Materials and methods
Patients and tissue samples
From the database of the Qilu Hospital of Shandong University, we selected patients with ESCC who underwent resection with curative intent at the Department of Thoracic Surgery of the Qilu Hospital from 1 January to 31 December 2007. Patients treated with neoadjuvant therapy which could interfere with the evaluation of CAFs density were excluded, as were patients who died within 30 days after surgery. Patient, tumor and treatment characteristics were retrieved from the Medical Records Room. Both original pathological reports and immunohistochemistry stained sections from the primary tumor were retrieved from the Department of Pathology. All patients signed informed consent to this study, and the protocol was approved by the Ethics Committee of Qilu Hospital of Shandong University.
Histopathological protocol
The available 132 blocks were cut into 5-μm-thick sections and stained with α-SMA monoclonal antibody (clone 1A4, 1:100, Dako A/S, Denmark), D2-40 monoclonal antibody (1:50 Dako A/S, Denmark) and CD34 monoclonal antibody (prediluted, Dako A/S, Denmark). All analyses were performed by at least two of the authors who were unaware of the clinical outcome at the time of analysis.
The α-SMA cases were graded as CAF-rich and CAF-poor group according to CAFs density, similar to a previous description of this technique in tongue and oral squamous cell cancer [8,9]. CAF-rich pattern means dense overlapping of CAFs distributed throughout the tumor predominantly of epithelioid morphology, with essentially no distinct border with the ESCC. And CAF-poor pattern means somewhat less dense, or CAFs not distributed throughout the entire tumor. Each tumor was scored according to the most severe grade (Figure 1).
Figure 1.
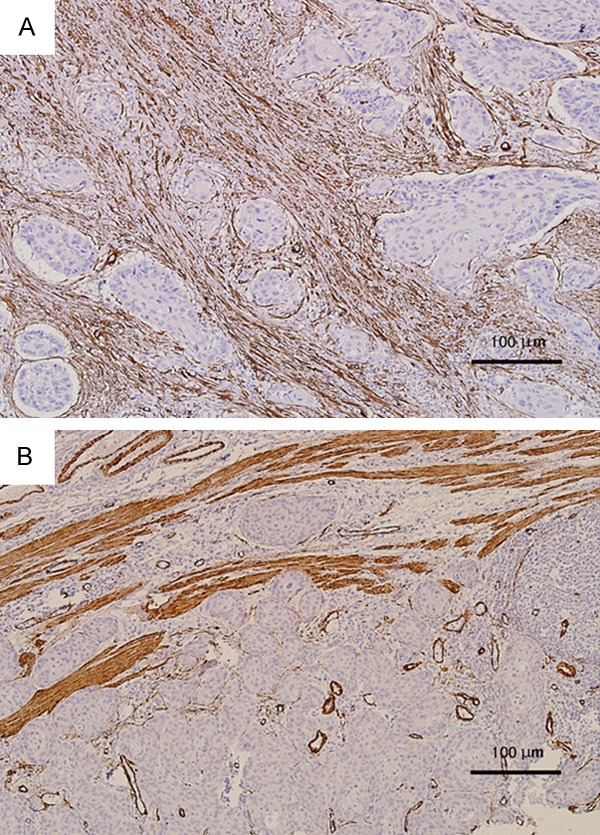
α-SMA-stained 5 μm sections of esophageal squamous cell carcinoma; 100× magnification (10× objective). A. example of CAF-rich (dense overlapping of CAFs distributed throughout the tumor predominantly of epithelioid morphology). B. example of CAF-poor (CAFs not distributed throughout the entire tumor).
LVD was assessed as follows [10]. Briefly, the most vascularized intratumoral and peritumoral areas (hot spot areas) were identified under low magnification (40× and 100×). The number of immunostained lymphatic vessels found in 5 hot spot areas was counted at 200× magnification. Only the vessels exhibiting a typical morphology (lumen) were considered lymphatic vessels (Figure 2). The LVD in each case was expressed as means (total number of vessels in 5 hot spot areas/5).
Figure 2.
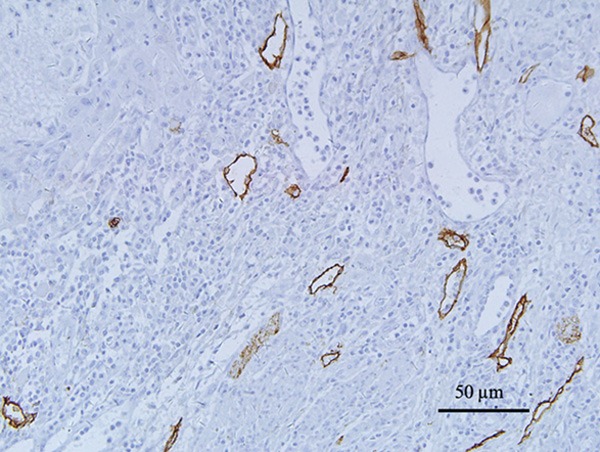
Lymphatic vessel density (LVD) D2-40-stained 5 μm sections of esophageal squamous cell carcinoma; 200× magnification (20× objective). The vessels exhibiting a typical morphology (lumen) were considered lymphatic vessels.
For evaluation of microvessel density, the immunostained sections were scanned at low magnification (×40). Three areas of carcinoma with the greatest number of distinctly highlighted intratumoral microvessels, hot spots, were selected at the same time. Then the slides were evaluated for microvessel counting using ×400 magnification (Figure 3). Depending on the size of the hot spot, 1 to 3 readings were taken. The MVD in each case was expressed as me-ans (total number of vessels in 3 hot spot areas/3).
Figure 3.
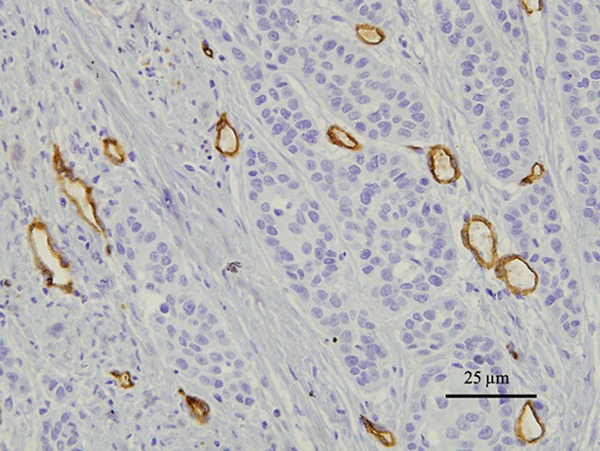
microvessel density (MVD) CD34-stained 5 μm sections of esophageal squamous cell carcinoma; 400× magnification (40× objective). The vessels exhibiting a typical morphology were considered microvessel.
Follow-up
Follow-up data were collected until death or March 2011. All patients had a regular follow-up schedule including a complete history and physical examination every 3 months during the first 2 years after surgery and every 6 months thereafter. Routine radiological examinations were performed.
Statistical analysis
Differences in patient, tumor and treatment characteristics were assessed using the Mann-Whitney test for continuous variables and the chi-square test for categorical variables. The Cohen’s kappa coefficient was used to analyze the variability between the two investigators. The Kaplan-Meier method and Log-Rank test were used for analysis and comparison of survival curves. For the analysis of 3-year disease-free survival, events were defined as first loco-regional or distant tumor relapse or death from any cause. For the analysis of 3-year overall survival, events were defined as death from any cause. The Cox proportional hazards model was used to determine the hazard ratio of variables on 3-year disease-free survival and 3-year overall survival in univariate and multivariate analysis. The Chi-square test was used to compare the relationship between CAFs density and increased LVD or MVD in ESCC.
The results are given as hazard ratios with their 95% confidence interval (CI). P-values < 0.05 were considered statistically significant. Data were analyzed using statistical package SPSS version 17.0 (SPSS Inc, Chicago, IL, USA).
Result
Clinicopathological features
Ninety-five patients (82 men and 13 women) were included in this study. The median age of the patients were 60 (range 42-77) years at the date of surgery. The median follow-up time was 40 (4-50) months of patients. Clinicopathological and treatment characteristics of patients are shown in Table 1.
Table 1.
Patient, tumor and treatment characteristics for patients who underwent esophagectomy for esophageal squamous cell carcinoma, grouped by CAFs density
| Characteristics | Total (n = 95) | CAF-poor (n = 46) | CAF-rich (n = 49) | P-value | |||
|---|---|---|---|---|---|---|---|
|
| |||||||
| No. of patients % | No. of patients % | No. of patients % | |||||
| Gender | 0.674 | ||||||
| Male | 82 | 86.3 | 39 | 84.8 | 43 | 87.8 | |
| Female | 13 | 13.7 | 7 | 15.2 | 6 | 12.2 | |
| Median age at surgery (range) | 60 (42-77) | 62 (42-74) | 60 (42-77) | 0.214 | |||
| Tumor location | 0.898 | ||||||
| Upper | 10 | 10.5 | 5 | 10.9 | 5 | 10.2 | |
| Middle | 56 | 59.0 | 28 | 60.9 | 28 | 57.1 | |
| Low | 29 | 30.5 | 13 | 18.3 | 16 | 32.7 | |
| pN status | 0.302 | ||||||
| pN0 | 56 | 58.9 | 26 | 56.5 | 30 | 61.2 | |
| pN1 | 25 | 26.3 | 11 | 24.0 | 14 | 28.6 | |
| pN2 | 11 | 11.6 | 6 | 13.0 | 5 | 10.2 | |
| PN3 | 3 | 3.2 | 3 | 6.5 | 0 | 0 | |
| pTNM stage | 0.270 | ||||||
| I | 13 | 13.7 | 9 | 19.6 | 4 | 8.2 | |
| II | 47 | 49.5 | 21 | 45.7 | 26 | 53.1 | |
| III | 35 | 36.8 | 16 | 34.8 | 19 | 38.8 | |
| Differentiation grade | 0.406 | ||||||
| Well | 28 | 29.5 | 12 | 26.1 | 16 | 32.7 | |
| Moderate | 40 | 42.1 | 18 | 34.1 | 22 | 44.9 | |
| Poor | 27 | 28.4 | 16 | 34.8 | 11 | 22.4 | |
| Radicality | 0.214 | ||||||
| R0 | 92 | 96.8 | 44 | 95.7 | 48 | 98.0 | |
| R1 | 2 | 2.1 | 2 | 2 | 0 | 0 | |
| R2 | 1 | 1.1 | 0 | 0 | 1 | 2.0 | |
| Adjuvant therapy | 0.470 | ||||||
| No | 47 | 49.5 | 21 | 45.7 | 26 | 53.1 | |
| Yes | 48 | 50.5 | 25 | 54.3 | 23 | 46.9 | |
Abbreviations: TNM, tumor node metastasis; CAFs, Cancer-associated fibroblasts. P-value < 0.05 was considered significant.
CAFs density in esophageal squamous cell carcinoma
Using a 4× and 10× objective, α-SMA stained sections from the primary tumors were analyzed for the presence of CAFs. Estimation of the CAFs density was performed successfully in all tumors. Assessed by two independent researchers, 46 cases were CAF-poor and 49 were CAF-rich. Cohen’s kappa coefficient revealed an almost perfect agreement in two researchers (kappa = 0.81).
Correlation of CAFs density with other prognostic factors
Table 1 shows patient, tumor and treatment characteristics for the CAF-rich and the CAF-poor groups. There were no significant differences between two groups. Follow-up was complete. In the Cox univariate model, CAFs density, lymph node status, pTNM stage and radicality of resection were significantly related to 3-year overall survival. Lymph node status (N3) and pTNM stage (III) were significantly related to 3-year disease-free survival (Table 2). In the Cox multivariate model, CAFs density, pTNM stage and radicality of resection remained independent prognostic factors for 3-year overall survival (Table 3). The hazard ratio of CAFs density was 2.196 (95% CI 1.150-4.193; P = 0.017). 3-year overall survival curves are shown in Figure 4. The difference of survival curves between two groups remained statistically significant (P = 0.034). In univariate analysis, our results suggested that adjuvant therapy was not significantly associated with the 3-year overall survival (Table 2). According to receiving adjuvant therapy or not, the stratified analysis was used for analysis and comparison of survival curves between CAF-poor and CAF-rich group. For patients received no therapy, significant difference was observed between the two groups (P = 0.034) (Figure 5). While for patients received adjuvant therapy, no significant difference was observed between the two groups (P = 0.323) (Figure 6). For 3-year disease-free survival, pTNM stage (III) was proved to be an independent prognostic factor (Table 4). The hazard ratio of pTNM stage (III) was 1.843 (95% CI 1.067-3.184; P = 0.031). CAFs density wasn’t significantly associated with the 3-year disease-free survival (P = 0.405). Tables 5 and 6 show CAFs density in ESCC correlated significantly with increased LVD and MVD.
Table 2.
Cox univariate analysis for 3-year survival and 3-year disease-free survival in 95 patients who underwent esophageal resection for squamous cell carcinoma
| Univariate analysis | ||||||
|---|---|---|---|---|---|---|
|
|
||||||
| 3-year overall survival | 3-year disease-free survival | |||||
|
|
||||||
| HR | 95% CI | P-value | HR | 95% CI | P-value | |
| CAFs density | 0.039 | 0.405 | ||||
| CAF-poor | 1.000 | Ref. | - | 1.000 | Ref. | - |
| CAF-rich | 1.870 | 1.033-3.385 | 0.039 | 1.258 | 0.733-2.160 | 0.405 |
| Differentiation grade | 0.558 | 0.470 | ||||
| Well | 1.000 | Ref. | - | 1.000 | Ref. | - |
| Moderate | 1.450 | 0.699-3.009 | 0.318 | 1.303 | 0.660-2.575 | 0.446 |
| Poor | 1.456 | 0.658-3.207 | 0.351 | 1.573 | 0.763-3.243 | 0.219 |
| Tumor location | 0.359 | 0.426 | ||||
| Upper | 1.000 | Ref. | - | 1.000 | Ref. | - |
| Middle | 2.046 | 0.767-5.460 | 0.153 | 0.780 | 0.327-1.866 | 0.577 |
| Low | 1.296 | 0.659-2.550 | 0.452 | 0.558 | 0.213-1.464 | 0.236 |
| pN status | 0.041 | 0.100 | ||||
| pN0 | 1.000 | Ref. | - | 1.000 | Ref. | - |
| pN1 | 1.772 | 0.900-3.491 | 0.098 | 1.317 | 0.693-2.504 | 0.401 |
| pN2 | 2.534 | 1.121-5.729 | 0.025 | 2.034 | 0.922-4.486 | 0.078 |
| PN3 | 3.557 | 1.060-11.938 | 0.040 | 3.450 | 1.042-11.427 | 0.043 |
| pTNM stage | 0.012 | 0.072 | ||||
| I | 1.000 | Ref. | - | 1.000 | Ref. | - |
| II | 7.830 | 1.053-58.244 | 0.044 | 1.442 | 0.586-3.550 | 0.426 |
| III | 13.730 | 1.854-101.702 | 0.010 | 2.441 | 0.989-6.025 | 0.053 |
| Radicality | 0.048 | 0.070 | ||||
| R0 | 1.000 | Ref. | - | 1.000 | Ref. | - |
| R1 | 3.424 | 0.813-14.432 | 0.094 | 2.363 | 0.568-9.837 | 0.237 |
| R2 | 7.154 | 0.933-54.842 | 0.058 | 8.296 | 1.069-64.351 | 0.043 |
| Adjuvant therapy | 0.449 | 0.215 | ||||
| No | 1.000 | Ref. | - | 1.000 | Ref. | - |
| Yes | 1.252 | 0.700-2.236 | 0.449 | 1.412 | 0.818-2.438 | 0.215 |
Abbreviations: N, pathological node stage; TNM, tumor node metastasis; CAFs, Cancer-associated fibroblasts; HR, hazard ratio; CI, confidence interval. Analysis was performed using the Cox proportion hazard model. P-value < 0.05 was considered significant.
Table 3.
Multivariate Cox analysis for 3 year survival in 95 patients who underwent esophageal resection for squamous cell carcinoma
| Multivariate analysis | |||
|---|---|---|---|
|
|
|||
| 3-year overall survival | |||
|
|
|||
| HR | 95% CI | P-value | |
| pN status (N3) | 2.557 | 0.708-9.234 | 0.020 |
| CAFs density (CAF-rich) | 2.196 | 1.150-4.193 | 0.017 |
| pTNM stage (III) | 2.168 | 1.316-3.572 | 0.002 |
| Radicality (R1-2) | 5.720 | 1.652-19.812 | 0.006 |
Abbreviations: pN, pathological node stage; TNM, tumor node metastasis; CAFs, Cancer-associated fibroblasts; HR, hazard ratio; CI, confidence interval. Analysis was performed using the Cox proportion hazard model. P-value < 0.05 was considered significant.
Figure 4.
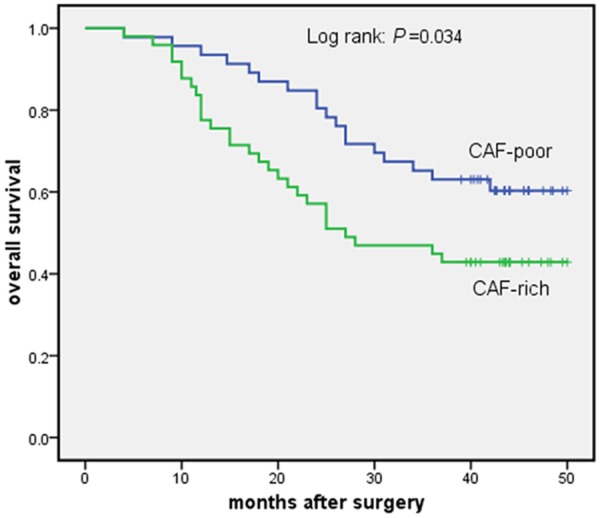
3-year survival curves for all 95 patients who underwent esophagectomy for esophageal squamous cell carcinoma. CAF-poor group versus CAF-rich group.
Figure 5.
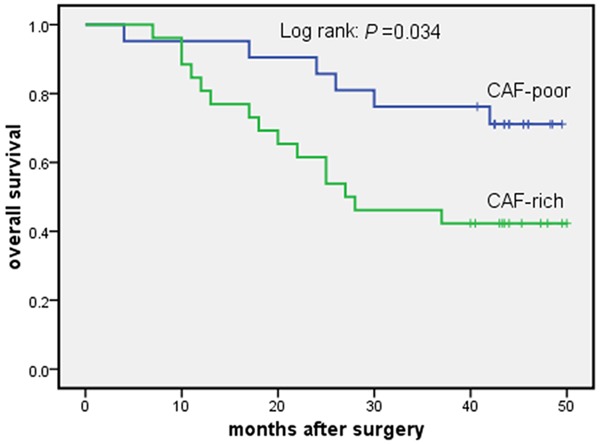
3-year survival curves for patients who received no adjuvant therapy after esophagectomy for esophageal squamous cell carcinoma. CAF-poor group versus CAF-rich group.
Figure 6.
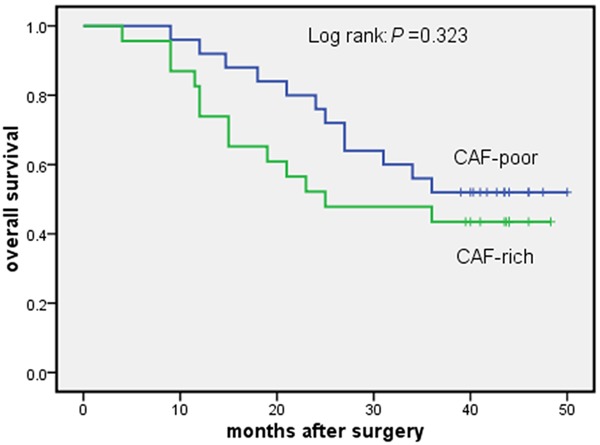
3-year survival curves for patients who received adjuvant therapy after esophagectomy for esophageal squamous cell carcinoma. CAF-poor group versus CAF-rich group.
Table 4.
Multivariate Cox analysis for 3-year disease-free survival in 95 patients who underwent esophageal resection for squamous cell carcinoma
| Multivariate analysis | |||
|---|---|---|---|
|
|
|||
| 3-year disease-free survival | |||
|
|
|||
| HR | 95% CI | P-value | |
| pN status (N3) | 2.193 | 0.650-7.400 | 0.206 |
| pTNM stage (III) | 1.843 | 1.067-3.184 | 0.031 |
| Radicality (R1-2) | 3.156 | 0.964-10.328 | 0.057 |
Abbreviations: pN, pathological node stage; TNM, tumor node metastasis; HR, hazard ratio; CI, confidence interval. Analysis was performed using the Cox proportion hazard model. P-value < 0.05 was considered significant.
Table 5.
Correlation between CAFs density and LVD
| LVD | ||||
|---|---|---|---|---|
|
|
||||
| CAFs density | low | high | r | P-value |
| poor | 29 | 17 | ||
| high | 20 | 29 | 0.222 | 0.030 |
Abbreviations: r, correlation coefficient; CAFs, Cancer-associated fibroblasts; LVD, Lymphatic vessel density. P-value < 0.05 was considered significant.
Table 6.
Correlation between CAFs density and MVD
| MVD | ||||
|---|---|---|---|---|
|
|
||||
| CAFs density | low | high | r | P-value |
| poor | 23 | 23 | ||
| high | 14 | 35 | 0.220 | 0.032 |
Abbreviations: r, correlation coefficient; CAFs, Cancer-associated fibroblasts; MVD, microvessel density. P-value < 0.05 was considered significant.
Discussion
The present investigation showed that CAFs density correlated significantly with increased LVD and MVD, and was associated with poor prognosis of ESCC patients.
The use of CAFs density as a prognostic factor has been introduced by previous studies. After analysis of 128 patients with Mobile tongue squamous cell carcinoma (MTSCC), Ibrahim O. Bello and colleagues found that CAFs density was independently and relatively strongly associated with elevated mortality from MTSCC [7]. Our previous study showed stroma-rich tumors were associated with poor prognosis and an increased risk of relapse in ESCC [11]. Our hypothesis was that CAFs density might be an important prognostic parameter for ESCC.
Ninety-five patients (82 men and 13 women) were included in this study. From the constituent ratio of gender, the male patients are more than female patients. Considering that CAFs density isn’t gender dependent, gender bias didn’t affect analytic results in this study. For 3-year overall survival, we found that CAFs density, lymph node status, pTNM stage and radicality of resection were significantly related to 3-year overall survival in multivariate analysis. And CAFs density may be an independent prognostic factor of ESCC. For patients received no therapy, significant difference was observed between CAF-rich and CAF-poor group. The present study suggested that adjuvant therapy may be beneficial to CAF-rich group. CAFs density may be a marker for guiding therapeutic management of ESCC.
Different molecular mechanisms underlying the tumor-promoting capabilities of CAFs have been emerging to explain why CAFs are associated with poor prognosis of esophageal squamous cell carcinoma.
First, the role of tumor stromal fibroblasts is in promoting tumor progression. Neoangiogenesis is an important pathophysiological process in the growth and progression of cancer. MVD is a quantitative indicator of angiogenesis. And it is regarded as the mark of angiogenesis activity effect. Our results demonstrated that CAFs density in ESCC correlated significantly with increased tumoral MVD. Vascular endothelial growth factor (VEGF) is a potent pro-angiogenic factor that stimulates endothelial cell migration and proliferation [12]. It is believed to play an important role in angiogenesis. As the principal source of host-derived VEGF, CAFs drive vascular network formation through the stimulation of VEGF release [13].
Second, the role of CAFs is in promoting tumor cell metastasis. Tumor lymphangiogenesis is a prognostic indicator for lymph node Metastasis. Lymphatic vessel density (LVD) at tumor sites might be a sensitive prognostic indicator of metastasis to lymph nodes and disease progression. An increase in tumor-associated LVD correlates with lymph node metastasis and unfavorable prognosis in esophageal squamous cell carcinoma [14]. Our results demonstrated that CAFs density in ESCC correlated significantly with increased tumoral LVD. As lymphangiogenic growth factors, expression of VEGF-C by tumor-associated stroma correlated with lymph node metastasis in ESCC [15].
Although our study population was homogenous, the study has its shortcomings. This was a retrospective study with a relatively small sample size and the follow-up time is short. It is of greater value to conduct a prospective study with a larger sample size in the future. And we will investigate the mechanism behind the association between CAFs and prognosis of ESCC at the next period.
The present results clearly showed that tumor stromal fibroblasts could boost neoangiogenesis and lymphangiogenesis, and the CAFs density of the tumor microenviroment had the significant impact on patient survival. CAFs density may be a marker for predicting prognosis and guiding therapeutic management of ESCC. These novel findings may have major consequences on ESCC management and prognosis.
Acknowledgements
We thank Dr Tingguo Zhang (pathologist in Department of Pathology, Shandong University School of Medicine, China) for his expert suggestions and technical assistance. This work was supported by China Postdoctoral Science Foundation 2011M500531 (to Dr Yufeng Cheng), and Science and Technology Planning Project of Shandong Province 2012GGE27088 (to Dr Yufeng Cheng), and Academics Independent Innovation Project Fund 201401252 (to Dr Yufeng Cheng), and Shandong Province Science and Technology Key Project Fund 2014GSF118058 (to Dr Yufeng Cheng) and Ji’nan Municipal Science and Technology Bureau Fund 26010105081212 (to Dr Xiaomei Zhang).
Disclosure of conflict of interest
None.
References
- 1.Jemal A, Bray F, Center MM, Ferlay J, Ward E, Forman D. Global cancer statistics. CA Cancer J Clin. 2011;61:69–90. doi: 10.3322/caac.20107. [DOI] [PubMed] [Google Scholar]
- 2.Feng XS, Yang YT, Gao SG, Ru Y, Wang GP, Zhou B, Wang YF, Zhang PF, Li PY, Liu YX. Prevalence and age, gender and geographical area distribution of esophageal squamous cell carcinomas in North China from 1985 to 2006. Asian Pac J Cancer Prev. 2014;15:1981–1987. doi: 10.7314/apjcp.2014.15.5.1981. [DOI] [PubMed] [Google Scholar]
- 3.Lorusso G, Ruegg C. The tumor microenvironment and its contribution to tumor evolution toward metastasis. Histochem Cell Biol. 2008;130:1091–1103. doi: 10.1007/s00418-008-0530-8. [DOI] [PubMed] [Google Scholar]
- 4.Udagawa T, Wood M. Tumor-stromal cell interactions and opportunities for therapeutic intervention. Curr Opin Pharmacol. 2010;10:369–374. doi: 10.1016/j.coph.2010.06.010. [DOI] [PubMed] [Google Scholar]
- 5.Shimoda M, Mellody KT, Orimo A. Carcinoma-associated fibroblasts are a rate-limiting determinant for tumour progression. Semin Cell Dev Biol. 2010;21:19–25. doi: 10.1016/j.semcdb.2009.10.002. [DOI] [PMC free article] [PubMed] [Google Scholar]
- 6.Saigusa S, Toiyama Y, Tanaka K, Yokoe T, Okugawa Y, Fujikawa H, Matsusita K, Kawamura M, Inoue Y, Miki C, Kusunoki M. Cancer-associated fibroblasts correlate with poor prognosis in rectal cancer after chemoradiotherapy. Int J Oncol. 2011;38:655–663. doi: 10.3892/ijo.2011.906. [DOI] [PubMed] [Google Scholar]
- 7.Bello IO, Vered M, Dayan D, Dobriyan A, Yahalom R, Alanen K, Nieminen P, Kantola S, Laara E, Salo T. Cancer-associated fibroblasts, a parameter of the tumor microenvironment, overcomes carcinoma-associated parameters in the prognosis of patients with mobile tongue cancer. Oral Oncol. 2011;47:33–38. doi: 10.1016/j.oraloncology.2010.10.013. [DOI] [PubMed] [Google Scholar]
- 8.Vered M, Dobriyan A, Dayan D, Yahalom R, Talmi YP, Bedrin L, Barshack I, Taicher S. Tumor-host histopathologic variables, stromal myofibroblasts and risk score, are significantly associated with recurrent disease in tongue cancer. Cancer Sci. 2010;101:274–280. doi: 10.1111/j.1349-7006.2009.01357.x. [DOI] [PMC free article] [PubMed] [Google Scholar]
- 9.Kellermann MG, Sobral LM, da Silva SD, Zecchin KG, Graner E, Lopes MA, Nishimoto I, Kowalski LP, Coletta RD. Myofibroblasts in the stroma of oral squamous cell carcinoma are associated with poor prognosis. Histopathology. 2007;51:849–853. doi: 10.1111/j.1365-2559.2007.02873.x. [DOI] [PubMed] [Google Scholar]
- 10.Mori D, Yamasaki F, Shibaki M, Tokunaga O. Lateral peritumoral lymphatic vessel invasion can predict lymph node metastasis in esophageal squamous cell carcinoma. Mod Pathol. 2007;20:694–700. doi: 10.1038/modpathol.3800786. [DOI] [PubMed] [Google Scholar]
- 11.Wang K, Ma W, Wang J, Yu L, Zhang X, Wang Z, Tan B, Wang N, Bai B, Yang S, Liu H, Zhu S, Cheng Y. Tumor-stroma ratio is an independent predictor for survival in esophageal squamous cell carcinoma. J Thorac Oncol. 2012;7:1457–1461. doi: 10.1097/JTO.0b013e318260dfe8. [DOI] [PubMed] [Google Scholar]
- 12.Dvorak HF, Brown LF, Detmar M, Dvorak AM. Vascular permeability factor/vascular endothelial growth factor, microvascular hyperpermeability, and angiogenesis. Am J Pathol. 1995;146:1029–1039. [PMC free article] [PubMed] [Google Scholar]
- 13.Noma K, Smalley KS, Lioni M, Naomoto Y, Tanaka N, El-Deiry W, King AJ, Nakagawa H, Herlyn M. The essential role of fibroblasts in esophageal squamous cell carcinoma-induced angiogenesis. Gastroenterology. 2008;134:1981–1993. doi: 10.1053/j.gastro.2008.02.061. [DOI] [PMC free article] [PubMed] [Google Scholar]
- 14.Bai B, Ma W, Wang K, Ha S, Wang JB, Tan BX, Wang NN, Yang SS, Jia YB, Cheng YF. Detection of D2-40 monoclonal antibody-labeled lymphatic vessel invasion in esophageal squamous cell carcinoma and its clinicopathologic significance. Cancer Biol Med. 2013;10:81–85. doi: 10.7497/j.issn.2095-3941.2013.02.003. [DOI] [PMC free article] [PubMed] [Google Scholar]
- 15.Krzystek-Korpacka M, Matusiewicz M, Diakowska D, Grabowski K, Blachut K, Banas T. Up-regulation of VEGF-C secreted by cancer cells and not VEGF-A correlates with clinical evaluation of lymph node metastasis in esophageal squamous cell carcinoma (ESCC) Cancer Lett. 2007;249:171–177. doi: 10.1016/j.canlet.2006.08.011. [DOI] [PubMed] [Google Scholar]


