

Abstract
Adeno-associated virus (AAV) vectors are a platform of choice for in vivo gene transfer applications. However, neutralizing antibodies (NAb) to AAV can be found in humans and some animal species as a result of exposure to the wild-type virus, and high-titer NAb develop following AAV vector administration. In some conditions, anti-AAV NAb can block transduction with AAV vectors even when present at low titers, thus requiring prescreening before vector administration. Here we describe an improved in vitro, cell-based assay for the determination of NAb titer in serum or plasma samples. The assay is easy to setup and sensitive and, depending on the purpose, can be validated to support clinical development of gene therapy products based on AAV vectors.
Introduction
In recent years, the field of in vivo gene transfer with adeno-associated virus (AAV) vectors has seen a dramatic expansion in the number of indications approaching the clinic and renewed interest from investors. This phenomenon has been the consequence of promising results obtained in clinical trials of AAV vector-mediated gene therapy for hemophilia B,1–3 Leber's congenital amaurosis,4–6 and others, and the market approval of an AAV gene therapy for the treatment of lipoprotein lipase deficiency in Europe.7
Proof of concept of therapeutic efficacy following AAV vector gene transfer has been obtained for several diseases,8 and the clinical translation of these results is following, although at a slower pace. Humoral immunity directed against the vector capsid has been one of the most important limitations to the development of effective gene therapies with AAV vectors in humans, and remains today an unsolved issue for the field.
Neutralizing antibodies (NAb) directed against AAV have a profound impact on transduction efficiency when the vector is delivered directly into the bloodstream or in any body compartment where immunoglobulin can be found.9 This has been demonstrated in several preclinical and clinical studies, in which the presence of apparently low-titer NAb to AAV was associated with lack of efficacy.1,10–13
Because of the exposure to wild-type AAV, humans develop antibodies directed against the virus capsid as early as 2 years after birth.14–16 This accounts for the high prevalence of anti-AAV antibodies in healthy subjects, which can reach up to 60% for serotypes like AAV2 that are endemic in humans.14–19 Furthermore, because of the high degree of conservation in the amino acid sequence across AAVs,20 anti-AAV antibodies show a high degree of cross reactivity with a wide range of serotypes,17 forcing the exclusion of a substantial number of subjects from enrollment in gene transfer trials with AAV vectors. Aside from natural immunity, high-titer anti-AAV NAb develop following vector administration, persisting for several years and preventing vector readministration. Several groups are studying possible strategies to overcome the limitation posed by NAb to AAV (reviewed in Masat et al.9), and it is hoped that some of these approaches will reach the clinic in the near future.
Currently, the only approach to the issue of anti-AAV NAb in human gene therapy trials has been the exclusion of seropositive subjects. However, effective screening of patients before enrollment in gene therapy trials has proven to be challenging, as assays used to measure antibodies are poorly sensitive in measuring low-titer NAb (which can still completely neutralize vector). The fact that most serotypes other than AAV2 do not infect cell lines efficiently has further limited the development of sensitive in vitro neutralization assays.
Several methods have been proposed to detect anti-AAV antibodies.9 ELISA-based capture assays are easy to set up and give a relatively sensitive measurement of total antibodies binding to AAV, which do not necessarily reflect their neutralizing activity. In vivo assays have also been used to prescreen subjects before enrolment in AAV gene transfer trials2,3,21,22; however, these assays are hard to standardize and validate, and they are time-consuming and more expensive than in vitro methods.
Cell-based in vitro assays are widely used to screen samples for anti-AAV NAb.14,17–19,23,24 These assays are based on the use of a reporter AAV vector that is incubated with the test sample before transduction in vitro of a cell line. While relatively easy to set up, the fact that most AAV serotypes are highly inefficient in transducing cells in vitro forces to use high multiplicity of infections (MOIs) in the assay, resulting in lower sensitivity of detection of antibodies. Additionally, several parameters related to the cell culture conditions are likely to contribute to the variability of the assay, such as the cell line used, the cell density, and the reporter vector preparation.
Here we describe a method for the detection of anti-AAV antibodies using an optimized in vitro neutralization protocol and we provide tools for the determination of the optimal conditions for the assay depending on the AAV serotype. This protocol can be applied to virtually all AAV serotypes and provides a fast measurement of neutralizing activity of a test sample. Furthermore, the assay can be validated to support clinical development of AAV vector-based therapeutics for human use.
Experimental Procedure
The experimental procedure outlined here can be used to determine the neutralizing activity of virtually any body fluid (plasma, serum, synovial fluid, cerebrospinal fluid, etc.) from preclinical and clinical samples. One of the important advantages of this protocol is the use of small volumes of test sample, which in the case of small animal studies or pediatric trials can be a limiting factor.
A visual representation of the protocol is given in Fig. 1. The protocol lasts 3 days from the time of initiation of the cell culture to the end of the assay. The most labor-intensive part of the assay is the preparation of the serial dilutions of the test samples and controls.
FIG. 1.

Outline of the in vitro neutralization assay. Left: tabular view of the assay describing the key steps and the duration of each step. The assay is performed over a period of three days, starting from seeding of cells to the final luciferase activity assay. Right: schematic diagram of the assay illustrating the key steps of the assay, including the preparation of the serial dilutions of samples and controls, neutralization, and final luciferase detection.
Depending on the origin of the samples to test in the assay, particular attention and protective equipment should be used to avoid exposure to specimens potentially carrying infectious agents.
1. Materials
1.1. Reagents
| Reagents | Supplier | Specific handing | Storage conditions |
|---|---|---|---|
| PBS, Ca++ Mg++ free | Life technologies Cat. No. 14190-094 |
Room temperature | |
| Fetal bovine serum (FBS) | Life technologies Cat. No. 10270-106 |
Heat inactivate at 56°C for 30 min before use | −20°C |
| Penicillin/streptomycin | Life technologies Cat. No. 10378-016 |
−20°C | |
| Dulbecco's modified Eagle's medium (DMEM) | Life technologies Cat. No. 31966-021 |
+4°C | |
| TrypLE express enzyme 1×with phenol red | Life technologies Cat. No. 12605-010 |
Room temperature | |
| AAV-luciferase reporter vector with a minimum titer of 1×10¹¹ vg/ml | Research-quality provider | Store in 50 μl aliquots, avoid more than three freeze–thaw cycles | −80°C |
| Cell line | ATCC | To be selected based on the serotype of AAV used | Frozen in liquid nitrogen |
| Ponasterone A | Life technologies Cat. No. 450478 |
Optional, needed if using 2V6.11 cells | −20°C |
| Ethanol 100%, tissue culture grade | VWR Cat. No. 20821296 |
Optional, needed if using 2V6.11 cells | Room Temperature |
| Bright-Glo luciferase assay system | Promega Cat. No. E2620 |
Toxic, contains dithiothreitol, must be prepared under chemical hood | −20°C |
| Trypan blue solution 0.4% | Sigma Cat. No. T8154 |
Toxic, use standard procedures to avoid contact with skin, eyes | Room temperature |
| Positive control: purified IgG or pooled plasma/serum | Commercial vendor | Prepare small single-use aliquots | −80°C |
1.2. Supplies
1.2.1. 500 ml filtering system 0.22 μm, Millipore, Cat. No. SCGPU05RE
1.2.2. White 96-well microplate with clear bottom, sterile, and tissue culture treated, Perkin Elmer, Cat. No. 6005181
1.2.3. 96-well round-bottom microplate, VWR, Cat. No. 7342080
1.2.4. Kova glasstic slides 10 with counting grids for cell counting, KOVA, Cat. No. 87144/E
1.2.5. 50 ml centrifuge/conical tubes, Fisher Scientific, Cat. No. 14-432-22
1.2.6. 15 ml centrifuge/conical tubes, Fisher Scientific, Cat. No. 14-959-49
1.2.7. 12-channel multichannel pipette Finnpipette 1–10 μl, Sigma, Cat. No. Z655643
1.2.8. 12-channel multichannel pipette Finnpipette 5–50 μl, Sigma, Cat. No. Z678031
1.2.9. Reagent reservoirs, Costar, Cat. No. CLS 4870-200EA
1.2.10. Pipet tips
1.2.11. Aluminum foil
1.3. Equipment
1.3.1. Incubator at 37°C and 5% CO2
1.3.2. Water bath
1.3.3. Biological safety cabinet
1.3.4. Microplate luminometer reader Enspire, Perkin Elmer, Cat. No. 2300-001
1.3.5. Inverted microscope
1.3.6. Vortex mixer
1.3.7. Computer equipped with Microsoft Excel
1.3.8. Freezer, −80°C and −20°C
1.3.9. Refrigerator, 2–8°
2. Considerations for Assay Setup
2.1. Choice of the cell line
The choice of the cell line is perhaps the most important parameter to be taken into consideration for the anti-AAV NAb titer assay.
Several cell lines can be used as targets for AAV transduction such as HeLa, HEK 293, and Huh7 cells with a high level of in vitro AAV vector transduction efficiency. However, the poor in vitro transduction efficiency of most AAV serotypes other than AAV2 results in lower assay sensitivity and requires a greater MOI, which results in the underestimation of the AAV NAb titer.
To overcome this limitation and to improve the sensitivity of the assay using a low MOI, it is possible to use permissive cells such as the 2V6.11 cell line.25 These cells are derived from HEK293 cells and express the adenovirus E4 ORF gene product under the control of the ecdysone-inducible promoter.
As an example, the expression of luciferase was measured after transduction of cells with three different AAV serotypes: AAV6, AAV8, and AAV9. As shown in Fig. 2, with all the serotypes tested 2V6.11 cells displayed a greater sensitivity to transduction and a higher reporter gene signal compared with other cell lines even at low MOI. Cell lines other than 2V6.11 can be chosen to establish the anti-AAV NAb assay; however, careful optimization needs to be made to maintain the MOI used in the NAb assay as low as possible.
FIG. 2.

Comparison of the AAV transduction efficiency between 2V6.11 cells and other cell lines. For each experiment, the cells were seeded in a 96-well plate. For the 2V6.11 cells, ponasterone A was added at 1 μg/ml to the medium to induce the expression of the adenoviral gene E4. Next day, the cells were transduced with increasing MOIs of AAV-luciferase vector and the signal was measured 24 hr later. Results are expressed as mean RLU/sec/well/optical density (Bradford protein assay)±standard deviation (error bars). (A) Transduction efficiency obtained with AAV6-luciferase on Huh7 vs. 2V6.11 cell lines. (B) Transduction efficiency obtained with AAV8-luciferase on HEK293 vs. 2V6.11 cell lines. (C) Transduction efficiency obtained with AAV9-luciferase on HeLa RC32 vs. 2V6.11 cell lines. AAV, adeno-associated virus; MOIs, multiplicity of infections; RLU, relative light units.
2.2. AAV reporter vector
The sensitivity of the anti-AAV NAb assay is directly dependent on the ability to detect the reporter transgene following the transduction of a cell line in vitro.
To improve the sensitivity of detection of anti-AAV NAb, it is important to optimize the assay to achieve in vitro levels of reporter transgene expression well above background levels. For example, to overcome the variability in detection of the reporter signal, and to use a reporter with a wide dynamic range of detection, we suggest using the luciferase transgene as reporter.
Additionally, for every new serotype it is necessary to select an optimal MOI to be used in the NAb assay. In Fig. 3 we determined the optimal MOI to be used in an AAV8 NAb assay. 2V6.11 cells were transduced with an increasing MOIs of AAV8 and the luciferase expression was measured 24 hr later. Based on the absolute luciferase signal and variability measured across wells transduced with the same amount of virus, an MOI of ∼200 was chosen for the AAV8 NAb assay. In general, the optimal MOI to be used in the NAb assay should correspond to the lowest amount of virus resulting in a reporter gene signal above background and not saturated; for example, for luciferase a signal of ∼104 relative light units (RLU) will allow for efficient detection of the reporter gene signal, well remaining below the signal saturation level (e.g., >106 RLU).
FIG. 3.

Transduction assay for the determination of the optimal MOI to be used in an AAV8 neutralization assay. The 2V6.11 cells were seeded at 2×10⁴ cells/well in a 96-well microplate with ponasterone A at 1 μg/ml to induce the expression of the adenoviral gene E4. The next day, the cells were transduced with increasing MOIs of AAV8-luciferase vector and the signal was measured 24 hr later. Results are expressed as mean RLU/sec/well/optical density (Bradford protein assay)±standard deviation (error bars).
2.3. Standards and controls
The suitability of AAV neutralization assay requires the presence of a standard to be used to control for the variability of the assay. This control could be a pool of human plasma or serum, or purified human IgG (e.g., intravenous immunoglobulin, IVIg), or a neutralizing monoclonal antibody. A serial dilution of the standard control should be included in every run of the NAb assay to identify any variability, which may lead to erroneous titer determination. As negative minimum signal control (no neutralization), the sample diluent can be used with no reporter virus; the maximum signal control should contain the reporter virus and sample diluent only.
2.4. Selection of the luminescence reader
To choose the optimal luminometer reader, an increasing number of HeLa cells were seeded into a 96-well plate and transduced with AAV2-luciferase vector at an MOI of 5000. The luciferase signal was measured with two readers. As shown in Fig. 4, the choice of the reader can influence the performance of the assay, resulting in up to one-log difference in the luciferase signal readout.
FIG. 4.
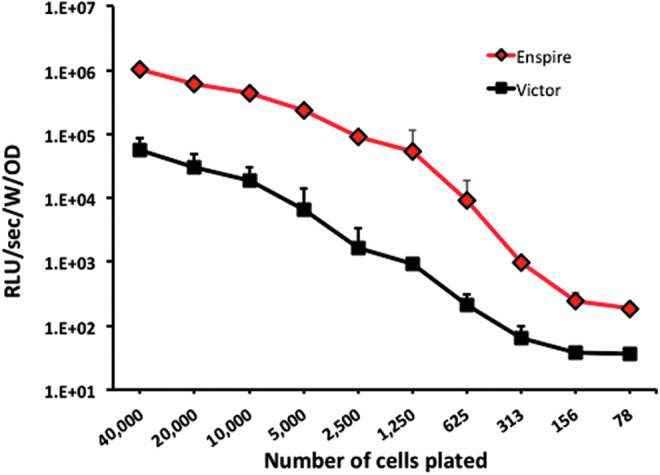
Comparison of the RLU signal measured between two different luminescence readers. HeLa cells were seeded at decreasing number into a 96-well plate and transduced with an AAV2-luciferase vector at an MOI of 5000. The day after, the signal was measured using two different luminescence readers. Black squares, luciferase signal measured with the VICTOR 1420 Multilabel counter (PerkinElmer Life Sciences); red diamonds, luciferase signal measured with the Enspire Multilabel reader (PerkinElmer Life Sciences). Results are expressed as mean RLU/sec/well/optical density (Bradford protein assay)±standard deviation (error bars). Color images available online at www.liebertpub.com/hgtb
3. Reagents Preparation
3.1. AAV-luciferase vector
Here a protocol for anti-AAV8 NAb titer determination is described.
Dilute the AAV8-luciferase vector to a target concentration of 2×10¹¹ vg/ml in 1×PBS (working stock).
Store at −80°C in 50 μl aliquots. Each aliquot undergoes a maximum of three freeze–thaw cycles and can be stored for a maximum of 3 years.
3.2. Complete cell culture medium cDMEM
Add to DMEM, 10% of heat-inactivated FBS, and 1×penicillin/streptomycin. Filter with a 0.22 μm filter unit and store at 4°C for a maximum of 2 months.
3.3. Preparation of the ponasterone A solution
Reconstitute the ponasterone A at 1 mg/ml in 100% ethanol; this will be the 1000×working solution for the assay. Store at −20°C for up to 6 months.
3.4. Test samples
Heat-inactivate the test samples at 56°C for 30 min. The samples can be stored in aliquots at −80°C until tested.
3.5. Diluent serum: FBS
Heat-inactivates the FBS at 56°C for 30 min. Filter the solution through 0.22 μm filter unit. Prepare 4 ml aliquots and store at −20°C up to 6 months. Note that diluents other than FBS can be used (e.g., naïve mouse serum).
3.6. Luciferase reagent based on Bright-Glo luciferase assay system
Handle with care: the reagent contains dithiothreitol, and it is important to prepare it under the chemical hood.
Transfer 100 ml of Bright-Glo buffer to the Bright-Glo substrate.
Mix and incubate for 5 min at room temperature.
Aliquot the solution in 10 ml aliquots and store protected from light (one aliquot of 10 ml is sufficient for one assay plate).
Store at −80°C up to 1 month after reconstitution.
4. Procedure
4.1. Day 1 of the assay: plating of 2V6.11 cells
4.1.1. Trypsinize 2V6.11 cells and count them using trypan blue exclusion.
4.1.2. Dilute the cells to 2×10⁵ cells/ml in cDMEM and add ponasterone A to a final concentration of 1 μg/ml.
4.1.3. Plate the cells in flat-bottom 96-well tissue culture plate at 2×10⁴ cells/100 μl.
4.1.4. Incubate the cells overnight in a 37°C, 5% CO2 incubator.
4.2. Day 2 of the assay: preparation of test sample, controls, and AAV vector for neutralization assay
4.2.1. Observe the cells under the microscope and ensure that they are at ∼50% of confluence.
-
4.2.2. Prepare a dilution cascade of the test sample and control in a plate.
A. Use 96-well U-bottom tissue culture plate as dilution plate.
B. Prepare half-log serial dilution of the test samples and control samples using FBS as diluent.
C. Dilute the sample and control as described in Table 1.
D. For each plate, prepare the following controls:
• 100% vector transduction control
• 0% transduction (signal background)
E. Transfer 20 μl of above dilutions from the dilution plate to a second 96-well U-bottom assay plate.
4.2.3. Prepare the working solution of the AAV-luciferase vector.
Table 1.
Preparation of the Dilution Cascade for the Test Samples and Positive Control
| Dilution cascade for test sample and control | Volume of test sample/control | Volume of diluent (μl) | |
|---|---|---|---|
| Dilution 1 | 1:1 | 40 μl of undiluted material | 0 |
| Dilution 2 | 1:3.16 | 12 μl of dilution 1 | 26 |
| Dilution 3 | 1:10 | 12 μl of dilution 2 | 26 |
| Dilution 4 | 1:31.6 | 12 μl of dilution 3 | 26 |
| Dilution 5 | 1:100 | 12 μl of dilution 4 | 26 |
| Dilution 6 | 1:316 | 12 μl of dilution 5 | 26 |
| Dilution 7 | 1:1000 | 12 μl of dilution 6 | 26 |
| Dilution 8 | 1:3160 | 12 μl of dilution 7 | 26 |
Note: The concentration of the working solution of AAV-luciferase vector depends on the serotype chosen. Here we describe the concentration needed for an anti-AAV8 NAb assay.
A. Dilute the AAV8-luciferase vector to 2×10⁹ vg/ml in DMEM without FBS.
B. 20 μl of AAV-luciferase vector working solution are needed for each test sample and positive control dilution and for maximum control.
-
4.2.4. Prepare the mix of the AAV-luciferase vector with the diluted test and control samples.
A. Transfer 20 μl of the diluted AAV vector to the 20 μl of each of the dilutions of the test and control samples in the second 96-well U-bottom plate using a multichannel pipette.
B. Mix 20 μl of the diluted vector with 20 μl of FBS for the 100% vector transduction. Add 20 μl of DMEM with 20 μl of FBS to one well in the second 96-well U-bottom plate for the 0% transduction.
C. Incubate the dilution plate for 1 hr at 37°C.
4.2.5. Transfer 7.5 μl of each neutralized test sample and control and max and min controls to the assay plate with cells in triplicate. Add the solution directly to the tissue culture medium leaving cells undisturbed. Use the plate layout shown in Table 2.
4.2.6. Wrap the plate in foil to avoid excessive edge-well medium evaporation. Alternatively, leave the edge wells empty.
4.2.7. Incubate the assay plate overnight in the 37°C, 5% CO2 incubator.
Table 2.
Example of Assay Plate Layout
| Positive control | Test sample 1 | Test sample 2 | Test sample 3 | |||||||||
|---|---|---|---|---|---|---|---|---|---|---|---|---|
| 1 | 2 | 3 | 4 | 5 | 6 | 7 | 8 | 9 | 10 | 11 | 12 | |
| A | 1:10 | 1:10 | 1:10 | 1:1 | 1:1 | 1:1 | 1:1 | 1:1 | 1:1 | 1:1 | 1:1 | 1:1 |
| B | 1:31.6 | 1:31.6 | 1:31.6 | 1:3.16 | 1:3.16 | 1:3.16 | 1:3.16 | 1:3.16 | 1:3.16 | 1:3.16 | 1:3.16 | 1:3.16 |
| C | 1:100 | 1:100 | 1:100 | 1:10 | 1:10 | 1:10 | 1:10 | 1:10 | 1:10 | 1:10 | 1:10 | 1:10 |
| D | MAX | MAX | MAX | 1:31.6 | 1:31.6 | 1:31.6 | 1:31.6 | 1:31.6 | 1:31.6 | 1:31.6 | 1:31.6 | 1:31.6 |
| E | MIN | MIN | MIN | 1:100 | 1:100 | 1:100 | 1:100 | 1:100 | 1:100 | 1:100 | 1:100 | 1:100 |
| F | 1:316 | 1:316 | 1:316 | 1:316 | 1:316 | 1:316 | 1:316 | 1:316 | 1:316 | 1:316 | 1:316 | 1:316 |
| G | 1:1000 | 1:1000 | 1:1000 | 1:1000 | 1:1000 | 1:1000 | 1:1000 | 1:1000 | 1:1000 | 1:1000 | 1:1000 | 1:1000 |
| H | 1:3160 | 1:3160 | 1:3160 | 1:3160 | 1:3160 | 1:3160 | 1:3160 | 1:3160 | 1:3160 | 1:3160 | 1:3160 | 1:3160 |
MAX, virus only, no neutralizing antibodies, max luciferase signal; MIN, no virus, background luciferase signal.
Ratios in the cells of the column represent the dilutions of the samples loaded in triplicate.
4.3. Day 3 of the assay: cell lysis and measurement of the luciferase activity
4.3.1. Prepare the desired number of aliquots of Bright-Glo luciferase assay system and bring them to room temperature.
4.3.2. Observe the cells under the microscope. Cover the bottom of the 96-well culture plate with the white film provided with the white 96-well culture plate to avoid light bleeding between each well and to reduce the background during the luminescence reading in the luminometer.
4.3.3. Place the plate at room temperature for 15 min.
4.3.4. Add 100 μl of cell lysis and substrate reagent in each well and wait for at least 3 min to allow complete cell lysis.
-
4.3.5. Measure luminescence. If using an Enspire reader, apply the following parameters:
• Number of assay repeat: 1
• Number of plate repeats: 1
• Mode of measurement: By rows bidirectional
• Plate type: 96 ViewPlate
• Measured: By well
• Measurement time: 1 sec
5. Calculation of the Anti-AAV Neutralizing Antibody Titer
Critical step: Before the calculation of the neutralizing titer of the test sample, the positive sample control must have the expected titer and the negative (minimum signal) control must be close to the background reading of luciferase (<102 RLU). If these controls are out of the specifications, the assay is rejected and needs to be repeated.
A. Calculate the average luciferase signal for each sample/control and subtract the average minimum transduction value (no virus) from triplicates wells.
B. Percent luciferase expression=[(test sample luciferase reading−no virus luciferase signal)/(max luciferase signal−no virus luciferase signal)]×100
C. Percent luciferase inhibition=100−percent luciferase expression
D. The neutralizing titer of the sample is determined as the first dilution at which 50% or greater inhibition of the luciferase expression is measured. For example, if 50% or greater inhibition is observed at a 1:10 dilution of the sample, the titer is reported as 1:10.
Note on the interpretation of results: Borderline NAb titers may pose a challenge to the interpretation of results. For example, the table below shows the case of a sample with a neutralizing titer of 1:10, at which 51% inhibition of the luciferase signal is measured. As the percent inhibition is close to the cutoff of 50% inhibition, it can be easily affected by the assay variability. In this case, and when the percent inhibition falls within a range of 45–55%, it is suggested to confirm the NAb titer of the sample.
| Dilution | % Inhibition |
|---|---|
| 1:1 | 100 |
| 1:3.16 | 80 |
| 1:10 | 51 |
| 1:31.6 | 20 |
| 1:100 | 5 |
| 1:316 | 0 |
| 1:1000 | 0 |
Troubleshooting
| Problem | Solution |
|---|---|
| High variability of readout across triplicate wells | Check the amount of cells plated; too many cells create debris that can interfere with luminescence detection. |
| The NAb titer of positive control is out of the expected range | Repeat the dilution cascade; Verify accuracy of the multichannel. |
| Low level of luciferase signal | 2V6.11 cells have been seeded without ponasterone A. |
| Check the MOI used in the assay. | |
| Check for mistakes during the preparation of the working solution of the AAV. | |
| The AAV aliquot has gone through too many freeze–thaw cycles. | |
| Check for bacterial contamination of the cells. | |
| The luciferase substrate reagent is old. | |
| The RLU of the Max luciferase signal control is higher than the highest dilution of the test sample (1:3160) | Check higher dilutions of the test sample. Check for inhibitory activity of the matrix of the sample on AAV transduction. |
Validation of Cell-Based Assays to Measure Neutralizing Antibodies
Assessment of immunogenicity during preclinical and clinical trials requires the use of validated analytical methods. Validation is an ongoing process during product development, aimed at ensuring the most accurate evaluation of safety and efficacy of the product itself. The process has to start from the preclinical studies and the full validation study has to be completed before the time of license application.
Several regulatory guidelines exist to help researchers or industries to validate their immunogenicity testing assays.26,27 However, harmonization of cell-based assays for the detection of NAb is not easy. Gupta and colleagues in 2007 and 201128,29 published recommendations for the qualification and validation of such assays, respectively, and their guidelines clearly illustrate the gap between a standard protocol and a formal validated method.
The qualification of one assay will provide information on the drug standard curve (dose–response experiment), positive control curve, preliminary cut point, and preliminary sensitivity. Different points have then to be addressed to perform the formal validation of a cell-based assay.
1. Cut point (threshold) determination
The cut point is defined as the threshold above which a sample is considered positive for neutralizing activity; for this purpose, it is necessary to
1.1. Analyze a sufficient number of naïve samples (at least 30) at the minimum required dilution.
-
1.2. Perform statistical analysis to calculate the cut point.
1.2.1. Analyze value distribution. In case of nonnormal distribution, it can be useful to transform data (log transformation, for example).
1.2.2. Eliminate outliers.
1.2.3. Calculate the cut point from a statistical analysis by choosing the desired rate of false-positive results (usually 1–5%).
1.2.4. Determine from the mean and median analysis whether the cut point should be fixed or floating.
1.3. Note: Cut point should be statistically determined, but that requires the use of a high number of naïve samples, which are not always easy to get. In this case, subjective cut points such as “50% transduction inhibition threshold” can be useful. Attention must, however, be paid to samples bearing a high intrinsic neutralizing activity that can generate too much false-positive results when using this cut point calculation.
2. Sensitivity
The sensitivity describes the smallest amount of NAb that can reproducibly be detected in the assay.
2.1. Dilute positive control into assay matrix and perform the assay.
2.2. Make sure that at least one dilution gives results below the cut point.
-
2.3. Determine the positive control concentration that crosses the cut point.
2.3.1. Through linear regression: Trace a line between the value just above and the value just below the cut point. This method is easier but less precise than the following.
2.3.2. In alternative, use a four-parameter regression model.
2.4. Note: This assay should be performed at least six times by at least two different operators on at least two different days.
3. Quality controls
Quality controls have to be included to ensure standardization of the assays.
3.1. The titer quality control consists in serial dilutions of the positive control; it allows determining assay precision and should be included throughout study duration.
3.2. The low quality control refers to a concentration of positive control that leads to a reproducible transduction inhibition just above the cut point. It can be determined from sensitivity experiments and should be included in every run. Other quality controls could be useful such as a high quality control.
4. Specificity
The aim is to determine whether the observed transduction inhibition is really because of target NAb. Here are two examples of what can be done.
-
4.1. Influence of nonrelevant antibodies (in the case of anti-AAV immune response, it can be interesting to study the impact of NAb against other AAV serotypes).
4.1.1. Use quality controls spiked with different concentrations of a competitive antibody.
4.1.2. Determine the highest concentration of competitive antibody that does not interfere with quality control signal.
-
4.2. Immunodepletion
4.2.1. Treat controls with an appropriate depletion column.
4.2.2. Samples after the column should have a lower inhibition activity than before. Note that depending on the isotype(s), resin must be carefully chosen.
5. Assay precision
Intra-assay and inter-assay precisions have to be determined.
5.1. Perform at least three runs of positive controls the same day by the same operator to assess intra-assay repeatability. Ideally, position of the different samples should be changed between assay plates.
5.2. Perform at least six runs of positive controls on at least two different days by at least two different operators to assess inter-assay precision.
5.3. Determine the acceptable % coefficient of variation (CV) between runs; titer precision should fall within one dilution.
6. Selectivity
Selectivity analysis allows determining the influence of other matrix elements on the observed response.
-
6.1. Matrix interference
6.1.1. Use positive control at the low quality control level spiked into the test sample matrix. Whenever applicable, include samples from diseased individuals. Perform the assay as usual. This step is particularly important if the disease is known to affect blood parameters (hemolysis, for example).
6.1.2. % CV between naïve and diseased samples should be reported.
-
6.2. Drug interference
6.2.1. Incubate the positive control with an excess of drug. Residual drug can inhibit detection of NAb even if in the case of AAV vectors this is not expected to be a major issue.30
6.2.2. The highest concentration of drug that does not interfere with the neutralizing activity of the positive control should be reported.
7. Robustness/stability
Robustness allows determining whether voluntary minor changes of the protocol reflecting routine variations will affect the result. Here are some examples of parameters that can be assessed.
7.1. Evaluate the influence of multiple passages on cells permissivity. Report the maximum acceptable cell passage number.
7.2. Test different incubation times on critical steps of the assay (transduction, seroneutralization, revelation) and report acceptable ranges.
7.3. Virus stability should be assessed through multiple freeze–thaw cycles.
7.4. Multiple conditions of sample's storage should be evaluated.
Acknowledgments
This work was supported by Genethon and Genosafe, the European Union (FP7-PEOPLE-2012-CIG Grant 333628; ERC-2013-CoG Grant 617432; to F.M.), the Bayer Early Career Investigator Award (to F.M.), and the DIM of Biotherapies (to A.M.)
Author Disclosure Statement
S.T. and L.J.-L. are employees of Genosafe, a company offering immunomonitoring services. F.M. is consultant for Genosafe but does not receive financial compensation for this work. F.M. is inventor in patents describing the AAV technology and describing assays for immunomonitoring in AAV gene transfer. All other authors declare no conflict of interest.
References
- 1.Manno CS, Pierce GF, Arruda VR, et al. Successful transduction of liver in hemophilia by AAV-Factor IX and limitations imposed by the host immune response. Nat Med 2006;12:342–347 [DOI] [PubMed] [Google Scholar]
- 2.Nathwani AC, Reiss UM, Tuddenham EG, et al. Long-term safety and efficacy of factor IX gene therapy in hemophilia B. N Engl J Med 2014;371:1994–2004 [DOI] [PMC free article] [PubMed] [Google Scholar]
- 3.Nathwani AC, Tuddenham EG, Rangarajan S, et al. Adenovirus-associated virus vector-mediated gene transfer in hemophilia B. N Engl J Med 2011;365:2357–2365 [DOI] [PMC free article] [PubMed] [Google Scholar]
- 4.Bainbridge JW, Smith AJ, Barker SS, et al. Effect of gene therapy on visual function in Leber's congenital amaurosis. N Engl J Med 2008;358:2231–2239 [DOI] [PubMed] [Google Scholar]
- 5.Cideciyan AV, Aleman TS, Boye SL, et al. Human gene therapy for RPE65 isomerase deficiency activates the retinoid cycle of vision but with slow rod kinetics. Proc Natl Acad Sci USA 2008;105:15112–15117 [DOI] [PMC free article] [PubMed] [Google Scholar]
- 6.Maguire AM, Simonelli F, Pierce EA, et al. Safety and efficacy of gene transfer for Leber's congenital amaurosis. N Engl J Med 2008;358:2240–2248 [DOI] [PMC free article] [PubMed] [Google Scholar]
- 7.Buning H. Gene therapy enters the pharma market: the short story of a long journey. EMBO Mol Med 2013;5:1–3 [DOI] [PMC free article] [PubMed] [Google Scholar]
- 8.Mingozzi F, High KA. Therapeutic in vivo gene transfer for genetic disease using AAV: progress and challenges. Nat Rev Genet 2011;12:341–355 [DOI] [PubMed] [Google Scholar]
- 9.Masat E, Pavani G, Mingozzi F. Humoral immunity to AAV vectors in gene therapy: challenges and potential solutions. Discov Med 2013;15:379–389 [PubMed] [Google Scholar]
- 10.Arruda VR, Stedman HH, Haurigot V, et al. Peripheral transvenular delivery of adeno-associated viral vectors to skeletal muscle as a novel therapy for hemophilia B. Blood 2010;115:4678–4688 [DOI] [PMC free article] [PubMed] [Google Scholar]
- 11.Haurigot V, Mingozzi F, Buchlis G, et al. Safety of AAV factor IX peripheral transvenular gene delivery to muscle in hemophilia B dogs. Mol Ther 2010;18:1318–1329 [DOI] [PMC free article] [PubMed] [Google Scholar]
- 12.Jiang H, Couto LB, Patarroyo-White S, et al. Effects of transient immunosuppression on adenoassociated, virus-mediated, liver-directed gene transfer in rhesus macaques and implications for human gene therapy. Blood 2006;108:3321–3328 [DOI] [PMC free article] [PubMed] [Google Scholar]
- 13.Scallan CD, Jiang H, Liu T, et al. Human immunoglobulin inhibits liver transduction by AAV vectors at low AAV2 neutralizing titers in SCID mice. Blood 2006;107:1810–1817 [DOI] [PubMed] [Google Scholar]
- 14.Calcedo R, Morizono H, Wang L, et al. Adeno-associated virus antibody profiles in newborns, children, and adolescents. Clin Vaccine Immunol 2011;18:1586–1588 [DOI] [PMC free article] [PubMed] [Google Scholar]
- 15.Erles K, Sebokova P, Schlehofer JR. Update on the prevalence of serum antibodies (IgG and IgM) to adeno-associated virus (AAV). J Med Virol 1999;59:406–411 [DOI] [PubMed] [Google Scholar]
- 16.Li C, Narkbunnam N, Samulski RJ, et al. Neutralizing antibodies against adeno-associated virus examined prospectively in pediatric patients with hemophilia. Gene Ther 2012;19:288–294 [DOI] [PubMed] [Google Scholar]
- 17.Boutin S, Monteilhet V, Veron P, et al. Prevalence of serum IgG and neutralizing factors against adeno-associated virus (AAV) types 1, 2, 5, 6, 8, and 9 in the healthy population: implications for gene therapy using aav vectors. Hum Gene Ther 2010;21:704–712 [DOI] [PubMed] [Google Scholar]
- 18.Calcedo R, Vandenberghe LH, Gao G, et al. Worldwide epidemiology of neutralizing antibodies to adeno-associated viruses. J Infect Dis 2009;199:381–390 [DOI] [PMC free article] [PubMed] [Google Scholar]
- 19.Mingozzi F, Chen Y, Edmonson SC, et al. Prevalence and pharmacological modulation of humoral immunity to AAV vectors in gene transfer to synovial tissue. Gene Ther 2013;20:417–424 [DOI] [PMC free article] [PubMed] [Google Scholar]
- 20.Gao GP, Alvira MR, Wang L, et al. Novel adeno-associated viruses from rhesus monkeys as vectors for human gene therapy. Proc Natl Acad Sci USA 2002;99:11854–11859 [DOI] [PMC free article] [PubMed] [Google Scholar]
- 21.Sun L, Tu L, Gao G, et al. Assessment of a passive immunity mouse model to quantitatively analyze the impact of neutralizing antibodies on adeno-associated virus-mediated gene transfer. J Immunol Methods 2013;387:114–120 [DOI] [PubMed] [Google Scholar]
- 22.Wang L, Calcedo R, Wang H, et al. The pleiotropic effects of natural AAV infections on liver-directed gene transfer in macaques. Mol Ther 2010;18:126–134 [DOI] [PMC free article] [PubMed] [Google Scholar]
- 23.Halbert CL, Miller AD, Mcnamara S, et al. Prevalence of neutralizing antibodies against adeno-associated virus (AAV) types 2, 5, and 6 in cystic fibrosis and normal populations: implications for gene therapy using AAV vectors. Hum Gene Ther 2006;17:440–447 [DOI] [PMC free article] [PubMed] [Google Scholar]
- 24.Moskalenko M, Chen L, Van Roey M, et al. Epitope mapping of human anti-adeno-associated virus type 2 neutralizing antibodies: implications for gene therapy and virus structure. J Virol 2000;74:1761–1766 [DOI] [PMC free article] [PubMed] [Google Scholar]
- 25.Mohammadi ES, Ketner EA, Johns DC, et al. Expression of the adenovirus E4 34k oncoprotein inhibits repair of double strand breaks in the cellular genome of a 293-based inducible cell line. Nucleic Acids Res 2004;32:2652–2659 [DOI] [PMC free article] [PubMed] [Google Scholar]
- 26.European Medicines Agency. Guideline on Immunogenicity Assessment of Biotechnology-Derived Therapeutic Proteins. EMA/CHMP/BMWP/14327/2006. 2007
- 27.U.S. Food and Drug Administration. Guidance for Industry: Immunogenicity Assessment for Therapeutic Protein Products (Draft), 2013 [Google Scholar]
- 28.Gupta S, Indelicato SR, Jethwa V, et al. Recommendations for the design, optimization, and qualification of cell-based assays used for the detection of neutralizing antibody responses elicited to biological therapeutics. J Immunol Methods 2007;321:1–18 [DOI] [PubMed] [Google Scholar]
- 29.Gupta S, Devanarayan V, Finco D, et al. Recommendations for the validation of cell-based assays used for the detection of neutralizing antibody immune responses elicited against biological therapeutics. J Pharm Biomed Anal 2011;55:878–888 [DOI] [PubMed] [Google Scholar]
- 30.Zincarelli C, Soltys S, Rengo G, et al. Analysis of AAV serotypes 1–9 mediated gene expression and tropism in mice after systemic injection. Mol Ther 2008;16:1073–1080 [DOI] [PubMed] [Google Scholar]