

Abstract
Background and Purpose
Non-competitive drugs that confer allosteric modulation of orthosteric ligand binding are of increasing interest as therapeutic agents. Sought-after advantages include a ceiling level to drug effect and greater receptor-subtype selectivity. It is thus important to determine the mode of interaction of newly identified receptor ligands early in the drug discovery process and binding studies with labelled orthosteric ligands constitute a traditional approach for this. According to the general allosteric ternary complex model, allosteric ligands that exhibit negative cooperativity may generate distinctive ‘competition’ curves: they will not reach baseline levels and their nadir will increase in par with the orthosteric ligand concentration. This behaviour is often considered a key hallmark of allosteric interactions.
Experimental Approach
The present study is based on differential equation-based simulations.
Key Results
The differential equation-based simulations revealed that the same ‘competition binding’ pattern was also obtained when a monovalent ligand binds to one of the target sites of a heterobivalent ligand, even if this process is exempt of allosteric interactions. This pattern was not strictly reciprocal when the binding of each of the ligands was recorded. The prominence of this phenomenon may vary from one heterobivalent ligand to another and we suggest that this phenomenon may take place with ligands that have been proposed to bind according to ‘two-domain’ and ‘charnière’ models.
Conclusions and Implications
The present findings indicate a familiar experimental situation where bivalency may give rise to observations that could inadvertently be interpreted as allosteric binding. Yet, both mechanisms could be differentiated based on alternative experiments and structural considerations.
Tables of Links
| TARGETS |
|---|
| β2-adrenoceptor |
| LIGANDS |
|---|
| Salmeterol |
These Tables list key protein target and ligand in this article which are hyperlinked to corresponding entries in http://www.guidetopharmacology.org, the common portal for data from the IUPHAR/BPS Guide to PHARMACOLOGY (Pawson et al., 2014) and are permanently archived in the Concise Guideto PHARMACOLOGY 2013/14 (Alexander et al., 2013).
Introduction
It is important to determine the mode of interaction of newly identified receptor ligands early in the drug discovery process in order to select the most appropriate mechanism for a given therapeutic benefit. In this respect, drugs that confer allosteric modulation of orthosteric ligand binding and/or function is of increasing interest to the drug discovery industry as it offers the potential advantages of a ceiling level to the drug effect and greater receptor-subtype selectivity (Christopoulos and Kenakin, 2002). As the altered functional properties have been extensively covered in the recent review articles (Kamal and Jockers, 2009; Valant et al., 2012; Lane et al., 2013a), we will focus our attention on the binding properties. A particular attribute of allosteric ligands is that their effects are saturable, that is once they saturate their binding site on the receptor there is no further effect on the orthosteric ligand. In Schild-type functional experiments this results in only limited shifts of the concentration-response curves of orthosteric agonists. In competition-binding studies with radiolabelled orthostatic ligands, the same phenomenon could produce only partial maximal inhibition in the case of negative cooperativity (Christopoulos and Kenakin, 2002; Hoare, 2007).
The general allosteric ternary complex model (ATCM, Model 1 in Figure 1) provides the simplest means to conceptualize these phenomena (Stockton et al., 1983; Christopoulos, 2002; Christopoulos and Kenakin, 2002). This model stipulates that each ligand may trigger a conformational change within the target and thereby modulate the affinity of the other ligand and vice versa. Of note is that ligand affinity depends on its even more fundamental association and/or dissociation rate constants. This is why allosteric phenomena may be better detected by determining the rate of radioligand dissociation in wash-out experiments. If the dissociation is faster in the presence of an excess of unlabelled ligand than in fresh wash-out medium alone, it is often attributed to negative allosteric modulation (Kostenis and Mohr, 1996; Springael et al., 2006; De Meyts et al., 2009).
Figure 1.
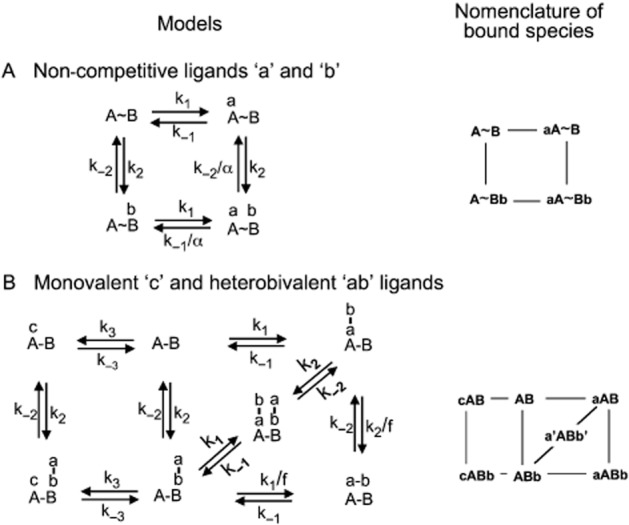
Schematic representation of (A) the general allosteric ternary complex model (ATCM) and (B) heterobivalent ligand-target site interactions in the presence of a competing monovalent ligand. The abbreviated notation for the free and bound target species is presented in the right panels. Free ligands are not included in the model for the sake of simplicity. (A) ATCM (Stockton et al., 1983; Christopoulos, 2002; Christopoulos and Kenakin, 2002): two monovalent ligands, ‘a’ and ‘b’, bind to distinct, non-overlapping binding sites, ‘A’ and ‘B’, which are located on the same molecule or molecular complex. All binding events are bimolecular and obey the law of mass action; k1 and k2 (in M−1·min−1) are the association and k−1 and k−2 (in min−1) the dissociation rate constants for a-A and b-B binding respectively. Each binding event modulates the other ligand's binding affinity via a conformational change in the complex. The modulation is reciprocal and is quantified by the cooperativity factor α. Positive cooperativity (α > 1) implies a mutual increase in affinity and negative cooperativity (α < 1) implies a mutual decrease in affinity. (B) Thermodynamic cycle model (Kaufman and Jain, 1992; Plückthun and Pack, 1997; Kramer and Karpen, 1998; Vauquelin and Charlton, 2013) relating the interaction of a heterobivalent ligand ‘ab’ to the target ‘AB’. The pharmacophores of ‘ab’, ‘a’ and ‘b’, are linked by a flexible spacer arm and the distance ‘r’ refers to their maximal separation. Their respective binding sites at ‘AB’, ‘A’ and ‘B’, are separated by less than ‘r’ so that both binding events can take place alongside each other. Each binding event is a reversible bimolecular process obeying the law of mass action and ‘a’ can only bind to ‘A’ and ‘b’ can only bind to ‘B’. k1 and k2 (in M−1·min−1) are the association, and k−1 and k−2 (in min−1) are the dissociation rate constants for a-A and b-B binding respectively. When only one pharmacophore (either ‘a’ or ‘b’) is bound, the local concentration, [L], of the other pharmacophore will correspond to that of one molecule in half of a sphere with radius ‘r’ (Kaufman and Jain, 1992; Plückthun and Pack, 1997). A penalty factor, ‘f’, which deals with, for example, limited rotational freedom of this latter pharmacophore was introduced along with the ability of two bivalent ligands to simultaneously occupy the target to form the trimeric a‘ABb’ complex (Vauquelin, 2013; Vauquelin and Charlton, 2013). The monovalent ligand ‘c’ can only bind to ‘A’. The c-A interaction is also a reversible bimolecular process obeying the law of mass action with k3 (in M−1·min−1) and k−3 (in min−1) as the respective association and dissociation rate constants. It is further assumed that ‘a’ and ‘c’ bind to ‘A’ in a competitive fashion and that both binding events leave the b-B interaction undisturbed and vice versa.
However, allosteric modulation of receptor conformation is not the only explanation for such experimental observations. Especially for accelerated dissociation, it has been shown that it may also reflect the ability of unlabelled competitive ligands to effectively prevent the rebinding of freshly dissociated radioligand molecules to their targets, especially when their free diffusion away is hindered by physical obstacles such as in synapses (Perry et al., 1980; Sadée et al., 1982; Goldstein and Dembo, 1995; Fierens et al., 1999; Coombs and Goldstein, 2004; Vauquelin and Charlton, 2010). An even more severe form of rebinding may take place with bivalent radioligands when their target sites are sufficiently close to one another to allow their simultaneous occupancy by both pharmacophores of the radioligand (Model 2 in Figure 1) (Vauquelin, 2013; Vauquelin and Charlton, 2013). In this case, the binding of the first pharmacophore will prompt the second one to stay proximal to its cognate target site, thereby increasing its probability to bind, or bind again when freshly dissociated (Kaufman and Jain, 1992; Plückthun and Pack, 1997; Kramer and Karpen, 1998). The resulting synergy produces a significant increase in the bivalent radioligand's overall affinity (a phenomenon often denoted as avidity) as well as in its overall residence time. Here again, unlabelled ligands are able to accelerate the dissociation process, even when they can only occupy one of the target sites (Kramer and Karpen, 1998; Vauquelin and Van Liefde, 2012; Vauquelin and Charlton, 2013).
Much less attention has hitherto been devoted to explanations that transcend the level of mere experimental artefacts with regard to other experimental manifestations of allostery, namely the limited shifts of agonist concentration-response curves and incomplete competition in radioligand binding experiments. Yet, the potential existence of such alternatives has been hinted at by Hoare (2007) for class B GPCRs. According to the two-domain model that this author proposed, peptide agonists should first bind to the extracellular N-terminal domain of such receptors and, by acting as an affinity trap, this initial interaction should promote the subsequent binding of a distinct portion of the peptide with a juxtamembrane, ‘J’, domain of the receptor. Equations that were based on this model brought to light that unlabelled ligands that only bind to this J domain should also only be partially competitive in binding studies with the labelled peptide and vice versa and, most importantly, that this should take place in the absence of any allosteric interaction. To explain this behaviour, Hoare invoked the ‘Charnière’ effect that originally accounted for the behaviour of antagonists that bear two functional groups connected by a hinge region (Rocha e Silva, 1969). Of note is that this effect also plays a central role in the ‘exosite’ model that has been particularly invoked to conceptualize the behaviour of the β2 adrenoceptor agonist salmeterol (Johnson et al., 1993; Clark et al., 1996; Coleman et al., 1996).
The two-domain model and the exosite models require the affected ligands, be it large peptides or small synthetic molecules, to be heterobivalent. The hitherto most comprehensive description of (hetero)bivalent ligand-target interactions are provided by a thermodynamic cycle model that allows each one of the pharmacophores to initiate the binding process (Daum et al., 2007; Steinfeld et al., 2007; Vauquelin and Charlton, 2013). Such models have been modified to allow a monovalent ligand to compete with the binding of only one of the pharmacophores and differential equation-based simulations were recently carried out to explore heterobivalent ligand behaviour at any incubation time as well as in different experimental settings (Vauquelin, 2013; Vauquelin and Charlton, 2013). By adopting this approach, we here show that partial competitivity such as described by Hoare (2007) also complies with the general thermodynamic cycle model and that the prominence of this effect may vary from one labelled heterobivalent ligand to another.
Models, general methodological considerations and nomenclature
The two ligand-target interaction mechanisms that will be considered here are schematically represented in Figure 1 and documented in the legend thereof. They have in common that the binding of each ligand/pharmacophore (‘a’, ‘b’ and ‘c’) to its cognate target site (‘A’, ‘B’ and ‘A’, respectively) is a simple, reversible bimolecular process that obeys the law of mass action. Association and dissociation rate constants are denoted as k1 (in M−1·min−1) and k−1 (in min−1) for the a-A interaction, k2 and k−2 for the b-B interaction and k3 and k−3 for the c-A interaction.
In the general ATCM (Model A in Figure 1), the cooperativity factor, α, corresponds to the value by how much the affinity of the ligands change as a result of the allosteric process. As the affinity of a monovalent ligand is governed by its association and dissociation rate constants, α may reflect changes in one of them or even both together. For the present simulations, α = 0.1 (i.e. negative cooperativity) and only affects k−1 and k−2. No such cooperativity is involved in the presently used heterobivalent ligand binding model (Model B in Figure 1). All binding events are bimolecular and obey the law of mass action. The concentration of ‘a’ and ‘b’ corresponds to that the concentration of ‘ab’ in solution (i.e. [ab]), except for the final step in the formation of aABb. The local concentration, [L], of the involved pharmacophore will correspond to that of one molecule in half of a sphere with radius ‘r’. To deal with, for example, limited rotational freedom of this pharmacophore, its association is handicapped by a penalty factor, ‘f’ (Valant et al., 2012; Vauquelin and Charlton, 2013). For all present simulations: [L] = 7.1 mM and f = 30. The equations also permit the binding of two heterobivalent ligands to occupy a single target to yield a'ABb' (Vauquelin and Charlton, 2013). This possibility is presently included in the model but it only produces a significant contribution to the total binding of ‘ab’ when [ab] > 10 μM.
Comparing the behaviour of an allosteric or a heterobivalent ligand allows the comparison of the impact of specific parameters on their binding properties and also potentially suggests which of the two mechanisms is more likely in circumstances where there is ambiguity. To this end, differential equations allow the quantification of how much each mode of target occupancy will change over very small time intervals and these are presented in Table 1A. Explicit formulas that govern the binding of a non-competitive ligand ‘a’ under equilibrium conditions in the ATCM (from Christopoulos and Kenakin, 2002) and of ‘ab’ and ‘c’ under equilibrium conditions in the heterobivalent ligand binding model are also presented in Table 1B. For the heterobivalent ligand binding model, therewith-simulated binding data are presented in the Supporting Information section. However, as already addressed elsewhere (Vauquelin and Charlton, 2013) and as also shown in the Supporting Information section, it usually takes an extremely long time for bivalent ligands to even near equilibrium. Therefore, real-life experimental conditions are most likely to yield non-equilibrium conditions and simulations which reflect those conditions are thus relevant for the understanding/interpretation of experimental observations. Compared with the formidable challenge to derive explicit formulas for the evolution of the present heterobivalent/monovalent interaction mechanism with time, a differential equation-based approach (Vauquelin et al., 2001) is tailored for this purpose. By consecutively solving these equations in parallel (Vauquelin et al., 2001) it becomes possible to follow how the prevalence of each of these bound species changes with time, and thus also to mimic non/hemi-equilibrium conditions. Of note is that, at equilibrium, both approaches yield the same outcome: binding values of ‘ab’ and ‘c’ under the conditions shown in Supporting Information Fig. S2 and S4 differ by less than 0.1% of [AB]tot.
Table 1.
(A) Differential equations to follow the time (t)-dependent changes in target occupancy for the different binding modes shown in Figure 1 and (B) explicit formulas
| A: Differential equations | |
|---|---|
| Model | Equation |
| (1) Non-competitive ligands | |
| d[A∼B]/d(t) = k−1 × [aA∼B] + k−2 × [A∼Bb] − k1 × [A∼B] × [a] − k2 × [A∼B] × [b] | 1 |
| d[aA∼B]/d(t) = k1 × [A∼B] × [a] + (k-2/α) × [aA∼Bb] − k−1 × [aA∼B] − k2 × [aA∼B] × [b] | 2 |
| d[A∼Bb]/d(t) = k2 × [A∼B] × [b] + (k−1/α) × [aA∼Bb] − k−2 × [A∼Bb] − k1 × [A∼Bb] × [a] | 3 |
| d[aA∼Bb]/d(t) = k1 × [A∼Bb] × [a] + k2 × [aA∼B] × [b] − (k−1/α) × [aA∼Bb] − (k−2/α) × [aA∼Bb] | 4 |
| ‘a bound’ = ([aA∼B] + [aA∼Bb])/ ([A∼B] + [aA∼B] + [aA∼Bb] + [A∼Bb]) | 5 |
| (2) Heterobivalent and monovalent ligands | |
| d[AB]/d(t) = k−1 × [aAB] + k−2 × [ABb] + k-3 × [cAB] − (k1 + k2) × [AB] × [ab] − k3 × [AB] × [c] | 6 |
| d[aAB]/d(t) = k1 × [AB] × [ab] + k−2 × [aABb] + k-2 × [a'ABb'] − k-1 × [aAB] − (k2/f) × [aAB] × [L] − k2 × [aAB] × [ab] | 7 |
| d[ABb]/d(t) = k2 × [AB] × [ab] + k−1 × [aABb] + k−1 × [a'ABb'] + k−3 × [cABb] − k−2 × [ABb] − (k1/f) × [ABb] × [L] − k3 × [ABb] × [c] − k1 × [ABb] × [ab] | 8 |
| d[aABb]/d(t) = (k1/f) × [ABb] × [L] + (k2/f) × [aAB] × [L] − (k−1 + k−2) × [aABb] | 9 |
| d[a'ABb']/d(t) = k1 × [ABb] × [ab] + k2 × [aAB] × [ab] − (k−1 + k−2) × [a'ABb'] | 10 |
| d[cAB]/d(t) = k3 × [AB] × [c] + k−2 × [cABb] − k−3 × [cAB] − k2 × [cAB] × [ab] | 11 |
| d[cABb]/d(t) = k3 × [ABb] × [c] + k2 × [cAB] × [ab] − k−2 × [cABb] − k−3 × [cABb] | 12 |
| ‘ab bound’ = ([aAB] + [aABb] + [ABb] + [cABb] + 2 × [a'ABb'])/([AB] + [aAB] + [aABb] + [ABb] + [cABb] + [cAB] + [a'ABb']) | 13 |
| ‘c bound’ = ([cAB] + [cABb])/([AB] + [aAB] + [aABb] + [ABb] + [cABb] + [cAB] + [a'ABb']) | 14 |
| B: Explicit formulas | |
|---|---|
| (1) Non-competitive ligands* | |
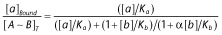 |
15 |
| (2) Heterobivalent and monovalent ligands | |
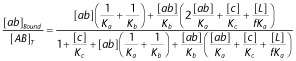 |
16 |
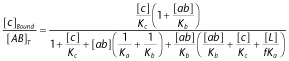 |
17 |
Abbreviations of the molecules/complexes involved are denoted at the right side of the figure. Ligands are assumed to be largely in excess over the targets, so that their concentration in the bulk of the aqueous phase remains constant over time. Equations 1 to 5: ‘α’ is the cooperative factor when the non-competitive ligands ‘a’ and ‘b’ bind to their respective binding sites according to the allosteric ternary complex model (ATCM). ‘a bound’ Includes all the species in where ‘a’ is bound to the target. Equations 6 to 14: ‘f’ Is a penalty factor for binding of the (still free) second pharmacophore when the first one is already bound and [L] is the local concentration of this second pharmacophore near its target site: it corresponds that of one molecule in a volume (=2 × π × r3/3) corresponding to that of half of a sphere with radius ‘r’, the maximal distance between the two pharmacophores of a bivalent ligand. ‘ab bound’ And ‘c bound’ include all the species in where (respectively) ‘ab’ and ‘c’ is bound to the target. Of note is that ‘ab bound’ may exceed the total target concentration because of the double contribution of a'ABb' to the binding of this heterobivalent ligand. (B) Explicit formulas that govern the binding of the non-competitive allosteric ligand ‘a’ under equilibrium conditions in the ATCM (from Christopoulos and Kenakin, 2002) and of ‘ab’ and ‘c’ under equilibrium conditions in the heterobivalent ligand binding model. Equilibrium constants refer to the a-A interaction (i.e. Ka = k1/k−1), the b-B interaction (i.e. Kb = k2/k−2) and the c-C interaction (i.e. Kc = k3/k−3). [A∼B]T and [AB]T refer to the total concentration of the target. Derivation of the formulas and simulated binding data are presented in the Supporting Information section. * for binding of ‘b’, please transpose [a] and Ka by [b] and Kb.
The rate constants mentioned earlier only apply to individual ligand/pharmacophore-target site interactions. The present simulations allow a passage from those parameters to those that can be obtained by analysing the overall/experimental binding of the allosteric, ‘a’, monovalent ‘c’ and heterobivalent, ‘ab’, ligands in question. To highlight this distinction and in agreement with the IUPHAR guidelines (Neubig et al., 2003), the parameters that describe the overall/experimental binding behaviour are categorized as ‘macroscopic’ and those that describe the constituent individual binding events as ‘microscopic’. At the macroscopic level, binding of those ligands refers to the sum of all modes of target occupancy and is expressed as percentage of the total target population, [A∼B]tot or [AB]tot (Equations 5, 13 and 14 in Table 1A). Of note is that a'ABb' contributes twice to ‘ab bound’ as two labelled heterobivalent ligand molecules are bound to a single target; ‘ab bound’ may thus exceed [AB]tot. The macroscopic association and dissociation rate constants of ‘ab’ are denoted as kon (in M−1·min−1) and koff (in min−1) respectively. Finally, while KD refers to the genuine macroscopic equilibrium dissociation constant of ‘ab’ (as defined by koff/kon), KDapp refers to the concentration at which such ligand produces half-maximal target occupancy after a given incubation period (here 60 min). KDapp will exceed KD when equilibrium is not yet reached.
Results and discussion
The general ATCM (Model A in Figure 1) describes the non-competitive interplay between the binding of two ligands to their corresponding sites on the same target molecule or molecular complex. As already documented elsewhere (Hedlund et al., 1999; Christopoulos and Kenakin, 2002), the saturation binding curve of one of those ligands, say ‘a’, will undergo a rightward shift in the presence of a single concentration of ‘b’ in case of negative cooperativity. This shift will increase on par with [b] until a limit is attained. Based on the differential equations that specify the ATCM, the present simulations illustrate this peculiar conduct for α = 0.1 (Figure 2A). Relevant binding parameters of these simulated curves are presented in Table 2. When transposing this conduct in terms of a ‘competition’ binding experiment, it is found that ‘b’ is able to decrease the binding of ‘a’ concentration-wise with nH = 1 but, contrary to competitive monovalent interactions, some binding of ‘a’ may remain even at very high concentrations of ‘b’ (Christopoulos and Kenakin, 2002). The simulations shown in Figure 2B illustrate this particular behaviour and also show that the amount of this residual binding depends on [a]. While the binding of ‘a’ is nearly completely displaceable at low [a] (i.e. when only a small fraction of the target sites are initially occupied), less and less binding becomes displaceable when [a] increases. Concomitantly, the IC50 of ‘b’ also increases. At the highest concentration of ‘a’ examined (300 nM), nearly all of the sites are initially occupied and ‘b’ produces no more than a 25% decrease thereof.
Figure 2.

Allosteric ternary complex model (ATCM; i.e., Model A in Figure 1): effect of negative cooperativity between ligands ‘a’ and ‘b’ (α = 0.1) on simulated saturation and ‘competition’ binding experiments. ‘a bound’ refers to all modes of target occupancy by ‘a’ as defined by equation 5 in Table 1A. Rate constants for ‘a’ and ‘b’: association k1 = k2 = 1 × 10⁷ M−1·min−1, dissociation k−1 = 0.1 min−1 and k-2 = 0.3 min−1. Co-incubation of the target with ‘a’ and ‘b’ lasts for 60 min; [a] and [b] remain steady throughout the incubation. Panel A: Saturation binding by ‘a’. Curves represent ‘a bound’ for increasing [a] (abscissa) either alone (contr) or in the presence of fixed [b] (listed in the panel). Simulated data (symbols) are analysed by GraphPad Prism 4.0 (GraphPad Software Inc., San Diego, CA, USA) according to a variable-slope saturation paradigm. The most informative binding parameters are listed in Table 2. Panel B: ‘Competition’ binding curves represent ‘a bound’ for a fixed [a] (values listed at the right side of each curve) in the presence of increasing [b] (abscissa). Simulated data (symbols) are analysed according to a one-site competition paradigm. Panels C and D: Prevalence of the indicated bound species as a function of [b] in the presence of a fixed, low value of [a] (10 nM, Panel C) or higher value of [a] (300 nM, Panel D). Denominations of bound species are given in Model 1 in Figure 1.
Table 2.
Saturation binding parameters of labelled ligands in medium alone (KDapp and nH on the left) or in the presence of unlabelled ligand (KDapp and nH on the right) at a concentration that causes the largest shift in the saturation curves
| Figure | Labelled ligand | KDapp in M | nH | Unlabelled ligand (concentration in M) | KDapp in M | nH |
|---|---|---|---|---|---|---|
| 2A | a | 1.0 × 10⁻⁸ | 1.00 | b (1 × 10⁻⁵) | 1.0 × 10⁻⁷ | 1.00 |
| 3A | abI | 6.3 × 10⁻⁹ | 1.32 | c (1 × 10⁻⁴) | 5.5 × 10⁻⁸ | 1.00 |
| 3B | abII | 6.2 × 10⁻⁹ | 1.34 | c (1 × 10⁻²) | 9.7 × 10⁻⁶ | 1.01 |
| 4A | c | 1.0 × 10⁻⁷ | 1.00 | abI | Only transient halt in shift | – |
| 4B | c | 1.0 × 10⁻⁷ | 1.00 | abII | Only brief decline in shift | − |
Binding parameters were obtained by analysing the relevant simulated data (symbols) in Figures 4 by GraphPad Prism 4.0 (GraphPad Software Inc.) according to a variable-slope saturation paradigm.
Closer examination of the nature of the bound species (Figure 2C and D) reveals that [aA∼B] (i.e. binding of ‘a’ alone) decreases when [b] increases until it completely vanishes. Conversely, [A∼Bb] (i.e. binding of ‘b’ alone) and [aA∼Bb] (i.e. binding of ‘a’ and ‘b’ together) increases concomitantly until a plateau is attained. By contributing to the binding of ‘a’, aA∼Bb may be held responsible for the only partial character of the ‘competition’ curves shown in Figure 2B and, as expected, the plateau value of [aA∼Bb] augments when [a] increases. The simulated data in Figure 2 are based on the paradigm that α only affects the dissociation rate of both ligands. Additional simulations in where only the association rate is affected yield the same outcome (data not shown).
The model we used to describe the binding of the heterobivalent ligand, ‘ab’, (Model 2 in Figure 1; Vauquelin and Charlton, 2013) is adapted from the one that was initially proposed by Kaufman and Jain (1992) and Plückthun and Pack (1997). In this model, the two pharmacophores of the heterobivalent ligand, ‘a’ and ‘b’, are able to bind simultaneously to their target sites ‘A’ and ‘B’ and ‘c’ only bind to ‘A’. Moreover, the a-A and c-A binding events are strictly competitive in nature and both leave the b-B interaction undisturbed and vice versa. To get a better insight into the factors that promote partial competitivity, we will compare the interplay between two such heterobivalent ligands and ‘c’. For the first ligand, ‘abI’, the b-B interaction takes place with the highest microscopic association rate constant, k2 = 2 × 10⁶ M−1·min−1 and the lowest microscopic dissociation rate constant, k−2 = 0.1 min−1, and consequently with higher potency than for the a-A interaction (i.e. k1 = 1 × 10⁵ M−1·min−1, k−1 = 1 min−1). The binding characteristics of both pharmacophores are reversed for the second ligand, ‘abII’; that is, the a-A interaction now takes place with the highest affinity.
In simulations with ‘abI’ or ‘abII’ as the radioligand, binding does comprise all species where ‘a’ and/or ‘b’ participates, such as defined by equation 13 in Table 1A. To present a realistic picture from the experimental point of view, the simulations shown in Figures 3 and 4 depict the situation after 60 min incubation. As shown in Figure 3A and B, the saturation curves of ‘abI’ and ‘abII’ without ‘c’ are steep (i.e. nH = 1.32) under this condition. As shown in the Supporting Information section, these curves will undergo a gradual leftward shift with time. After about 10 h incubation, this shift levels off and the nH value is now close to unity, indicating that equilibrium is nearly reached. This observation endorses recent presumptions that hemi-equilibrium situations may be quite common in saturation binding experiments with bivalent ligands, unless unrealistically long incubations are implemented (Vauquelin, 2013; Vauquelin and Charlton, 2013). The explicit formula that governs the binding of ‘ab’ at equilibrium (equation 16 in Table 1B) allows the elaboration of a saturation binding curve and, hence, the calculation of the macroscopic KD of such category of ligands (Table 3). Alternatively, their macroscopic KD can also be estimated based on their macroscopic kon and koff values. Those can easily be obtained by analysing simulated association and dissociation binding curves (Table 3, data not shown). The simulations shown in Figure 3A reveal that the saturation binding curve of ‘abI’ undergoes a rightward shift in the presence of ‘c’. Such curves also become gradually sigmoidal (i.e. with nH progressing to unity) when ‘c’ increases, a situation that does not arise when binding is at equilibrium (see Supporting Information section). Similar to the aforementioned negative cooperativity situation (Figure 2A), this shift stalls when [c] increases beyond a certain limit (here ∼ 1 × 10⁻⁵ M). Relevant binding parameters of the simulated saturation curves are provided in Table 2. Figure 3C presents these data in terms of a ‘competition’ binding paradigm. Here again, ‘c’ is able to decrease the binding of ‘abI’ concentration-dependently; this decrease is only partial and becomes less and less pronounced when [abI] increases.
Figure 3.

Heterobivalent ligand and competing monovalent ligand binding model (Model B in Figure 1): effect of ‘c’ on binding of ‘ab’ in simulated saturation and ‘competition’ binding experiments. ‘ab bound’ refers to all modes of target occupancy by ‘ab’ as defined by equation 13 in Table 1A. ‘a’ and ‘c’ bind to ‘A’ in a competitive fashion and both binding events leave the b-B interaction undisturbed and vice versa. Co-incubation of the target with ‘ab’ and ‘c’ lasts for 60 min; [ab] and [c] remain steady throughout the incubation. Rate constants for ‘c’: k3 = 1 × 10⁷ M−1·min−1, k−3 = 1 min−1. Other parameters: r = 48 nm, [L] = 7.1 mM and f = 30. Panel A: Saturation binding by ‘abI’ whose b-B interaction is more potent than the a-A interaction (i.e. k1 = 1 × 10⁵ M−1·min−1, k−1 = 1 min−1, k2 = 2 × 10⁶ M−1·min−1, k−2 = 0.1 min−1). Curves represent ‘ab bound’ for increasing [ab] (abscissa) either alone (contr) or in the presence of fixed [c] (listed at the right side of panel B). Simulated data (symbols) are analysed according to a variable-slope saturation paradigm. The most informative binding parameters are listed in Table 2. Panel B: Saturation binding by ‘abII’ whose a-A interaction is more potent than the b-B interaction. The microscopic binding parameters of ‘a’ and ‘b’ in ‘abI’ have been permuted for ‘abII’ (i.e. k1 = 2 × 10⁶ M−1·min−1, k−1 = 0.1 min−1, k2 = 1 × 10⁵ M−1·min−1, k−2 = 1 min−1). Same presentation and analysis as in Panel A. Panel C: ‘Competition’ binding curves represent ‘abI bound’ for a fixed [abI] in the presence of increasing [c] (abscissa). Simulated data (symbols) are analysed according to an unconstrained variable-slope competition paradigm. Panel D: Similar ‘competition’ binding curves for ‘abII’. Values of [abI] and [abII] are listed at the right side of panel D.
Figure 4.

Effect of ‘abI’ (panels A and C) and ‘abII’ (panels B and D) on the binding of ‘c’ in simulated saturation (panels A and B) and ‘competition’ binding (panels C and D) experiments. ‘c bound’ Refers to all modes of target occupancy by ‘c’ as defined by equation 14 in Table 1A. Simulated saturation data (symbols) are analysed as in Figure 3 and simulated competition data (symbols) are analysed according to a two-site competition paradigm. Saturation binding: values of [abI] and [abII] are listed at the right side of panel B. Binding parameters for ‘c’ in the absence of a heterobivalent ligand are listed in Table 2. ‘Competition’ binding: values of [abI] and [abII] are listed at the right side of panel D. Binding parameters of the ‘high affinity’ component are listed in Table 5.
Table 3.
Macroscopic binding parameters for ‘abI’ and ‘abII’ were obtained by analysing simulated association and dissociation data (not shown) and by calculating kon and koff by the simplified equations that govern the prevailing lanes that link free AB to the tightly bound aABb species
| Macroscopic parameter | ‘abI’ | ‘abII’ |
|---|---|---|
| (A) From simulations based on differential equations (listed in Table 1A) | ||
| koff (in min−1) | 4.3 × 10⁻³ | 4.3 × 10⁻³ |
| kobs (in min−1) | 2.5 × 10⁻² | 2.5 × 10⁻² |
| [ab] for association experiment (in M) | 1.0 × 10⁻⁸ | 1.0 × 10⁻⁸ |
| kon = (kobs − koff)/[ab] (in M−1·min−1) | 2.1 × 10⁻⁶ | 2.1 × 10⁻⁶ |
| KD = koff/kon (in M) | 2.0 × 10⁻⁹ | 2.0 × 10⁻⁹ |
| (B) From simulations based on equation 16 in Table 1B | ||
| KD (in M) | 2.1 × 10⁻⁹ | 2.1 × 10⁻⁹ |
| (C) From the ‘induced fit’ model | ||
| koff (in min−1) | 4.2 × 10−3 = k−1 × k−2 × f/([L] ×k1) | 4.2 × 10−3 = k−1 × k−2 × f/([L] × k2) |
| kon (in M−1·min−1) | 2.1 × 10−6 = k2 | 2.1 × 10−6 = k1 |
| KD = koff/kon (in M) | 2.0 × 10⁻⁹ | 2.0 × 10⁻⁹ |
(A) Simulated dissociation experiment: the target is incubated for 60 min with ‘ab’ ([ab] = KDapp). [ab] Is then set to 0 and the incubation (usually denoted as wash-out) is then continued to simulate the time-wise decrease in ‘ab bound’. Values are recorded every 6 min until 60 min. The data were analysed by GraphPad Prism 4.0 (GraphPad Software Inc.) according to a one-phase exponential dissociation paradigm to yield the dissociation rate constant, koff. Simulated association experiment: the target was incubated with 10−8 M ‘ab’ and ‘ab bound’ was recorded every 6 min until 60 min. The saturation data were analysed according to a one-phase exponential association paradigm to yield the pseudo first-order association rate constants, kobs. (B) KD values were obtained by analysing simulated saturation binding data by GraphPad Prism 4.0 according to a variable-slope sigmoidal dose-response model. (C) The prevailing lanes are highlighted in Figure 5A for ‘abI’ and in Figure 6A for ‘abII’. They almost fully account for the macroscopic rate constants for ‘ab’ binding when k1 and k2 differ 10-fold or more (Vauquelin, 2013), such as is presently the case. These rate constants can be calculated by equations that are mathematically similar to those that apply to the ‘induced fit’ model (Tummino and Copeland, 2008; Copeland, 2011).
Compared with the only modest maximal shift of the saturation curve of ‘abI’ and the rather low concentration of ‘c’ at which this maximum is attained, a quite different picture is observed for ‘abII’ (Figure 3B). While the control curves (i.e. in the absence of ‘c’) of ‘abI’ and ‘abII’ overlap, the shift by ‘c’ stays sustained over a much larger concentration interval; it only starts to stall when [c] reaches ∼ 1 × 10⁻³ M. Consequently, the maximal shift itself is appreciably larger as well. A distinction between ‘abI’ and ‘abII’ is also clearly evident in the ‘competition’ binding representation. While the partial competitive effect of ‘c’ is already clearly discernible at a medium initial level of target occupancy by ‘abI’ (e.g. 65% in Figure 3B), no less than 99.8% target occupancy is needed to observe a comparable effect with ‘abII’ (Figure 3D). Also, the competition curve only starts to reach its nadir when [c] is appreciably higher with ‘abII’ than with ‘abI’ (i.e. at about 1 × 10⁻³ M versus 1 × 10⁻⁵ M; Figure 3B and D).
The heterobivalent ligand binding model stipulates that ‘c’ competes with ‘a’ for binding to A, but leaves the b-B interaction undisturbed and vice versa. This should allow ‘c’ to shift the saturation binding curves of ‘abI’ and ‘abII’ by decreasing to contribution of ‘a’ to their avidity until it completely vanishes. At this end-point, the KDapp of the heterobivalent ligand should equal the KD (i.e. k-2/k2) of the b-B interaction. In agreement with this, the highest recorded KDapp values for the curves shown in Figure 3A and B (i.e. 5.0 × 10⁻⁸ M for ‘abI’ and 8.9 × 10⁻⁶ M for ‘abII’) approach this theoretical upper limit (i.e. 5.0 × 10⁻⁸ M for ‘abI’ and 1.0 × 10⁻⁵ M for ‘abII’). Taken together, partial competitivity of ‘c’ will be most discernible when the a-A interaction only provides a modest contribution to the avidity of ‘ab’. Of note is that the different binding profiles of ‘abI’ and ‘abII’ are somewhat reminiscent of allosteric ligands with, respectively, low and high degrees of negative cooperativity (Christopoulos and Kenakin, 2002).
We next examined the effect of unlabelled ‘abI’ and ‘abII’ on the binding of ‘c’, both in saturation (Figure 4A and B, respectively) and competition binding (Figure 4C and D, respectively) conditions. Similar to the situation with labelled ‘abI’ (Figure 3A and C), increasing [abI] will produce a rightward shift of the saturation binding curves of labelled ‘c’. Yet, rather than reaching a genuine limit, the shift will temporarily stall when [abI] is within the 1 × 10⁻⁷ to 1 × 10⁻⁴ M range and then increase again (Figure 4A). As a result, ‘abI’ will also decrease the binding of ‘c’ in a concentration-dependent fashion until a temporary plateau is attained, after which the binding of ‘c’ decreases again (Figure 4C). Of note is that the present plateau/inflection is only clearly perceptible within a limited concentration range of ‘c’. Similar to the situation with labelled ‘abII’ (Figure 3B and D), increasing [abII] will produce a rightward shift of the saturation binding curves of labelled ‘c’ (Figure 4B). In comparison with the effect of ‘abI’, this shift also remains unabated until much higher levels of [abII] but, rather than observing a distinct stall, the shift will only temporarily decline when [abII] is within the 1 × 10⁻⁵ to 1 × 10⁻⁴ M range. Likewise, ‘abII’ will also decrease the binding of ‘c’ in a concentration-dependent fashion but an inflection is only barely perceptible and only takes place when [c] is in 1000-fold excess over its KD. (Figure 4D).
While the present ligand binding model stipulates that, at a very high concentration of ‘c’, the KDapp of the heterobivalent ligand cannot exceed the microscopic KD of the b-B interaction (see earlier text), this limit does not apply when the binding of ‘c’ is measured instead. Indeed, in contrast to the lack of c-b interplay, the binding of ‘c’ will always be competed away by ‘ab’ provided that its concentration is high enough. The influence of ‘abI’ and ‘abII’ on the binding of ‘c’ only differs from the quantitative point of view. To get a better insight into this issue, we performed additional simulations to compare the concentration of each bound species (within square brackets and expressed as % of [AB]tot further on) after 60 min incubation for 49 combinations of [ab] and [c], ranging from 1 nM to 1 mM each. The simulated data are shown in Figures 5B for ‘abI’ and Figures 6B for ‘abII’. Both have in common that [aAB] and [ABb] never reach significant levels (<4% of [AB]tot) and that, in the absence of ‘c’, [aABb] represents the vast majority of the binding for [ab] up to 1 × 10⁻⁵ M. At higher concentrations, [a'ABb'] will contribute significantly and eventually predominantly (at the expense of [aABb]). When ‘c’ is included in the medium, the contribution of [cAB] and [cABb] will also become significant and even predominant and, as expected, [cAB] will gradually give way to [cABb] when [ab] increases.
Figure 5.
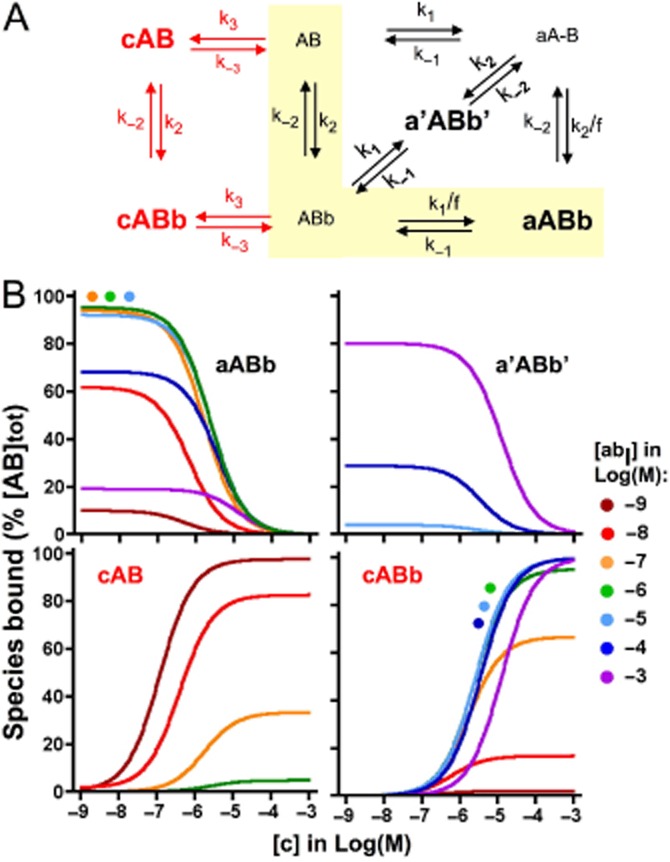
Effect of ‘c’ on individual bound species of ‘abI’. Panel A: Thermodynamic cycle model for ‘abI’ and ‘c’ binding. Prevailing species of ‘abI’- and/or ‘c'- bound AB after 60 min incubation are highlighted in bold. a'ABb' can be ignored when [abI] < < [L]/f (presently when [ab] ≤ 10 μM). The thermodynamic cycle model for ‘abI’ binding can be split into two lanes/pathways that link free AB to the tightly bound aABb species (Vauquelin, 2013). The lane that is chiefly solicited (highlighted by the yellow background) is engaged by the binding of the pharmacophore with the highest association rate constant (and therefore allows the fastest bidirectional ‘transit’). Panel B: Prevailing species of ‘abI’- and/or ‘c'-bound AB (shown in separate panels) after 60 min incubation as a function of [c] (abscissa) and [abI] (listed at the right side of the panels). Data points (not shown for the sake of clarity) are simulated for [c] = −9, −8 … Log(M) and curves were obtained by analysing them according to a variable-slope saturation/competition paradigm. Curves that overlap are also highlighted by filled circles with the appropriate colour code.
Figure 6.
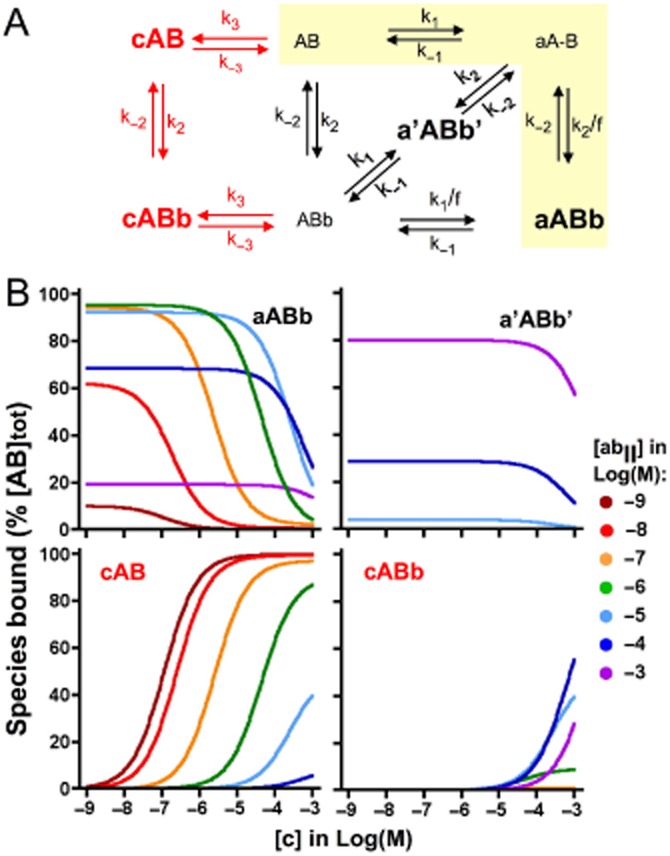
Effect of ‘c’ on individual bound species of ‘abII’. Panel A: Thermodynamic cycle model for ‘abII’ and ‘c’ binding. The model is presented as in Figure 5A. Panel B: Prevailing species of ‘abII’- and/or ‘c'-bound AB (shown in separate panels) after 60 min incubation as a function of [c] (abscissa) and [abII] (listed at the right side of the panels). Simulated data are presented and analysed as in Figure 5B.
Interestingly, a half-maximal decline of [aABb] and [a'ABb'] and increase of [cAB] and [cABb] takes place at closely the same [c] (differences may show up at low [c] but, as further shown in the Supporting Information section, this is related to hemi-equilibrium conditions). This concentration (further denoted at C50) corresponds to half-maximal binding of labelled ‘c’ in saturation binding studies. The C50 versus [ab] plots of ‘abI’, ‘abII’ and related bivalent ligands shown in Figure 7 shed light on a common pattern. C50 will initially increase in step with [ab], attain a plateau when [ab] nears the microscopic KD of the b-B interaction (i.e. k-2/k2) and increase sharply again when [ab] exceeds [L]/f. This latter observation already suggests that the plateau/inflection of labelled ‘c’ in saturation and competition experiments is ruled by the competition between ‘c’ and ‘a’ for binding to AB as long as [ab] remains below [L]/f. In agreement with this, the theoretical C50 value (Table 4) that is associated with this plateau/inflection (i.e. (k−3/k3) × (1 + ([L] × k1)/(f × k−1)) closely corresponds to the observed value for each of the bivalent ligands investigated. These simple rules link the stalled shift of the saturation curves of ‘c’ over an extended range of [abI] (Figure 4A) to the large difference between the k−2/k2 and [L]/f ratios (Figure 7 and Table 4). On the other hand, the modest difference between those ratios (because of a high k−2/k2 value) explains why this shift only briefly decelerates upon increasing [abII] and also that this phenomenon only takes place at high [abII] (Figure 4B). Finally, additional simulations reveal that variants of ‘abI’ with a 10-fold higher or lower f also modulate the saturation curves of ‘c’ as expected. Their concentration at which the shift starts to stall is the same as for ‘abI’ (as it is governed by the b-B interaction only), the C50 of the temporarily halted shift complies with the theoretical C50 value given in Table 4 and the concentration of the ‘abI’ variants at which the shift starts again is within the same range as [L]/f.
Figure 7.
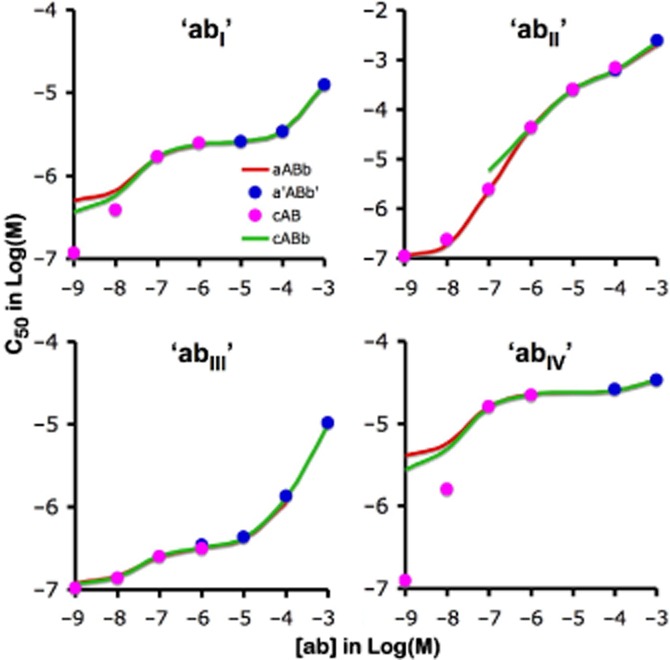
C50 versus [ab] plots for different heterobivalent ligands. Simulated data after 60 min incubation such as those presented in Figure 5B (for ‘abI’) and 6B (for ‘abII’) were analysed according to a variable-slope saturation/competition paradigm and C50 corresponds to the concentration of ‘c’ at which [aABb], [a'ABb'], [cAB] or [cABb] is half-maximal. C50 values of the different bound species are plotted as a function of the concentration of ‘ab’ (abscissa) and each panel refers to a different heterobivalent ligand. Besides ‘abI’ and ‘abII’, two additional ligands with the same microscopic rate constants as ‘abI’ but with a 10-fold higher or lower value of f (i.e. f = 300 for ‘abIII’ and f = 3 for ‘abIV’) are included as well. As shown for ‘abIV’ in the Supporting Information section, diverging C50 values merely result from hemi-equilibrium conditions at low [ab]. Parameters that govern the temporary halt/decrease of the progression of C50 upon increasing [ab] are listed in Table 4. This progression corresponds to the rightward shift of saturation curves of labelled ‘c’ such as in Figure 4C (for ‘abI’) and D (for ‘abII’). For the sake of clarity, C50 values are shown individually when bound species are only prominent within a limited range of [ab]; otherwise only curves are depicted.
Table 4.
Parameters that govern the temporary halt/decrease in the rightward shift of saturation curves of labelled ‘c’ in the presence of increasing [ab] (shown in Figure 4A for ‘abI’ and Figure 4B for ‘abII’)
| Bivalent ligand | k−2/k2 (in M) | Plateau C50 (in M) | f | [L]/f (in M) |
|---|---|---|---|---|
| abI | 5.0 × 10⁻⁸ | 2.5 × 10⁻⁶ | 30 | 2.4 × 10⁻⁴ |
| abII | 1.0 × 10⁻⁵ | 4.7 × 10⁻⁴ | 30 | 2.4 × 10⁻⁴ |
| abIII | 5.0 × 10⁻⁸ | 3.4 × 10⁻⁷ | 300 | 2.4 × 10⁻⁵ |
| abIV | 5.0 × 10⁻⁸ | 2.4 × 10⁻⁵ | 3 | 2.4 × 10⁻³ |
C50 is the concentration of labelled ‘c’ at which binding is half-maximal. As shown in Figure 7A to D, C50 will initially increase in step with [ab], attain a plateau/inflection when [ab] nears k−2/k2 (i.e. the microscopic KD of the b-B interaction) and increase sharply again when [ab] exceeds [L]/f. The C50 value for this plateau/inflection is determined by the competition between ‘c’ and ‘a’ for binding to AB and can be calculated by the equation derived from Cheng and Prusoff (1973): that is, (k−3/k3) × (1 + ([L] × k1)/(f × k−1)).
The Cheng and Prusoff (1973) equation is more commonly used to obtain the equilibrium dissociation constant (denoted as Ki) of unlabelled competitors. As ‘c’ only competes with ‘a’ for binding to ‘A’, it is of interest to find out if the Ki values that correspond to the upper/high affinity portion of the competition curves shown in Figure 4C and D equal the microscopic KD of the a-A interaction (i.e. k−1/k1 = 10 μM for ‘abI’ and 50 nM for ‘abII’). As depicted in Table 5, the calculated Ki(app) values are well below this theoretical value. Somewhat counterintuitively, these findings rather suggest that the Ki(app) values provide a coarse estimate of the overall/macroscopic affinity of the heterobivalent ligands for the target.
Table 5.
‘Competition’ binding parameters for ‘abI’ and ‘abII’
| [c] in M | ‘abI’ | ‘abII’ | ||||
|---|---|---|---|---|---|---|
| IC50 in nM | Ki(app) in nM | nH | IC50 in nM | Ki(app) in nM | nH | |
| 3 × 10⁻⁸ | 6.9 | 5.3 | 1.33 | 8.3 | 6.4 | 1.34 |
| 1 × 10⁻⁷ | 7.9 | 3.9 | 1.28 | 12.7 | 6.4 | 1.31 |
| 3 × 10⁻⁷ | 10.2 | 2.5 | 1.18 | 25 | 6.2 | 1.30 |
| 1 × 10⁻⁶ | 15 | 1.4 | 0.99 | 59 | 5.4 | 1.32 |
| 3 × 10⁻⁶ | 29 | 0.9 | 1.01 | 130 | 4.2 | 1.25 |
| 1 × 10⁻⁵ | 290 | 2.9 | 1.17 | |||
| 3 × 10⁻⁵ | 640 | 2.1 | 1.08 | |||
| 1 × 10⁻⁴ | 1700 | 1.7 | 1.01 | |||
The data were obtained by analysing the binding data (symbols) shown in Figure 4C and D by GraphPad Prism 4.0 (GraphPad Software Inc.) according to an unconstrained variable-slope saturation paradigm. Ki(app) of ‘abI’ and ‘abII’ was calculated from the IC50 values according to the Cheng and Prusoff (1973) equation. The parameters are also listed in the Supporting Information section for a situation where the binding approaches equilibrium (for incubation times extending from 10 h to 40 h).
Macroscopic association and dissociation rate constants of heterobivalent ligands can also be calculated more directly by splitting the thermodynamic cycle model into two separate lanes that ‘ab’ can engage to form the doubly linked aABb complex. As outlined in Vauquelin (2013) (and summarized in the Supporting Information section), it is the lane with the highest kon (and consequently also koff) that is chiefly solicited. Those lanes are highlighted for ‘abI’ and ‘abII’ in Figure 6. The corresponding kon and koff values are provided in Table 3 and the macroscopic KD values calculated are identical for ‘abI’ and ‘abII’ and also close to the values that were obtained based on simulated association and dissociation curves (Table 3).
Of note is that the two-domain model (Hoare, 2007) only invoked a single lane to describe the binding of peptide agonists to class B GPCRs. Interestingly, this lane corresponds to the one that is chiefly solicited by ‘abI’. Similarly, drugs that are thought to interact with their receptor according to the ‘Charnière’ principle (Rocha e Silva, 1969; Stewart et al., 1976; Johnson et al., 1993; Clark et al., 1996; Coleman et al., 1996; Christopoulos et al., 1998; Shimizu et al., 2001) also bear close resemblance to ‘abI’ as one of their functional groups is thought to bind tightly/persistently to an exosite ‘home base’ and the other functional group can rapidly engage and disengage its cognate binding site at the receptor. Based on their similarity with ‘abI’, these latter drugs should also be quite susceptible to only partial competition in radioligand binding experiments by ligands that can only bind to this second site and vice versa. Such binding experiments could be especially interesting for the β2 adrenoceptor agonist salmeterol, as partial competitivity for or by classical β2 adrenoceptor ligands could favour the exosite hypothesis over alternatives that are based on different molecular mechanisms (Coleman, 2009; Szczuka et al., 2009; Patel et al., 2011; Slack et al., 2012).
Concluding comments
According to the general ATCM, negative cooperativity among allosteric ligands will generate distinctive ‘competition’ binding curves (Christopoulos, 2002; Christopoulos and Kenakin, 2002). When one of those participants acts as the radioligand, the ‘competition’ curves of the second ligand will be unable to reach baseline levels and the nadir will increase in par with the radioligand concentration (Figure 2). This ‘partial competitive’ behaviour is often considered to represent a key hallmark of allosteric interactions and sufficient to ascribe that mode of action. The present differential equation-based simulations reveal that this peculiar competition binding pattern may also be observed when a monovalent ligand binds to one of the target sites of a labelled heterobivalent ligand, even if no allosteric mechanism/cooperativity is involved (Figure 3). A similar pattern could also be observed with ligands whose binding was explained by a two-domain model (Hoare, 2007) and the Charnière model (Rocha e Silva, 1969), as both are merely special cases of the general thermodynamic cycle model for heterobivalent ligand binding (Vauquelin, 2013).
Strictly speaking, this peculiar binding pattern is not reciprocal (Figure 4). In ‘competition’ experiments, binding of the labelled monovalent ligand will not reach a genuine plateau above baseline, but will temporarily stall and then drop again. Similarly, the rightward shift of its saturation curves will only stop/decline temporarily. Because radioligand concentrations have to be kept low for practical reasons, comparative ‘competition’ binding studies with both labelled ligands are best suited to differentiate between the allosteric and the bivalent ligand binding mechanisms. Yet, to find out whether a plateau above baseline is temporary or not, it is necessary to add the unlabelled heterobivalent ligand at high enough concentrations. Failure to do so or carrying out ‘competition’ binding experiments with the labelled heterobivalent ligand only may yield observations that could be inadvertently interpreted as allosteric binding. Especially for bivalent ligands, steep saturation binding curves may also merely reflect a hemi-equilibrium situation instead of allosteric binding (Vauquelin and Charlton, 2013). However, as shown in the Supporting Information section, prolonging the incubation more likely shifts the curves to the left in the first eventuality. This hemi-equilibrium is related to the very long residence of bivalent ligands at their target. Yet, to measure such residence time, wash-out experiments with labelled bivalent ligands have to be carried out in medium only, as even unlabelled monovalent ligands are likely to enhance their dissociation dramatically (a phenomenon which can also be misinterpreted as an allosteric manifestation) (Vauquelin and Van Liefde, 2012; Weber et al., 2012; Vauquelin and Charlton, 2013).
Taken together, the considerations mentioned earlier illustrate that due care should be exercised when confronted with radioligand binding data that seemingly point at an allosteric mechanism (Vauquelin and Van Liefde, 2012). Yet, such discrimination may become more clear-cut when based on other attributes that are specific for allosteric models, such as the ATCM and the allosteric two-state model of Hall (2013). Even in the case of binding studies, positive cooperativity can only be explained by allosteric models and, based on the concept that different ligands may induce/stabilize uniquely different receptor conformations, such probe-dependence allows specific ligand combinations to enhance each other's affinity and/or residence time (Albizu et al., 2006; Conn et al., 2009). Discrimination might be even easier if the attention is focused on receptor function instead of binding. Although this topic has already been extensively documented elsewhere (e.g. Wang et al., 2009; Canals et al., 2012), it is worth mentioning that allosteric receptor ligands may also increase the intrinsic activity of orthostatic ligands (a phenomenon which is subjected to a ‘ceiling’ and should not affect the temporal pattern of receptor activation by its natural messenger) and even change the nature of the response profile by biasing the coupling between the receptor and its downstream pathways. These phenomena constitute promising avenues in clinical therapy (Wang et al., 2009) and, unless the pharmacophores are able to bring forth allosteric modulation by themselves (Valant et al., 2012; Lane et al., 2013a), they are unlikely to be observed with bivalent ligands. However, the therapeutic/diagnostic promise of bi/multivalent ligands is more based on their high affinity/avidity for the target, slow dissociation of the complexes and potential bifunctionality (Mammen et al., 1998; Schiller, 2010; Núñez et al., 2012; Kroll et al., 2013). This is particularly sought-after when highly selective and long-lasting blockade of the target is deemed to be all important (e.g. Kroll et al., 2013).
Finally, structural information could also be of valuable help for discriminating between allosteric and bi/multivalency-based action mechanisms. Similar to some antibodies, bi/multivalent synthetic ligands may be intentionally synthesized by linking two ligands/pharmacophores together via a long spacer (e.g. Hudson and Kortt, 1999; Mohr et al., 2010; Schiller, 2010; Kroll et al., 2013). Moreover, the recently available X-ray crystal structures of receptors that are bound by one or two ligands of interest and thereon based molecular modelling (e.g. Kruse et al., 2013; Lane et al., 2013b) are likely to provide useful information about the respective binding pockets (and their potential overlap) of distinct ligands and may also be used to find new allosteric ligands by virtual screening of chemical libraries. Based on the present observations and considerations, we believe that any deductions made will greatly benefit from combining diverse strategies such as radioligand binding, functional assays, target crystal structures and molecular modelling.
Acknowledgments
We are very much indebted to the referees for their pertinent and highly instructive comments.
Glossary
- ATCM
allosteric ternary complex model
Author contributions
G. V. contributed to the study design, performed the simulations and interpretations and wrote the manuscript. D. H. contributed to the elaboration of the explicit equations for heterobivalent ligand equilibrium binding and simulations therewith. S. J. C. contributed to the study design, interpretations and wrote the manuscript.
Conflict of interest
None.
Supporting Information
Figure S1 Saturation binding curves of ‘abI’. Panel A: Curves were constructed and analysed as in Figure 3 of the article except that simulations were conducted for up to 20 h incubation. Also shown is the evolution of the apparent KD and the Hill coefficient (nH) of the curves with time (Panels B and C respectively).
Figure S2 Steady-state simulations of ‘ab’ binding using equation A15 with the parameters given in the legend to Figure 3 of the article. Panels A and C, Ka = 10−5 M, Kb = 5 × 10⁻⁸ M, Kc = 10−7 M, [L] = 7.1 × 10⁻³ M, f = 30; Panels B and D, Ka = 5 × 10⁻⁸ M, Kb = 10−5 M, Kc = 10−7 M, [L] = 7.1 × 10⁻³ M, f = 30. Panels A and B illustrate saturation binding isotherms for ‘ab’ in the presence and absence of ‘c’, while panels C and D show the corresponding inhibition curves for ‘c’ at different concentrations of ‘ab’.
Figure S3 Panels A and B: comparison of the apparent macroscopic KD values (with P = −Log) and of the nH values for the saturation binding curves of ‘abI’ and ‘abII’ either in medium only or in the presence of increasing concentrations of ‘c’ (abscissa) after 60 min (Figure 3A and B of the article) and at equilibrium (Figure 2A and B). Panels C and D: saturation binding curves of ‘abI’ and ‘abII’ over wider concentration ranges than presented in the article, either in medium only or in the presence of selected concentrations of ‘c’.
Figure S4 Steady-state simulations of ‘c’ binding using equation A17 with the parameters given in the legend to Figure 4 of the article. Panels A and C, Ka = 10−5 M, Kb = 5 × 10⁻⁸ M, Kc = 10−7 M, [L] = 7.1 × 10⁻³ M, f = 30; Panels B and D, Ka = 5 × 10⁻⁸ M, Kb = 10−5 M, Kc = 10−7 M, [L] = 7.1 × 10⁻³ M, f = 30. Panels A and B illustrate saturation binding isotherms for ‘c’ in the presence and absence of ‘ab’, while panels C and D show the corresponding inhibition curves for ‘ab’ at different concentrations of ‘c’.
Figure S5 C50 versus [abIV] plot at equilibrium. Simulated data for different ‘abIV’-‘c’ combinations similar to those presented in Figure 5B but for 10 to 20 h incubation are analysed according to a variable-slope saturation/competition paradigm. C50 values (corresponding to the concentration of ‘c’ at which [aABb], [a'ABb'], [cAB] or [cABb] is half-maximal) are plotted as a function of [abIV]. Data are presented as in Figure 7 of the article.
Table S1 Ki values of abI’ and ‘abII’. ‘abI’ and ‘abII’ ‘competition’ versus binding curves versus labelled ‘c’ are simulated such as for Figure 4C and D of the article but for 10 to 20 h incubation. The high affinity portion of the curves is then analysed according to a variable-slope saturation/competition paradigm. Ki values for ‘abI’ and ‘abII’ were calculated from the IC50 values according to the Cheng and Prusoff (1973) equation.
References
- Albizu L, Balestre MN, Breton C, Pin JP, Manning M, Mouillac B, et al. Probing the existence of G protein-coupled receptor dimers by positive and negative ligand-dependent cooperative binding. Mol Pharmacol. 2006;70:1783–1791. doi: 10.1124/mol.106.025684. [DOI] [PubMed] [Google Scholar]
- Alexander SPH, Benson HE, Faccenda E, Pawson AJ, Sharman JL, Spedding M, et al. The Concise Guide to PHARMACOLOGY 2013/14: G protein-coupled receptors. Br J Pharmacol. 2013;170:1459–1581. doi: 10.1111/bph.12445. [DOI] [PMC free article] [PubMed] [Google Scholar]
- Canals M, Lane JR, Wen A, Scammells PJ, Sexton PM, Christopoulos A. A Monod-Wyman-Changeux mechanism can explain G protein-coupled receptor (GPCR) allosteric modulation. J Biol Chem. 2012;287:650–659. doi: 10.1074/jbc.M111.314278. [DOI] [PMC free article] [PubMed] [Google Scholar]
- Cheng Y, Prusoff WH. Relationship between the inhibition constant (Ki) and the concentration of inhibitor which causes 50 per cent inhibition (I50) of an enzymatic reaction. Biochem Pharmacol. 1973;22:3099–3108. doi: 10.1016/0006-2952(73)90196-2. [DOI] [PubMed] [Google Scholar]
- Christopoulos A. Allosteric binding sites on cell-surface receptors: novel targets for drug discovery. Nat Rev Drug Discov. 2002;1:198–210. doi: 10.1038/nrd746. [DOI] [PubMed] [Google Scholar]
- Christopoulos A, Kenakin T. G protein-coupled receptor allosterism and complexing. Pharmacol Rev. 2002;54:323–374. doi: 10.1124/pr.54.2.323. [DOI] [PubMed] [Google Scholar]
- Christopoulos A, Pierce TL, Sorman JL, El-Fakahany EE. On the unique binding and activating properties of xanomeline at the M1 muscarinic acetylcholine receptor. Mol Pharmacol. 1998;53:1120–1130. [PubMed] [Google Scholar]
- Clark RB, Allal C, Friedman J, Johnson MB. Stable activation and desensitization of beta 2-adrenergic receptor stimulation of adenylyl cyclase by salmeterol: evidence for quasi-irreversible binding to an exosite. Mol Pharmacol. 1996;49:182–189. [PubMed] [Google Scholar]
- Coleman RA. On the mechanism of the persistent action of salmeterol: what is the current position? Br J Pharmacol. 2009;158:180–182. doi: 10.1111/j.1476-5381.2009.00370.x. [DOI] [PMC free article] [PubMed] [Google Scholar]
- Coleman RA, Johnson M, Nials AT, Vardey CJ. Exosites: their current status, and their relevance to the duration of action of long-acting beta 2-adrenoceptor agonists. Trends Pharmacol Sci. 1996;17:324–330. [PubMed] [Google Scholar]
- Conn PJ, Christopoulos A, Lindsley CW. Allosteric modulators of GPCRs: a novel approach for the treatment of CNS disorders. Nat Rev Drug Discov. 2009;8:41–54. doi: 10.1038/nrd2760. [DOI] [PMC free article] [PubMed] [Google Scholar]
- Coombs D, Goldstein B. Effects of geometry of the immunological synapse on the delivery of effector molecules. Biophys J. 2004;87:2215–2220. doi: 10.1529/biophysj.104.045674. [DOI] [PMC free article] [PubMed] [Google Scholar]
- Copeland RA. Conformational adaptation in drug-target interactions and residence time. Future Med Chem. 2011;3:1491–1501. doi: 10.4155/fmc.11.112. [DOI] [PubMed] [Google Scholar]
- Daum S, Lücke C, Wildeman D, Schiener-Fischrer C. On the benefit of bivalency in peptide ligand/Pin1 interactions. J Mol Biol. 2007;374:147–161. doi: 10.1016/j.jmb.2007.09.019. [DOI] [PubMed] [Google Scholar]
- De Meyts P, Gauguin L, Svendsen AM, Sarhan M, Knudsen L, Nohr J, et al. Structural basis of allosteric ligand-receptor interactions in the insulin-relaxin peptide family: implications for other receptor tyrosine kinases and G-protein-coupled receptors. Ann NY Acad Sci. 2009;1160:45–53. doi: 10.1111/j.1749-6632.2009.03837.x. [DOI] [PubMed] [Google Scholar]
- Fierens FLP, Vanderheyden PML, De Backer J-P, Vauquelin G. Binding of the antagonist [3H]candesartan to angiotensin II AT1 receptor- transfected Chinese hamster ovary cells. Eur J Pharmacol. 1999;367:413–422. doi: 10.1016/s0014-2999(98)00965-0. [DOI] [PubMed] [Google Scholar]
- Goldstein B, Dembo M. Approximating the effects of diffusion on reversible reactions at the cell surface: ligand-receptor kinetics. Biophys J. 1995;68:1222–1230. doi: 10.1016/S0006-3495(95)80298-5. [DOI] [PMC free article] [PubMed] [Google Scholar]
- Hall DA. Application of receptor theory to allosteric modulation of receptors. Prog Mol Biol Transl Sci. 2013;115:217–290. doi: 10.1016/B978-0-12-394587-7.00006-3. [DOI] [PubMed] [Google Scholar]
- Hedlund PB, Carson MJ, Sutcliffe JG, Thomas EA. Allosteric regulation by oleamide of the binding properties of 5-hydroxytryptamine7 receptors. Biochem Pharmacol. 1999;58:1807–1813. doi: 10.1016/s0006-2952(99)00274-9. [DOI] [PubMed] [Google Scholar]
- Hoare SRJ. Allosteric modulators of class B G-protein-coupled receptors. Curr Neuropharmacol. 2007;5:168–179. doi: 10.2174/157015907781695928. [DOI] [PMC free article] [PubMed] [Google Scholar]
- Hudson PJ, Kortt AA. High avidity scFv multimers; diabodies and triabodies. J Immunol Meth. 1999;23:177–189. doi: 10.1016/s0022-1759(99)00157-x. [DOI] [PubMed] [Google Scholar]
- Johnson M, Butchers PR, Coleman RA, Nials AT, Strong P, Sumner MJ, et al. The pharmacology of salmeterol. Life Sci. 1993;52:2131–2143. doi: 10.1016/0024-3205(93)90728-l. [DOI] [PubMed] [Google Scholar]
- Kamal M, Jockers R. Bitopic ligands, all-in-one orthostetic and allosteric. F1000 Biol Rep. 2009;1:77. doi: 10.3410/B1-77. [DOI] [PMC free article] [PubMed] [Google Scholar]
- Kaufman EN, Jain RK. Effect of bivalent interaction upon apparent antibody affinity, Experimental confirmation of a theory using fluorescence photobleaching and implications for antibody binding assays. Cancer Res. 1992;52:4157–4167. [PubMed] [Google Scholar]
- Kostenis E, Mohr K. Composite action of allosteric modulators on ligand binding. Trends Pharmacol Sci. 1996;17:443–444. [Google Scholar]
- Kramer RH, Karpen JW. Spanning biding sites on allosteric proteins with polymer-linked ligand dimers. Nature. 1998;395:710–713. doi: 10.1038/27227. [DOI] [PubMed] [Google Scholar]
- Kroll C, Mansi R, Braun F, Dobitz S, Maecke HR, Wennemers H. Hybrid bombesin analogues: combining an agonist and an antagonist in defined distances for optimized tumor targeting. J Am Chem Soc. 2013;135:16793–16796. doi: 10.1021/ja4087648. [DOI] [PubMed] [Google Scholar]
- Kruse AC, Ring AM, Manglik A, Hu J, Hu K, Eitel K, et al. Activation and allosteric modulation of a muscarinic acetylcholine receptor. Nature. 2013;504:101–106. doi: 10.1038/nature12735. [DOI] [PMC free article] [PubMed] [Google Scholar]
- Lane JR, Sexton PM, Christopoulos A. Bridging the gap: bitopic ligands of G-protein-coupled receptors. Trends Pharmacol Sci. 2013a;34:59–65. doi: 10.1016/j.tips.2012.10.003. [DOI] [PubMed] [Google Scholar]
- Lane JR, Chubukov P, Liu W, Canals M, Cherezov V, Abagyan R, et al. Structure based ligand discovery targeting orthosteric and allosteric pockets of dopamine receptors. Mol Pharmacol. 2013b;84:794–807. doi: 10.1124/mol.113.088054. [DOI] [PMC free article] [PubMed] [Google Scholar]
- Mammen M, Choi W-K, Whitesides GM. Polyvalent interactions in biological systems: implications for design and use of multivalent ligands and inhibitors. Angew Chem Int Ed. 1998;37:2754–2794. doi: 10.1002/(SICI)1521-3773(19981102)37:20<2754::AID-ANIE2754>3.0.CO;2-3. [DOI] [PubMed] [Google Scholar]
- Mohr K, Tränkle C, Kostenis E, Barocelli E, De Amici M, Holzgrabe U. Rational design of dualsteric GPCR ligands: quests and promise. Br J Pharmacol. 2010;159:997–1008. doi: 10.1111/j.1476-5381.2009.00601.x. [DOI] [PMC free article] [PubMed] [Google Scholar]
- Neubig R, Spedding M, Kenakin T, Christopoulos A. International union of pharmacology committee on receptor nomenclature and drug classification. XXXVIII. Update on terms and symbols in quantitative pharmacology. Pharmacol Rev. 2003;55:597–606. doi: 10.1124/pr.55.4.4. [DOI] [PubMed] [Google Scholar]
- Núñez S, Venhorst J, Kruse CG. Target-drug interactions: first principles and their application to drug discovery. Drug Discov Today. 2012;17:10–22. doi: 10.1016/j.drudis.2011.06.013. [DOI] [PubMed] [Google Scholar]
- Patel S, Summerhill S, Stanley M, Perros-Huguet C, Trevethick MA. The reassertion profiles of long acting β2-adrenoceptor agonists in the guinea pig isolated trachea and human recombinant β2-adrenoceptor. Pulm Pharmacol Ther. 2011;24:247–255. doi: 10.1016/j.pupt.2010.11.004. [DOI] [PubMed] [Google Scholar]
- Pawson AJ, Sharman JL, Benson HE, Faccenda E, Alexander SP, et al. NC-IUPHAR. The IUPHAR/BPS Guide to PHARMACOLOGY: an expert-driven knowledgebase of drug targets and their ligands. Nucl Acids Res. 2014;42:D1098–1106. doi: 10.1093/nar/gkt1143. (Database Issue) [DOI] [PMC free article] [PubMed] [Google Scholar]
- Perry DC, Mullis KB, Øie S, Sadée W. Opiate antagonist receptor binding in vivo: evidence for a new receptor binding model. Brain Res. 1980;199:49–61. doi: 10.1016/0006-8993(80)90229-2. [DOI] [PubMed] [Google Scholar]
- Plückthun A, Pack P. New protein engineering approaches to multivalent and bispecific antibody fragments. Immunotechnology. 1997;3:83–105. doi: 10.1016/s1380-2933(97)00067-5. [DOI] [PubMed] [Google Scholar]
- Rocha e Silva M. A thermodynamic approach to problems of drug antagonism I. The ‘Charnière theory. Eur J Pharmacol. 1969;6:294–302. doi: 10.1016/0014-2999(69)90188-5. [DOI] [PubMed] [Google Scholar]
- Sadée W, Perry DC, Rosenbaum JS, Herz A. [3H] -diprenorphine receptor binding in vivo and in vitro. Eur J Pharmacol. 1982;81:431–440. doi: 10.1016/0014-2999(82)90108-x. [DOI] [PubMed] [Google Scholar]
- Schiller PW. Bi- or multifunctional opioid peptide drugs. Life Sci. 2010;86:598–603. doi: 10.1016/j.lfs.2009.02.025. [DOI] [PMC free article] [PubMed] [Google Scholar]
- Shimizu N, Guo J, Gardella TJ. Parathyroid hormone (PTH)-(1–14) and -(1–11) analogs conformationally constrained by alpha- aminoisobutyric acid mediate full agonist responses via the juxtamembrane region of the PTH-1 receptor. J Biol Chem. 2001;276:49003–49012. doi: 10.1074/jbc.M106827200. [DOI] [PubMed] [Google Scholar]
- Slack RJ, Barnett VJ, Morrisson VS, Sturton RG, Emmons AJ, Ford AJ, et al. In vitro pharmacological characterization of vilanterol, a novel long-acting β2-adrenoceptor agonist with 24-hour duration of action. J Pharmacol Exp Ther. 2012;344:218–230. doi: 10.1124/jpet.112.198481. [DOI] [PubMed] [Google Scholar]
- Springael JY, Le Minh PN, Urizar E, Costagliola S, Vassart G, Parmentier M, et al. Allosteric modulation of binding properties between units of chemokine receptor homo- and hetero-oligomers. Mol Pharmacol. 2006;69:1652–1661. doi: 10.1124/mol.105.019414. [DOI] [PubMed] [Google Scholar]
- Steinfeld T, Mammen M, Smith JA, Wilson RD, Jasper JR. A novel multivalent ligand that bridges the allosteric and orthosteric binding sites of the M2 muscarinic receptor. Mol Pharmacol. 2007;72:291–302. doi: 10.1124/mol.106.033746. [DOI] [PubMed] [Google Scholar]
- Stewart JM, Freer RJ, Rezende L, Pena C, Matsueda GR. A pharmacological study of the angiotensin receptor and tachyphylaxis in smooth muscle. Gen Pharmacol. 1976;7:177–183. doi: 10.1016/0306-3623(76)90058-6. [DOI] [PubMed] [Google Scholar]
- Stockton JM, Birdsall NJ, Burgen AS, Hulme EC. Modification of the binding properties of muscarinic receptors by gallamine. Mol Pharmacol. 1983;23:551–557. [PubMed] [Google Scholar]
- Szczuka A, Packeu A, Wennerberg M, Vauquelin G. Molecular mechanism of the persistent bronchodilatory effect of the partial β2-adrenoceptor agonist salmeterol. Br J Pharmacol. 2009;158:183–194. doi: 10.1111/j.1476-5381.2009.00296.x. [DOI] [PMC free article] [PubMed] [Google Scholar]
- Tummino PJ, Copeland RA. Residence time of receptor-ligand complexes and its effect on biological function. Biochemistry. 2008;47:5481–5492. doi: 10.1021/bi8002023. [DOI] [PubMed] [Google Scholar]
- Valant C, Lane JR, Sexton PM, Christopoulos A. The best of two worlds? Bitopic orthostetic/allosteric ligands of G protein-coupled receptors. Annu Rev Pharmacol Toxicol. 2012;52:153–178. doi: 10.1146/annurev-pharmtox-010611-134514. [DOI] [PubMed] [Google Scholar]
- Vauquelin G. Simplified models for heterobivalent ligand binding: when are they applicable and which are the factors that affect their target residence time. Naunyn Schmiedebergs Arch Pharmacol. 2013;386:949–962. doi: 10.1007/s00210-013-0881-0. [DOI] [PubMed] [Google Scholar]
- Vauquelin G, Charlton S. Long-lasting target binding and rebinding as mechanisms to prolong in vivo drug action. Br J Pharmacol. 2010;161:488–508. doi: 10.1111/j.1476-5381.2010.00936.x. [DOI] [PMC free article] [PubMed] [Google Scholar]
- Vauquelin G, Charlton S. Exploring avidity: understanding the potential gains in functional affinity and target residence time of bivalent and heterobivalent ligands. Br J Pharmacol. 2013;168:1771–1785. doi: 10.1111/bph.12106. [DOI] [PMC free article] [PubMed] [Google Scholar]
- Vauquelin G, Van Liefde I. Radioligand dissociation measurements: potential interference of rebinding and allosteric mechanisms and physiological relevance of different model systems. Expert Opin Drug Discov. 2012;7:583–595. doi: 10.1517/17460441.2012.687720. [DOI] [PubMed] [Google Scholar]
- Vauquelin G, Morsing P, Fierens FLP, De Backer J-P, Vanderheyden PML. A two-state receptor model for the interaction between angiotensin II AT1 receptors and their non-peptide antagonists. Biochem Pharmacol. 2001;61:277–284. doi: 10.1016/s0006-2952(00)00546-3. [DOI] [PubMed] [Google Scholar]
- Wang L, Martin B, Brenneman R, Luttrell LM, Maudsley S. Allosteric modulators of G protein-coupled receptors: future therapeutics for complex physiological disorders. J Pharmacol Exp Ther. 2009;331:340–348. doi: 10.1124/jpet.109.156380. [DOI] [PMC free article] [PubMed] [Google Scholar]
- Weber M, Bujotzek A, Haag R. Quantifying the rebinding effect in multivalent chemical ligand-receptor systems. J Chem Phys. 2012;137:054111. doi: 10.1063/1.4739501. [DOI] [PubMed] [Google Scholar]
Associated Data
This section collects any data citations, data availability statements, or supplementary materials included in this article.
Supplementary Materials
Figure S1 Saturation binding curves of ‘abI’. Panel A: Curves were constructed and analysed as in Figure 3 of the article except that simulations were conducted for up to 20 h incubation. Also shown is the evolution of the apparent KD and the Hill coefficient (nH) of the curves with time (Panels B and C respectively).
Figure S2 Steady-state simulations of ‘ab’ binding using equation A15 with the parameters given in the legend to Figure 3 of the article. Panels A and C, Ka = 10−5 M, Kb = 5 × 10⁻⁸ M, Kc = 10−7 M, [L] = 7.1 × 10⁻³ M, f = 30; Panels B and D, Ka = 5 × 10⁻⁸ M, Kb = 10−5 M, Kc = 10−7 M, [L] = 7.1 × 10⁻³ M, f = 30. Panels A and B illustrate saturation binding isotherms for ‘ab’ in the presence and absence of ‘c’, while panels C and D show the corresponding inhibition curves for ‘c’ at different concentrations of ‘ab’.
Figure S3 Panels A and B: comparison of the apparent macroscopic KD values (with P = −Log) and of the nH values for the saturation binding curves of ‘abI’ and ‘abII’ either in medium only or in the presence of increasing concentrations of ‘c’ (abscissa) after 60 min (Figure 3A and B of the article) and at equilibrium (Figure 2A and B). Panels C and D: saturation binding curves of ‘abI’ and ‘abII’ over wider concentration ranges than presented in the article, either in medium only or in the presence of selected concentrations of ‘c’.
Figure S4 Steady-state simulations of ‘c’ binding using equation A17 with the parameters given in the legend to Figure 4 of the article. Panels A and C, Ka = 10−5 M, Kb = 5 × 10⁻⁸ M, Kc = 10−7 M, [L] = 7.1 × 10⁻³ M, f = 30; Panels B and D, Ka = 5 × 10⁻⁸ M, Kb = 10−5 M, Kc = 10−7 M, [L] = 7.1 × 10⁻³ M, f = 30. Panels A and B illustrate saturation binding isotherms for ‘c’ in the presence and absence of ‘ab’, while panels C and D show the corresponding inhibition curves for ‘ab’ at different concentrations of ‘c’.
Figure S5 C50 versus [abIV] plot at equilibrium. Simulated data for different ‘abIV’-‘c’ combinations similar to those presented in Figure 5B but for 10 to 20 h incubation are analysed according to a variable-slope saturation/competition paradigm. C50 values (corresponding to the concentration of ‘c’ at which [aABb], [a'ABb'], [cAB] or [cABb] is half-maximal) are plotted as a function of [abIV]. Data are presented as in Figure 7 of the article.
Table S1 Ki values of abI’ and ‘abII’. ‘abI’ and ‘abII’ ‘competition’ versus binding curves versus labelled ‘c’ are simulated such as for Figure 4C and D of the article but for 10 to 20 h incubation. The high affinity portion of the curves is then analysed according to a variable-slope saturation/competition paradigm. Ki values for ‘abI’ and ‘abII’ were calculated from the IC50 values according to the Cheng and Prusoff (1973) equation.