

Significance
Cyanobacteria are increasingly being considered for use in large-scale outdoor production of fuels and industrial chemicals. Cyanobacteria can anticipate daily changes in light availability using an internal circadian clock and rapidly alter their metabolic processes in response to changes light availability. Understanding how signals from the internal circadian clock and external light availability are integrated to control metabolic shifts will be important for engineering cyanobacteria for production in natural outdoor environments. This study has assessed how “knowing” the correct time of day, via the circadian clock, affects metabolic changes when a cyanobacterium goes through a dark-to-light transition. Our data show that the circadian clock plays an important role in inhibiting activation of the oxidative pentose phosphate pathway in the morning.
Keywords: metabolomics, metabolism, circadian clock, cyanobacteria, diurnal
Abstract
Synechococcus elongatus PCC 7942 is a genetically tractable model cyanobacterium that has been engineered to produce industrially relevant biomolecules and is the best-studied model for a prokaryotic circadian clock. However, the organism is commonly grown in continuous light in the laboratory, and data on metabolic processes under diurnal conditions are lacking. Moreover, the influence of the circadian clock on diurnal metabolism has been investigated only briefly. Here, we demonstrate that the circadian oscillator influences rhythms of metabolism during diurnal growth, even though light–dark cycles can drive metabolic rhythms independently. Moreover, the phenotype associated with loss of the core oscillator protein, KaiC, is distinct from that caused by absence of the circadian output transcriptional regulator, RpaA (regulator of phycobilisome-associated A). Although RpaA activity is important for carbon degradation at night, KaiC is dispensable for those processes. Untargeted metabolomics analysis and glycogen kinetics suggest that functional KaiC is important for metabolite partitioning in the morning. Additionally, output from the oscillator functions to inhibit RpaA activity in the morning, and kaiC-null strains expressing a mutant KaiC phosphomimetic, KaiC-pST, in which the oscillator is locked in the most active output state, phenocopies a ΔrpaA strain. Inhibition of RpaA by the oscillator in the morning suppresses metabolic processes that normally are active at night, and kaiC-null strains show indications of oxidative pentose phosphate pathway activation as well as increased abundance of primary metabolites. Inhibitory clock output may serve to allow secondary metabolite biosynthesis in the morning, and some metabolites resulting from these processes may feed back to reinforce clock timing.
Cyanobacteria comprise a promising engineering platform for the production of fuels and industrial chemicals. These organisms already have been engineered to produce ethanol, isobutyraldehyde, alkanes, and hydrogen (1–4). However, the efficient industrial-scale application of these photosynthetic organisms will require their growth and maintenance in the outdoors where they will be subjected to light–dark (LD) cycles (5). Phototrophic cyanobacteria present a completely different engineering challenge relative to heterotrophic bacteria such as Escherichia coli: their cellular activities respond strongly to the presence and absence of light because their metabolism is centered on photosynthesis (6, 7). Diverse cyanobacteria also possess a true circadian clock that synchronizes with external LD cycles and has been demonstrated to drive both gene expression and metabolic rhythms (8–10). It is important to understand how signals from the external environment and the internal circadian clock are integrated to modulate metabolic processes in environmentally relevant LD cycles to optimize the engineering of these organisms. In this work we attempt to separate the influences of environment and circadian control using the cyanobacterium Synechococcus elongatus PCC7942, because it is both a highly tractable genetic system and the foundational model for the prokaryotic circadian clock.
The circadian clock in S. elongatus is based on a central oscillator formed by the proteins KaiA, KaiB, and KaiC (11). The reversible phosphorylation of KaiC over a 24-h period sets the timing of the clock mechanism. The clock synchronizes to the environment through KaiA and a histidine protein kinase, CikA. Both proteins bind quinone cofactors, likely plastoquinone present in the photosynthetic membrane, that reflect the cellular redox state (12, 13). KaiC activity also is modulated by the cellular ATP/ADP ratio (14), and both the cellular redox state and ATP/ADP ratio are dependent on the availability of external light. Thus, it has been demonstrated that changes in energy metabolism feed back in setting the timing of clock oscillations (15). The output of the clock is relayed to gene expression through the Synechococcus adaptive sensor (SasA)–regulator of phycobilisome-associated A (RpaA) two-component system (16) in which RpaA is a transcription factor that binds more than 170 gene targets. Many of the genes strongly activated by RpaA function in nighttime metabolic processes, including glycogen degradation, glycolysis, and the oxidative pentose phosphate pathway (OPPP) (17).
Under constant-light (LL) growth conditions circadian control in S. elongatus is quite pervasive, with up to 64% of transcripts displaying 24-h clock-dependent oscillations (10). Gene expression has roughly two distinct phases in LL: genes with an expression peak at subjective dusk (class 1) and genes with an expression peak at subjective dawn (class 2) (18). Recent work by Paddock et al. (19) suggests that a single output from the central oscillator is responsible for both out-of-phase rhythms and that the oscillator has maximum output activity in the morning when KaiC-pST becomes the most prevalent phosphorylation state. Furthermore, there is evidence that oscillator activity is inhibitory (20), and rhythms may manifest as different responses to the alleviation and return of this inhibition over a daily period. It also is likely that metabolism is strongly influenced by the clock in constant light, because a statistically high proportion of genes involved in energy metabolism are rhythmic in LL (21). However, no metabolic pathways are specifically enriched in class 1 or class 2 genes with the exception of ribosome biogenesis and photosynthesis, respectively (10).
A few studies have investigated the transcriptome, proteome, and physiological dynamics of particular species of cyanobacteria over a 24-h period under LD growth (6, 22, 23). In general, systems for oxygenic photosynthesis are activated during the day, and systems for respiratory metabolism are activated at night. Additionally, the day and night periods are used by cyanobacteria to segregate incompatible metabolic processes (22). For example, S. elongatus activates light-independent protochlorophilide reduction, which is an oxygen-sensitive process, at night, a time when oxygen is not being produced by photosystem II (24). However, the degree to which the circadian clock and light availability independently affect metabolic events is poorly understood. In S. elongatus, only two studies have investigated the behavior of mutants that lack a functional clock under an LD cycle (21, 25). The available studies investigate these effects only over a light-to-dark transition, so currently there is an incomplete understanding of the circadian influence on cellular events over a full 24-h LD cycle. Finally, although there is a proteomics dataset for S. elongatus that covers a full 24-h LD period, that study tracked only WT cells and does not decouple clock and environmental influences (23).
When cyanobacteria are grown in a 24-h LD cycle, cells perform photosynthesis and store fixed carbon as the branched glucose polymer glycogen during the day. Glycogen subsequently is degraded at night for energy and reducing power via the OPPP (26, 27). Pattanayak et al. (15) recently showed that glycogen in S. elongatus oscillates in LL and that this oscillation depends on a functional clock. Rhythms of glycogen accumulation and degradation also have been observed during LD growth in S. elongatus (28); however, the influence of the clock under LD conditions is not clear. In fact, enzymes in glycogen metabolism are sensitive to the cellular redox state, and LD transitions alone may trigger changes in glycogen content (29). Glycogen is essential for survival in LD: Mutants defective for the glgA (glycogen synthase) or glgC (ADP-glucose pyrophosphorylase) genes, which are required for glycogen synthesis, are not viable under LD growth regimes (30). In turn, the deletion of the OPPP gene zwf (glucose-6-phosphate 1-dehydrogenase) or glycolysis gene gap1 (glyceraldehyde 3-phosphate dehydrogenase), both of which participate in pathways that consume glycogen, results in mutants that are impaired in LD growth (31, 32). Null mutations in the circadian oscillator, including deletions of kaiA, kaiB, or kaiC, do not impair LD growth. However, disruptions in the SasA–RpaA clock output pathway dramatically stifle growth in LD (16, 33), and genes involved in catabolism of carbon, including glgP (glycogen phosphorylase), gap1, and zwf, are all known RpaA targets (17). Thus, although the clock output pathway likely activates important metabolic processes that occur at night, it is not clear if or how the circadian oscillator modulates these processes.
In this study we applied genetic, biochemical, and metabolomic methods to S. elongatus to dissect how the circadian oscillator and activation of the clock output pathway specifically control metabolism under an LD growth regime. We tracked glycogen content in WT S. elongatus and a ΔkaiC mutant over a 72-h time course under both LL and LD conditions. Subsequently, we characterized glycogen kinetics at LD transitions in WT, ΔkaiC, ΔrpaA, and a ΔkaiC::KaiC-pST phosphomimetic mutant (KaiC-ET) to address whether circadian oscillator output exerts a negative or positive control over glycogen levels. Finally, we performed untargeted metabolic profiling of WTcells and ΔkaiC mutants to investigate how oscillator activity affects global metabolite abundance at the transition from darkness into light. We present a hypothesis for clock regulation of diurnal metabolism that combines our data with previous reports on S. elongatus transcript and protein rhythms (17, 21, 23) and that highlights the importance of circadian output for proper metabolite partitioning under LD growth regimes.
Results
The Circadian Clock Segregates Anabolic and Catabolic Carbon Metabolism in LL.
To determine whether carbon metabolic pathways are under circadian control, we mined existing datasets using a bioinformatic approach that breaks larger pathways into anabolic and catabolic components. Using the Kyoto Encyclopedia of Genes and Genomes (KEGG), we determined which reactions of glycolysis, OPPP, and the Calvin cycle act exclusively within the OPPP (catabolic) or the Calvin cycle (anabolic). We subsequently annotated the enzymes that enable these reactions with their circadian class of transcript [class 1 (peaks at dusk) and class 2 (peaks at dawn)] using available microarray data collected from cells grown in LL (10). Our analysis showed that catabolic reactions are catalyzed exclusively by enzymes with class 1 gene-expression profiles, whereas anabolism is catalyzed almost exclusively by enzymes with class 2 gene-expression profiles (Fig. 1 A and B).
Fig. 1.
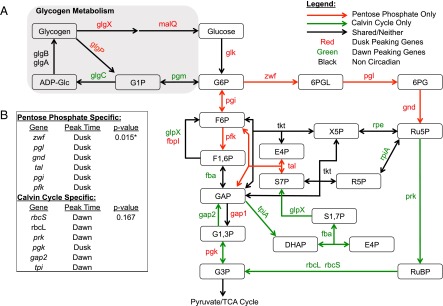
Overview of shared metabolic pathways among glycolysis, the OPPP, and the Calvin cycle, as well as the circadian patterns of genes for their enzymatic steps. (A) A diagram of the metabolic pathway which includes overlapping reactions from glycolysis, the OPPP, and the Calvin cycle and overlays the timing of circadian gene expression onto each pathway. Genes exclusively part of the OPPP generally peak at dusk (red), whereas genes exclusively part of the Calvin cycle generally peak at dawn (green). Additionally, glycogen metabolism (gray box) shows a similar pattern in which anabolic genes peak at dawn and catabolic genes peak at dusk. (B) The table indicates the probability of observing the set of coincident peak times strictly by chance. P values were calculated using Fisher’s exact test. 6PG, 6-phosphogluconate; 6PGL, 6-phosphogluconolactone; ADP-Glc, ADP-glucose; DHAP, dihydroxyacetone phosphate; E4P, erythrose-4-phosphate; F1,6P, fructose-1,6-bisphosphate; F6P, fructose-6-phosphate; G1,3P, 1,3-bisphosphoglycerate; G1P, glucose-1-phosphate; G3P, 3-phosphoglycerate; G6P, glucose-6-phosphate; GAP, glyceraldehyde-3-phosphate; R5P, ribose-5-phosphate; Ru5P, ribulose-5-phosphate; RuBP, ribulose-1,5-bisphosphate; S1,7P, sedoheptulose-1,7-bisphosphate; S7P, sedoheptulose-7-phosphate; X5P, xylose-5-phosphate.
Like the OPPP and the Calvin cycle, glycogen metabolism shows strong temporal segregation in the expression of anabolic and catabolic pathway genes (gray box in Fig. 1A). To gauge circadian influence on cellular flux of carbon, we tracked glycogen content for 72 h in WT and in a clockless ΔkaiC mutant grown in a photobioreactor under constant and stringently controlled turbidity, temperature, and light conditions (Materials and Methods). A recent report from Pattanayak, et al. (15) demonstrated that WT cells show 24-h glycogen oscillations under LL conditions, whereas ΔkaiC mutants lack these oscillations. Our data confirmed a kaiC-dependent 24-h rhythm of glycogen oscillation in LL (period = 24.7 ± 0.13 h) (Fig. 2A). We propose that oscillations in glycogen content under LL conditions result from clock-controlled oscillations of gene expression that segregate pathways for storage and degradation of carbon temporally.
Fig. 2.

Average of normalized glycogen content in WT (blue) and ΔkaiC (red) strains of S. elongatus over a 72-h period under both LL and LD growth conditions. The area of shaded color around the solid lines represents SEM. ZT0 represents subjective dawn after circadian entrainment (Materials and Methods). (A) Glycogen sampling every 4 h from cells grown in LL for 72 h. The WT strain shows a 24-h rhythm of glycogen content, whereas ΔkaiC has arrhythmic fluctuations. Glycogen was normalized for each biological replicate to the maximum value in that replicate’s 72-h period; the solid line is the average of these values. The experiment was performed in triplicate for each strain. (B) Glycogen sampling every 4 h from cells grown in alternating periods of 12 h light and 12 h darkness; darkness is indicated by the gray bars. Both WT and ΔkaiC strains display a 24-h rhythm of glycogen content. Glycogen was normalized for each biological replicate to the maximum value in that replicate’s 24 h period; the solid line is the average of these values. The experiment was performed in duplicate for WT cells and in triplicate for ΔkaiC.
During LD Growth KaiC Has a Repressive Effect on Glycogen Synthesis and Is Not Required for Glycogen Degradation.
The daily oscillations in glycogen abundance that occur when cells are grown in a 24-h LD cycle (28) could be controlled by the circadian oscillator or driven by the environmental cycle. We observed glycogen synthesis and degradation rhythms in both WT cells and a ΔkaiC mutant during growth in a 12:12 LD cycle over a 72-h period (Fig. 2B). Thus, the environment can drive cycles of glycogen accumulation independently of the clock. However, the kinetics of glycogen accumulation were different in the WT and ΔkaiC strains. Kinetic profiling revealed that glycogen accumulation occurs significantly faster in ΔkaiC mutants than in WT cells during the 12-h light period, particularly within the first 6 h of light exposure (Fig. 3). More rapid accumulation resulted in glycogen reaching its peak content 4–5 h earlier in the ΔkaiC mutants than in WT cells. The ΔkaiC mutant had different rates of glycogen accumulation in the first and last 6-h blocks of the light period, whereas accumulation in WT cells was maintained at a steady rate over the full 12-h period (Fig. 3B). Also, ΔkaiC mutants had higher overall glycogen levels than WT cells through the time course (Fig. S1). Thus, the observed rapid accumulation kinetics is not the result of normalization to a smaller starting pool but occurs despite elevated glycogen content in these cells.
Fig. 3.

Summary of glycogen accumulation data over a 12-h light period collected from WT and ΔkaiC cells growing in a 12:12 LD cycle. (A) Normalized glycogen content from WT (blue circles) and ΔkaiC (red circles) cells collected at 1-h intervals after cells were released into the light. Glycogen content for each replicate was normalized to the maximum value in the 12-h period. The data indicate that ΔkaiC accumulates glycogen more rapidly than WT early in the day. Best-fit curves were calculated for WT (blue line) and ΔkaiC (red line) cells using LOESS regression; the gray shaded area indicates the 95% CI for the regression line. Sampling for each strain was conducted in triplicate. (B) Slope calculated using liner regression of normalized glycogen content for the given time intervals. The glycogen accumulation rate for WT does not significantly differ over the time course, whereas ΔkaiC displays significantly different rates of glycogen accumulation in the first and last 6 h of the day period. The ΔkaiC strain also shows significantly more rapid accumulation than WT in the first 6 h. Error bars indicate the 95% CI of the slope estimate. Each slope was calculated from 18 data points.
In contrast, kinetic profiling of glycogen degradation when cultures were transferred to darkness showed little difference between WT and ΔkaiC strains (Fig. 4A and Fig. S2). In all tested cases glycogen degradation could be modeled as a first-order decay process. The decay constant for ΔkaiC was slightly higher than that for WT (λKaiC = 0.318 ± 0.069; λWT = 0.210 ± 0.022). However, the terminal glycogen fraction after a night period was not significantly different for the two strains (G_24hKaiC = 0.186 ± 0.062; G_24WT = 0.125 ± 0.039). Thus, although glycogen degradation occurs slightly faster in the ΔkaiC strain, both strains degrade a similar fraction of their glycogen during the overnight period. These data demonstrate that the circadian oscillator refines the timing of glycogen accumulation so that it occurs at a constant rate through the light period, whereas darkness is sufficient to drive glycogen degradation. The kinetics observed when the clock is disrupted suggests that oscillator output has a negative effect on the rate of glycogen accumulation. This effect is supported further by the increased overall glycogen content observed when the oscillator is not present.
Fig. 4.

Summary of glycogen degradation data and LD growth phenotypes for WT, ΔkaiC, ΔrpaA, and KaiC-ET strains. Samples for all glycogen degradation rate experiments were collected at 0, 0.5-, 1-, 2-, 3-, 4-, 6-, 8-, and 12-h time points after cells entered a dark period during a 12:12 LD diurnal cycle. Glycogen content for each replicate was normalized to the glycogen value at 12 h after lights on. The best fit for each set of data was modeled using first-order decay and is indicated by a solid line; coefficients are given in the text. (A) Normalized glycogen content from WT (blue circles) and ΔkaiC (red circles). First-order decay model for WT (blue line) and ΔkaiC (red line) indicates that glycogen degradation is similar in these strains. The experiment was performed in duplicate for both strains. (B) Normalized glycogen content from WT (blue circles) and ΔrpaA (green circles). The first-order decay model for WT (blue line) and ΔrpaA (green line) indicates that glycogen degradation is severely attenuated in the ΔrpaA strain. The experiment performed in quadruplicate because of the known high variability in the ΔrpaA strain. (C) Normalized glycogen content from WT (blue circles) and KaiC-ET (orange circles). The first-order decay model for WT (blue line) and KaiC- ET (green line) indicates that glycogen degradation is attenuated in the KaiC-ET strain. The experiment was performed in duplicate. (D) Dilution series of strains grown on solid BG-11 medium for 5–7 d in a 12:12 LD cycle. (Top) WT and ΔkaiC have similar growth kinetics under these conditions. However, KaiC-ET (Middle) and ΔrpaA (Bottom) have severely attenuated growth when grown in a diel cycle. Images are representative of multiple experiments.
RpaA Activity Is Important for Glycogen Degradation and Viability in LD and Is Negatively Regulated by Oscillator Output.
Mutations in the SasA–RpaA circadian output pathway result in acute LD sensitivity (16). To determine whether disruptions in the circadian output pathway affect carbon catabolism at night, we tracked glycogen degradation kinetics in a ΔrpaA mutant. Subsequently, we evaluated how the circadian oscillator affects RpaA activity by additionally tracking glycogen degradation kinetics in a ΔkaiC::KaiC-pST phosphomimetic mutant, KaiC-ET. In the KaiC-ET mutant the circadian oscillator is locked in the most active output state, which is most prevalent in the morning of a circadian cycle (19). Thus we can assess how active output from KaiC affects downstream RpaA activity with respect to glycogen metabolism.
The RpaA-null mutant displayed an initial drop in glycogen content but terminated glycogen degradation much earlier than the WT strain (Fig. 4B and Fig. S2). The terminal glycogen fraction determined by our model for ΔrpaA (G_24hRpaA = 0.585 ± 0.071) is significantly higher than that determined for WT (G_24hWT+Kanamycin (km) = 0.222 ± 0.085). However, the decay constant during the time glycogen degradation is active in each strain is not significantly different for the ΔrpaA (λRpaA = 0.607 ± 0.364) and WT (λWT+km = 0.291 ± 0.077) strains. The primary difference between the two strains is that glycogen degradation in ΔrpaA is incomplete, and an unusually large fraction of glycogen remains in these strains at the end of a night period. The KaiC-ET mutant showed a glycogen degradation defect similar to that of ΔrpaA (Fig. 4C and Fig. S2). The decay constant does not differ significantly from WT (λWT+SpSm = 0.165 ± 0.062; λKaiC-ET = 0.294 ± 0.085) (SpSm, spectinomycin/streptomycin); however, the terminal glycogen fraction again was significantly higher in this strain (G_24hWT+SpSm = 0.238 ± 0.154; G_24hKaiC-ET = 0.466 ± 0.062). KaiC-ET mutants also exhibit an LD growth defect similar to, but less severe than, that of ΔrpaA. (Fig. 4D).
The results suggest that KaiC output activity has a negative effect on RpaA activity, because the KaiC-ET phosphomimetic is locked in the most active output state of the clock and phenocopies an RpaA-null strain. This finding agrees with previous reports that overexpression of KaiC has a repressive effect on expression of class 1 genes, which normally are activated by RpaA (17, 20). Finally, this result demonstrates that RpaA has a positive effect on carbon catabolism; moreover, the ability to grow in a diel cycle strongly correlates with the extent to which glycogen is metabolized in the dark.
Metabolomic Profiling During Dark-to-Light Transition Reveals That the Clock Is Important for Proper Metabolite Partitioning in the Morning.
Because disruption of kaiC does not cause major changes in glycogen degradation (Fig. 4A), the difference in glycogen accumulation observed between WT and ΔkaiC strains (Fig. 3A) suggests that a functioning circadian oscillator may be important for metabolite partitioning in the morning. To gain a clearer understanding of early-day metabolic changes in an LD cycle, we performed untargeted metabolic profiling using gas chromatography-time of flight-mass spectrometry (GC-TOF-MS) on both entrained WT and ΔkaiC strains directly before (0 h) and 4 h after a dark-to-light transition. The analysis successfully identified 130 known metabolites across a broad array of metabolic pathways and an additional 195 unknown metabolites that correspond to previously observed mass spectra to which no purified standard compound has been matched (Dataset S1) (34).
Factors contributing to metabolite variability.
Because both sampling time and genotype potentially contribute to differences between samples, we first used partial least squares discriminate analysis (PLS-DA) to determine which factors contribute most of the variability in the dataset (35). Plotting PLS-DA components 1 and 2 showed that the sample replicates are well segregated from each other and that the variability from genotype differences is captured by component 1, whereas the variability from sampling time is captured by component 2 (Fig. 5A). Given the association of time and genotype with the respective components, it is apparent that genotype explains a much larger percentage of dataset variability than response to an environmental signal (41.2 and 14.3%, respectively). Also, samples collected at 0 h are not very different from each other, because there is a slight overlap of the 95% confidence interval (CI) ellipse between these groupings (Fig. 5A).
Fig. 5.

Summary of dimension reduction performed on metabolomics data from WT and ΔkaiC cells grown in a 12:12 LD cycle at the 0-h and 4-h time points after entering light. (A) Plot of PLS-DA components 1 and 2 for all metabolomics samples. Components 1 and 2 account for 55.5% of the variance in the dataset, and, based on these components, all samples show good clustering with biological replicates. The plot indicates that component 1 describes genotype-derived variability, whereas component 2 describes sampling time-derived variability. Ellipses indicate the 95% CI of each grouping of samples on the plot. “W” indicates a WT sample while “K” indicates a ΔkaiC mutant. The letters A, B, and C represent the three biological replicates taken for each sample time point. (B) Loading plot derived from PLS-DA components 1 and 2 indicating the importance of each metabolite to the variability of a given component. Points in red are compounds for which one of the loadings was at least ±0.1. Points in gray are compounds for which no loading was greater than ±0.1. The plot shows that many unknown compounds drive variability in component 1 whereas known and unknown compounds drive variability in component 2.
A loading plot was produced that gives a relative score showing how much an individual compound influences the variability of each component among samples (Fig. 5B). Unknown compounds contribute strongly to genotype-derived variability (component 1), whereas many compounds that contribute to sampling time-derived variability (component 2) are known primary metabolites such as glucose-6-phosphate and branched-chain amino acids. The connection of primary metabolites to time is indicative of the activation of primary metabolism after a dark-to-light transition. Some metabolites also contribute strongly to both components. These metabolites, such as sucrose and tryptophan, are interesting because, although they change after the dark-to-light transition, the nature of their variability is strongly affected by the presence or absence of KaiC. Overall, the status of the circadian oscillator contributes more to the variability than a dark-to-light transition. Strikingly, the compounds that contribute most strongly to genotype-related differences are unknowns. Finally, it is likely that metabolic differences accumulate over the time course, because the most divergent samples are the WT and ΔkaiC mutant strains at 4 h after lights on.
Metabolites significantly altered in dynamics or abundance.
We identified 21 known and 29 unknown compounds that differed significantly in at least one pairwise comparison between sample types (Dataset S1). Based on PLS-DA, we focused on compounds that (i) changed significantly between the 0 h and 4 h time points (Fig. 6A) and (ii) had significantly different abundances in the WT and ΔkaiC strains at the 4-h time point (Fig. 6B). The metabolites that changed significantly over time in both the WT and ΔkaiC strains are primarily known metabolites (Fig. 6A and Table S1). Also, the direction of change over time was similar for many of these compounds in both strains. In contrast the majority of metabolites (11 of 12) that change over time only in the WT strain are unknown species. Some of these metabolites, such as BBID#106943 and BBID#101299, change strongly with time in WT cells but show effectively no change over time in the kaiC mutant (Fig. 6A and Table S1). Only four compounds changed significantly over time uniquely in ΔkaiC. One target, fructose-6-phosphate, is a known intermediate of the OPPP and shows a fourfold increase. Previous work on S. elongatus suggests that flux through this compound is indicative of OPPP activity (36). Additionally, the ΔkaiC mutant showed a 2.5-fold decrease of the unknown BBID#106921. This compound shows opposite metabolic movement between genotypes over the time course.
Fig. 6.

Summary of metabolites that differ significantly in the WT and ΔkaiC strains. (A) Scatter plot of metabolites that show a significant change in abundance from 0 h to 4 h in WT, ΔkaiC, or both strains. A significant change of a compound in a strain is indicated by the dot color. The log2 fold change from 0 h to 4 h after entering light is indicated on the x axis for WT and on y axis for ΔkaiC strains. (B) Plot of all metabolites that differ in abundance between WT and ΔkaiC at the 4-h sampling time point. Metabolite bars in red are significantly elevated and metabolite bars in blue are significantly reduced in ΔkaiC relative to WT. Although many primary metabolites are relatively elevated in ΔkaiC strains, all the metabolites in which ΔkaiC is reduced relative to WT are unknown compounds. Some of the unknowns are >100-fold less abundant in ΔkaiC strains. (C) Pathway diagram detailing the interconnections of the OPPP to glycolysis/glycogen metabolism, the Shikimate pathway, and nucleotide metabolism and indicating compounds that were significantly elevated in ΔkaiC relative to WT at the 4-h time point (red). Many of the elevated metabolites share the OPPP as a precursor hub; the monomers of many elevated sugar polymers were elevated also.
In ΔkaiC a number of primary metabolites were elevated relative to WT by 4 h in the light (Fig. 6B). Most notably, sucrose was elevated more than sixfold. Glucose-6-phosphate, fructose-6-phosphate, and inulotriose, which are connected to glycolysis, the OPPP, and glycogen biosynthesis, were also elevated significantly (Fig. 6 B and C). Tryptophan, a product of the shikimate pathway, which is fed directly by the OPPP, was ∼4.5-fold more abundant in ΔkaiC at 4 h. In contrast, a number of unknown compounds that were very abundant in the WT strain had extremely depressed levels in ΔkaiC mutants. Two of these compounds, BBID#106921 and BBID#1721, were more than 100-fold less abundant in ΔkaiC, but, respectively, they were the third and sixth most abundant compounds detected in WT cells at 4 h (Fig. 6B and Table S2). In ΔkaiC these metabolites are only the 219th and 187th most abundant at 4 h, respectively.
In summary, the inactivation of kaiC appears to have a direct impact on how metabolites are partitioned in the cell after a dark-to-light transition. Both strains increase pool sizes of primary metabolites over the time course; however; ΔkaiC accumulates much larger amounts of primary metabolites, specifically those involved in and directly connected to the OPPP, such as fructose-6-phosphate and sucrose. In contrast, WT cells mobilize carbon into a number of unknown compounds that are present only at low levels in ΔkaiC and make up a significant portion of the overall WT sample.
Correlations in Metabolite Abundance Can Help Classify Unknown Compounds.
To identify shared pathways and suggest the biochemical context for the unknown metabolites that change remarkably in WT, we applied intermetabolite correlation analysis to look for groups of metabolites that share similar patterns of abundance (37). We compared the set of 50 metabolites with significant changes identified by ANOVA, which includes our unknown metabolites of interest (Dataset S1), with all of the known metabolites that were used in the ANOVA analysis (Materials and Methods). Pearson correlations were computed between the abundances of compounds in these two groups, which contained 50 and 111 compounds, respectively (Dataset S2). This analysis yielded 5,550 correlation coefficients from all possible pairwise comparisons. Subsequently, we used hierarchical clustering to group the correlation coefficients into clusters with similarity to each other. For the 50 metabolites with at least one significant change between samples, we could identify three distinct groups that we call “target clusters” (TC), for which the correlations to the 111 known metabolites formed a unique pattern. Similarly, when we looked at all 111 known metabolites we could identify six distinct groups, which we call “metabolite clusters” (MC), for which a group of known metabolites has a unique pattern of correlations across TCs. The correlations are presented as an ordered heat map with TCs on the x axis and MCs on the y axis (Fig. 7, Table S3, and Dataset S2).
Fig. 7.

Heatmap of the correlation between the groupings of metabolites identified by ANOVA to have some significant change (TCs) and a filtered set of all detected known compounds (MCs). More intense red color indicates the abundance patterns between two compounds in all collected samples are more positively correlated; more intense blue color indicates a negatively correlated abundance pattern. TC1 and TC2 have similar patterns of correlations across all known compounds, whereas TC3 displays a unique pattern of correlation. Almost all the unknown compounds that are highly abundant in WT and significantly reduced in ΔkaiC can be found in TC3. Thus, TC3 may give metabolic context to the possible placement of these unknown compounds in metabolism.
We found that 11 of the 14 metabolites identified as more abundant in ΔkaiC at 4 h are clustered in TC2, whereas all seven metabolites significantly depressed in KaiC cells relative to WT cells at 4 h are found in TC3 (Table S3). Although TC1 and TC2 share similar correlation patterns across the six metabolite clusters, this pattern is very different from the pattern of TC3 across the same clusters (Fig. 7). TC1 and TC2 correlate positively with MC3 and MC5 and negatively with MC1 and MC2, whereas TC3 has the opposite pattern, correlating negatively with MC3 and MC5 and positively with MC1 and MC2 (Fig. 7). The compounds that make up MC3 and MC5 are strongly enriched for roles in primary metabolic pathways, such as starch and sucrose metabolism (P = 9.95e-7), the pentose phosphate pathway (P = 2.20e-6), branched chain amino acid biosynthesis (P = 3.26e-3), and purine metabolism (P = 9.99e-4) (Fig. S3). Thus, TC1 and TC2 represent groupings of metabolites that increase together with primary metabolic activity, including sugar phosphates, nucleotides, and amino acids. This pattern is clearly evident in TC1, because this cluster contains many of the primary metabolites that increase in both strains after a dark-to-light transition (Table S3). In contrast, the compounds that make up MC1 and MC2 are enriched for roles in secondary metabolic pathways, such as fatty acid biosynthesis (P = 1.96e-3) and glycerolipid metabolism (P = 5.97e-3) (Fig. S3). MC1 and MC2 also contain a number of benzoate compounds that have been detected previously in cyanobacteria, including benzoic acid and 4-hydroxybenzoate (4HB) (Fig. S4 and Dataset S2) (38). Recent work has shown that plastoquinone biosynthesis in cyanobacteria uses 4HB as an intermediate (39, 40). Indeed, the benzoate compounds in MC1 and MC2 correlate negatively with the aromatic amino acids, which are consumed in plastoquinone biosynthesis (Fig. S4). Thus, it is likely MC1 and MC2 also are enriched in compounds with roles in biosynthesis of plastoquinone or other quinone-like molecules. Overall, our correlation analysis suggests that unknown compounds elevated in ΔkaiC are located primarily in TC2 and likely function in primary metabolic pathways or increase during their activation. In contrast, the unknown compounds elevated in the WT strain, which are exclusively found in TC3, likely function in secondary metabolic roles associated with lipid, glycerolipid, and possibly quinone biosynthesis.
Discussion
Before this work very limited data were available on the diurnal metabolism of S. elongatus, and no study had attempted to decouple the influences of the circadian clock and dark-to-light transitions on metabolism when cells are grown in a diurnal cycle. Our major conclusions from the collected data are that (i) the output from the core oscillator is dispensable for the degradation of carbon at night in a diel cycle; (ii) KaiC output inhibits RpaA, which serves to block activation of nighttime metabolic processes in the morning; and (iii) the importance of the circadian oscillator with respect to metabolism is primarily to modulate the balance between the Calvin cycle and the OPPP under diurnal growth conditions. The data are consistent with a model in which the clock serves to regulate RpaA activity negatively, and hence class 1 gene expression, in the morning. A decrease in inhibitory oscillator output over the day would allow RpaA to activate class 1 genes closer to dusk. This model agrees with data from Paddock et al. (19) suggesting that maximum output activity from the circadian oscillator occurs when KaiC is in the KaiC-pST (KaiC-ET) phospho-state, which is most abundant at dawn. The question remains as to what metabolic processes are driven by RpaA that are important for LD viability. Inactivation of a number of RpaA targets, such as zwf and gnd in the OPPP, also causes an LD sensitivity phenotype. However, it is unclear where carbon flows at night in S. elongatus and why these pathways are so critical for survival under these conditions. Our data suggest that normal KaiC output activity primarily affects metabolic processes that occur in the morning, because the largest differences between the WT and ΔkaiC strains in both glycogen kinetics and global metabolite partitioning are seen at this time.
The ΔkaiC mutant accumulates larger pools of glycogen precursors and primary carbon metabolites early in the day period (Figs. 3A and 6B). However, gene-expression data from LL conditions show that, relative to WT, the ΔkaiC mutant has significantly higher morning expression of transcripts involved in glycogen and carbon catabolism (21). Under diurnal growth conditions it is likely that multiple factors influence the flow of carbon in S. elongatus, including transcription, allosteric regulation of enzymes, and stoichiometric ratios of metabolites. Upon entering a morning period, when glycogen stores are low and photosynthesis is active, glycogen levels may not be strongly influenced by transcript levels from catabolism genes and instead reflect changes in other connected metabolic processes and allosteric regulation of glycogen biosynthetic enzymes. Indeed, GlgC is allosterically activated by the photosynthetic product 3-phosphoglycerate and a reducing cellular environment (29, 41). Alternatively, when cells enter a dark period, glycogen content is high, and GlgC is allosterically inactive. Under these conditions transcriptional activation by RpaA and the availability of degradative transcripts is a primary driving factor in glycogen catabolism. Activation of the OPPP in the morning by RpaA may, in fact, increase the availability of precursors for glycogen biosynthesis during a time when GlgC is strongly activated.
Other transcriptional changes in the ΔkaiC strain also may indirectly affect the regulatory protein CP12 (Calvin cycle protein 12), a master regulator of the Calvin cycle conserved between cyanobacteria and plants (36, 42). Reexamining the transcriptomics data from LL reveals that two of the most highly up-regulated genes in a ΔkaiC mutant are the pyridine nucleotide transhydrogenase subunits A and B (pntA and pntB), which also are known RpaA targets (17, 21). Products of these genes allow the interconversion of NADP(H) to NAD(H), and their overexpression may lower the normally high NADP(H)/NAD(H) ratio present during active photosynthesis. In S. elongatus low NADP(H)/NAD(H) levels activate CP12, causing a shift from the reductive Calvin cycle to the OPPP (36). In S. elongatus inactivation of CP12 resulted in decreased OPPP activity, in which a decrease in cellular fructose-6-phosphate could be detected directly (36). Additionally, in tobacco plants more active CP12 was associated with more starch, soluble sugars (including sucrose), and amino acids (43). The metabolic shifts observed in a ΔkaiC mutant in the morning mirror those seen when CP12 is active, including increased levels of fructose-6-phosphate, sucrose, nucleotides, and amino acids (Fig. 6 B and C). In contrast, the repression of CP12 in tobacco resulted in accumulation of complex insoluble metabolites such as protein and cell wall components (43). In WT S. elongatus we observe increased abundance of unknowns that correlate strongly with compounds involved in fatty acid and glycerolipid biosynthesis; both these biosynthetic pathways would be important for cell wall and membrane biosynthesis in cyanobacteria. Thus, clock control may be important for regulating a shift between Calvin cycle activity and OPPP activity.
These data suggest a model in which KaiC output activity is important for inhibiting RpaA-driven OPPP activity in the morning. Inhibition of OPPP and other primary metabolic pathways frees up carbon so that it can be used in secondary biosynthetic processes. When inhibition of RpaA is relieved, it can activate its targets (including pntA and pntB) so that a lowering of the NADP(H)/NAD(H) ratio and activation of CP12 occurs. The strong correlation in WT samples of elevated unknown compounds with metabolites that participate in plastoquinone biosynthesis suggests that inhibition of primary metabolism by the clock in the morning may be important for this process (Fig. S4). Accumulation of plastoquinone in the morning not only would support photosynthesis through the day period but also would be important for its known role in resetting the circadian clock (44). The influence of the clock on accumulation of these compounds may represent a metabolic feedback loop in which the oscillator output is important for the biosynthesis of compounds that reinforce the correct oscillator timing in LD. In fact, both circadian control over starch metabolism and metabolic feedback to circadian timing have been observed previously in plants (45, 46). Thus, already there is some precedent for the existence of circadian timing reinforcement by metabolism in photosynthetic organisms.
Overall, this study highlights the importance of understanding the interaction of the circadian clock with light-to-dark transitions to gain insights into diurnal physiology and metabolism under day–night cycles. Some aspects of metabolism may be heavily dependent on the circadian clock, whereas others integrate both circadian influences and light availability. The expansion of mass spectral libraries and metabolic networks in photosynthetic organisms will be highly beneficial in determining the response to both internal circadian control and the external environment.
Materials and Methods
Cyanobacterial Strains, Media, and Culture Conditions.
All strains were constructed in the S. elongatus PCC 7942 WT strain archived as AMC06 in our laboratory. Strains were constructed using standard procedures for cyanobacterial transformation (47) and are described in Table S4. All gene disruptions were validated by PCR of native loci. For all experiments precultures were prepared first by transferring 3 mL of stationary-phase culture into 100-mL flasks of fresh BG-11 medium (48) with appropriate antibiotics (5 μg/mL kanamycin or 2 μg/mL combination streptomycin/spectinomycin). Precultures were grown for 3–4 d at 30 °C, 150 rpm shaking (Thermo Fisher MaxQ 2000 Orbital Shaker), and 150 μE⋅m−2⋅s−1 constant light.
For all glycogen tracking and metabolomics experiments, the precultures were used to inoculate Phenometrics ePBR v1.1 photobioreactors (Phenometrics Inc.). Polycarbonate bioreactor vessels were inoculated to a volume of 400 mL, OD750 = 0.1 in medium that contained appropriate antibiotics. For all experiments temperature was maintained at 30 °C, 0.2 μm filtered air was sparged at a rate of 50 mL/min, and light intensity was 150 μE⋅m−2⋅s−1, provided from the top of the culture, whenever lights were on. Controlled airflow was important for reproducibility of glycogen levels. After inoculation, all cultures were allowed to grow in LL until OD750 = 0.3. Cells then were maintained turbidostatically at this density for the duration of the experiments. For all strains, with the exception of the dark-sensitive strains ΔrpaA and KaiC-ET, circadian rhythms were entrained by growth in a 12:12 LD cycle for 3 d before release into experimental conditions and sampling. Dark-sensitive strains were maintained in LL before sampling periods.
For testing LD sensitivity, precultures were diluted initially to OD750 = 0.2, and subsequently were serially diluted five times 1:5 in fresh BG-11 medium. Drops of 4 μL from each dilution were plated on solid BG-11 medium with appropriate antibiotics and 1 mM Na2S2O3. Plates were placed at 30 °C/150 μE⋅m−2⋅s−1 constant light for 24 h and subsequently were transferred to 30 °C/150 μE⋅m−2⋅s−1 in a 12:12 light:dark cycle for 5–7 d.
KEGG Pathway Analysis.
The KEGG pathways syf00030 (pentose phosphate pathway), syf00710 (carbon fixation in photosynthetic organisms), and syf00010 (glycolysis and gluconeogenesis) were cross-referenced for shared and unshared metabolic reactions. Peak circadian expression of genes that control metabolic pathway reactions was determined by data from Vijayan et al. (10). The number of dawn- or dusk-peaking genes unique to each pathway was compared with expected numbers of dawn- or dusk peaking genes in a random sample of genes, and P values were calculated using Fisher’s exact test.
Glycogen Extraction and Analysis.
For glycogen assay, 10 mL of culture (OD750 ∼0.3) was collected and placed on ice. Cells were collected by centrifugation for 10 min at 4,000 × g and 4 °C. The supernatant fraction was discarded, and pellets were frozen at −80 °C. Glycogen was extracted using methods modified from Ernst et al. (49). Specifically, a solution of 50 μL of sterile water and 200 μL of KOH [30% (wt/vol)] was used to resuspend cell pellets, which then were placed at 100 °C for 1.5 h. Glycogen was precipitated from extracts by adding 1 mL of 100% EtOH, and placing extracts on ice for 1 h. Precipitated glycogen was collected by centrifugation. Supernatant was discarded, and extracted glycogen was washed two times with 1 mL of 100% ethanol. Extracts were dried in a Speed-Vac (catalog no. 7810010; Labconco) for 15 min at 60 °C. Extracted glycogen was resuspended in 500 μL of 25 mM sodium acetate buffer (pH = 5) and stored overnight at 4 °C before assay. To quantify glycogen, 200 μL of each sample as well as purified glycogen standards (250, 200, 150, 100, 50, 25, 0 μg/mL) were mixed with 5 μL (5.5 U) of amyloglucosidase (catalog no. 10115; Sigma) and incubated at 37 °C for 1 h. Glucose in the resulting digest was determined by mixing 10 μL of digested glycogen with 190 μL of a solution containing 0.5 U glucose oxidase/0.1U peroxidase (catalog no. G3660; Sigma), 50 μM Amplex Red (catalog no. 10010469; Cayman Chemical), and 25 mM sodium acetate (pH 5). Reactions were incubated for 45 min at 23 °C, and absorbance at 540 nm was determined with a Tecan Infinite M200 plate reader. Unknown glycogen content was determined by comparison with purified standards, and background glucose content was determined by assay of samples untreated with amyloglucosidase.
Glycogen Kinetic Analysis.
Glycogen accumulation was modeled using the LOcal regrESSion (LOESS) algorithm for local fitting with default parameters in the R plotting package ggplot2 (50). Accumulation rates for early and late time points were modeled using the linear modeling function in the base R statistical package (51). Glycogen degradation was modeled as a first-order decay process using the following mathematical expression:
Glycogen values (GT) at the indicated time points (T) were provided to the model. The model was solved for the degradation rate constant (λ) and terminal glycogen content (GT12) using the nonlinear least squares function in the base R statistical package (51). Errors indicated for all modeled coefficients and graphs are presented as values encompassing the 95% CI of the data (52). All graphics were produced using the R plotting package ggplot2 (50).
Metabolomics and Data Analysis.
Strains for metabolomics analysis were grown in photobioreactors as described above. At sampling time points 40 mL of culture was collected over ice in a 50-mL conical tube (n = 3 for all samples). Cells were collected immediately by centrifugation for 10 min at 4,000 × g at −10 °C. Cell pellets were frozen rapidly in liquid nitrogen and placed at −80 °C before analysis. During sampling, the glycogen content of cells was tracked and confirmed to be similar to the accumulation behavior observed in Fig. 3A. Cell pellets were shipped on dry ice to the West Coast Metabolomics Center at the University of California, Davis for subsequent analysis. Metabolite extraction, derivatization, and analysis by GC-TOF-MS have been described in previous publications by Fiehn, et al. (34, 53). Metabolites were identified from MS spectra using the BinBase algorithm (34).
Raw abundance data for all known and unknown metabolites, consisting of unique ion peak heights, were analyzed with MetaboAnalyst (54). Principal component analysis (PCA) was applied to raw data as a quality-control measure to observe sample replicate groupings (Fig. S5). Raw data subsequently were filtered using interquartile range (IQR) to remove metabolites that showed very little variability over all samples. Filtered data were plotted using log2 normalization (Fig. S6). A mixture of univariate and multivariate statistics then was applied to investigate changes between genotypes and through dark-to-light transitions. PLS-DA was applied using default settings and was cross-validated using a maximum of two components (permutation P < 0.01). Differences in mean abundance between metabolites in different samples were assessed with ANOVA, and significance was determined using Tukey’s honestly significant difference with a threshold of P < 0.05. To build the correlation matrix, metabolites identified as statistically significant by ANOVA were compared with all known metabolites present in the IQR-filtered set. Correlation between metabolites was calculated using Pearson’s correlation statistic (r). Metabolite correlations were clustered with hierarchical clustering using Pearson correlation for the distance measure and average linkage for leaf ordering (Multiple Array Viewer v10.2). Cluster groupings were selected by eye, and KEGG pathway enrichment analysis was conducted on clusters using MBRole (55) with a false discovery rate (FDR) of 5% (q < 0.5).
Supplementary Material
Acknowledgments
We thank Ryan Simkovsky and Mark Paddock for helpful discussions that improved the manuscript, and Anish Pal and Emily Effener for assistance in sample collection and strain maintenance. This work was supported by National Science Foundation Grant MCB1244108. S.D. was supported in part by National Institute of Health Cell and Molecular Genetics Training Grant T32GM007240.
Footnotes
The authors declare no conflict of interest.
This article contains supporting information online at www.pnas.org/lookup/suppl/doi:10.1073/pnas.1504576112/-/DCSupplemental.
References
- 1.Deng MD, Coleman JR. Ethanol synthesis by genetic engineering in cyanobacteria. Appl Environ Microbiol. 1999;65(2):523–528. doi: 10.1128/aem.65.2.523-528.1999. [DOI] [PMC free article] [PubMed] [Google Scholar]
- 2.Atsumi S, Higashide W, Liao JC. Direct photosynthetic recycling of carbon dioxide to isobutyraldehyde. Nat Biotechnol. 2009;27(12):1177–1180. doi: 10.1038/nbt.1586. [DOI] [PubMed] [Google Scholar]
- 3.Schirmer A, Rude MA, Li X, Popova E, del Cardayre SB. Microbial biosynthesis of alkanes. Science. 2010;329(5991):559–562. doi: 10.1126/science.1187936. [DOI] [PubMed] [Google Scholar]
- 4.Kruse O, Hankamer B. Microalgal hydrogen production. Curr Opin Biotechnol. 2010;21(3):238–243. doi: 10.1016/j.copbio.2010.03.012. [DOI] [PubMed] [Google Scholar]
- 5.Wijffels RH, Kruse O, Hellingwerf KJ. Potential of industrial biotechnology with cyanobacteria and eukaryotic microalgae. Curr Opin Biotechnol. 2013;24(3):405–413. doi: 10.1016/j.copbio.2013.04.004. [DOI] [PubMed] [Google Scholar]
- 6.Guo J, et al. Proteome-wide light/dark modulation of thiol oxidation in cyanobacteria revealed by quantitative site-specific redox proteomics. Mol Cell Proteomics. 2014;13(12):3270–3285. doi: 10.1074/mcp.M114.041160. [DOI] [PMC free article] [PubMed] [Google Scholar]
- 7.Vermaas WF. Encyclopedia of Life Sciences. Nature Publishing Group; London: 2001. Photosynthesis and respiration in cyanobacteria; pp. 245–251. [Google Scholar]
- 8.Dong G, Kim Y-I, Golden SS. Simplicity and complexity in the cyanobacterial circadian clock mechanism. Curr Opin Genet Dev. 2010;20(6):619–625. doi: 10.1016/j.gde.2010.09.002. [DOI] [PMC free article] [PubMed] [Google Scholar]
- 9.Yang Q, Pando BF, Dong G, Golden SS, van Oudenaarden A. Circadian gating of the cell cycle revealed in single cyanobacterial cells. Science. 2010;327(5972):1522–1526. doi: 10.1126/science.1181759. [DOI] [PMC free article] [PubMed] [Google Scholar]
- 10.Vijayan V, Zuzow R, O’Shea EK. Oscillations in supercoiling drive circadian gene expression in cyanobacteria. Proc Natl Acad Sci USA. 2009;106(52):22564–22568. doi: 10.1073/pnas.0912673106. [DOI] [PMC free article] [PubMed] [Google Scholar]
- 11.Mackey SR, Golden SS, Ditty JL. 2011. The itty-bitty time machine: Genetics of the cyanobacterial circadian clock. Adv Genet 74:13–53. [DOI] [PMC free article] [PubMed]
- 12.Ivleva NB, Gao T, LiWang AC, Golden SS. Quinone sensing by the circadian input kinase of the cyanobacterial circadian clock. Proc Natl Acad Sci USA. 2006;103(46):17468–17473. doi: 10.1073/pnas.0606639103. [DOI] [PMC free article] [PubMed] [Google Scholar]
- 13.Wood TL, et al. The KaiA protein of the cyanobacterial circadian oscillator is modulated by a redox-active cofactor. Proc Natl Acad Sci USA. 2010;107(13):5804–5809. doi: 10.1073/pnas.0910141107. [DOI] [PMC free article] [PubMed] [Google Scholar]
- 14.Rust MJ, Golden SS, O’Shea EK. Light-driven changes in energy metabolism directly entrain the cyanobacterial circadian oscillator. Science. 2011;331(6014):220–223. doi: 10.1126/science.1197243. [DOI] [PMC free article] [PubMed] [Google Scholar]
- 15.Pattanayak GK, Phong C, Rust MJ. Rhythms in energy storage control the ability of the cyanobacterial circadian clock to reset. Curr Biol. 2014;24(16):1934–1938. doi: 10.1016/j.cub.2014.07.022. [DOI] [PMC free article] [PubMed] [Google Scholar]
- 16.Takai N, et al. A KaiC-associating SasA-RpaA two-component regulatory system as a major circadian timing mediator in cyanobacteria. Proc Natl Acad Sci USA. 2006;103(32):12109–12114. doi: 10.1073/pnas.0602955103. [DOI] [PMC free article] [PubMed] [Google Scholar]
- 17.Markson JS, Piechura JR, Puszynska AM, O’Shea EK. Circadian control of global gene expression by the cyanobacterial master regulator RpaA. Cell. 2013;155(6):1396–1408. doi: 10.1016/j.cell.2013.11.005. [DOI] [PMC free article] [PubMed] [Google Scholar]
- 18.Johnson CH, Golden SS. Circadian programs in cyanobacteria: Adaptiveness and mechanism. Annu Rev Microbiol. 1999;53:389–409. doi: 10.1146/annurev.micro.53.1.389. [DOI] [PubMed] [Google Scholar]
- 19.Paddock ML, Boyd JS, Adin DM, Golden SS. Active output state of the Synechococcus Kai circadian oscillator. Proc Natl Acad Sci USA. 2013;110(40):E3849–E3857. doi: 10.1073/pnas.1315170110. [DOI] [PMC free article] [PubMed] [Google Scholar]
- 20.Taniguchi Y, et al. labA: A novel gene required for negative feedback regulation of the cyanobacterial circadian clock protein KaiC. Genes Dev. 2007;21(1):60–70. doi: 10.1101/gad.1488107. [DOI] [PMC free article] [PubMed] [Google Scholar]
- 21.Ito H, et al. Cyanobacterial daily life with Kai-based circadian and diurnal genome-wide transcriptional control in Synechococcus elongatus. Proc Natl Acad Sci USA. 2009;106(33):14168–14173. doi: 10.1073/pnas.0902587106. [DOI] [PMC free article] [PubMed] [Google Scholar]
- 22.Stöckel J, et al. Diurnal rhythms result in significant changes in the cellular protein complement in the cyanobacterium Cyanothece 51142. PLoS ONE. 2011;6(2):e16680. doi: 10.1371/journal.pone.0016680. [DOI] [PMC free article] [PubMed] [Google Scholar]
- 23.Guerreiro ACL, et al. Daily rhythms in the cyanobacterium synechococcus elongatus probed by high-resolution mass spectrometry-based proteomics reveals a small defined set of cyclic proteins. Mol Cell Proteomics. 2014;13(8):2042–2055. doi: 10.1074/mcp.M113.035840. [DOI] [PMC free article] [PubMed] [Google Scholar]
- 24.Reinbothe C, et al. Chlorophyll biosynthesis: Spotlight on protochlorophyllide reduction. Trends Plant Sci. 2010;15(11):614–624. doi: 10.1016/j.tplants.2010.07.002. [DOI] [PubMed] [Google Scholar]
- 25.Hosokawa N, et al. Circadian transcriptional regulation by the posttranslational oscillator without de novo clock gene expression in Synechococcus. Proc Natl Acad Sci USA. 2011;108(37):15396–15401. doi: 10.1073/pnas.1019612108. [DOI] [PMC free article] [PubMed] [Google Scholar]
- 26.Yang C, Hua Q, Shimizu K. Integration of the information from gene expression and metabolic fluxes for the analysis of the regulatory mechanisms in Synechocystis. Appl Microbiol Biotechnol. 2002;58(6):813–822. doi: 10.1007/s00253-002-0949-0. [DOI] [PubMed] [Google Scholar]
- 27.Osanai T, et al. Positive regulation of sugar catabolic pathways in the cyanobacterium Synechocystis sp. PCC 6803 by the group 2 sigma factor sigE. J Biol Chem. 2005;280(35):30653–30659. doi: 10.1074/jbc.M505043200. [DOI] [PubMed] [Google Scholar]
- 28.Suzuki E, et al. Role of the GlgX protein in glycogen metabolism of the cyanobacterium, Synechococcus elongatus PCC 7942. Biochimica et Biophysica Acta. 2007;1770(5):763–773. doi: 10.1016/j.bbagen.2007.01.006. [DOI] [PubMed] [Google Scholar]
- 29.Díaz-Troya S, López-Maury L, Sánchez-Riego AM, Roldán M, Florencio FJ. Redox regulation of glycogen biosynthesis in the cyanobacterium Synechocystis sp. PCC 6803: Analysis of the AGP and glycogen synthases. Mol Plant. 2014;7(1):87–100. doi: 10.1093/mp/sst137. [DOI] [PubMed] [Google Scholar]
- 30.Gründel M, Scheunemann R, Lockau W, Zilliges Y. Impaired glycogen synthesis causes metabolic overflow reactions and affects stress responses in the cyanobacterium Synechocystis sp. PCC 6803. Microbiology. 2012;158(Pt 12):3032–3043. doi: 10.1099/mic.0.062950-0. [DOI] [PubMed] [Google Scholar]
- 31.Scanlan DJ, Sundaram S, Newman J, Mann NH, Carr NG. Characterization of a zwf mutant of Synechococcus sp. strain PCC 7942. J Bacteriol. 1995;177(9):2550–2553. doi: 10.1128/jb.177.9.2550-2553.1995. [DOI] [PMC free article] [PubMed] [Google Scholar]
- 32.Doolittle WF, Singer RA. Mutational analysis of dark endogenous metabolism in the blue-green bacterium Anacystis nidulans. J Bacteriol. 1974;119(3):677–683. doi: 10.1128/jb.119.3.677-683.1974. [DOI] [PMC free article] [PubMed] [Google Scholar]
- 33.Boyd JS, Bordowitz JR, Bree AC, Golden SS. An allele of the crm gene blocks cyanobacterial circadian rhythms. Proc Natl Acad Sci USA. 2013;110(34):13950–13955. doi: 10.1073/pnas.1312793110. [DOI] [PMC free article] [PubMed] [Google Scholar]
- 34.Fiehn O, et al. Plasma metabolomic profiles reflective of glucose homeostasis in non-diabetic and type 2 diabetic obese African-American women. PLoS ONE. 2010;5(12):e15234. doi: 10.1371/journal.pone.0015234. [DOI] [PMC free article] [PubMed] [Google Scholar]
- 35.Maitra S, Yan J. Applying Multivariate Statistical Models. Quebec City, Quebec, Canada: Casualty Actuarial Society; 2008. Principle component analysis and partial least squares: Two dimension reduction techniques for regression. Vol 79. [Google Scholar]
- 36.Tamoi M, Miyazaki T, Fukamizo T, Shigeoka S. The Calvin cycle in cyanobacteria is regulated by CP12 via the NAD(H)/NADP(H) ratio under light/dark conditions. Plant J. 2005;42(4):504–513. doi: 10.1111/j.1365-313X.2005.02391.x. [DOI] [PubMed] [Google Scholar]
- 37.Tikunov Y, et al. A novel approach for nontargeted data analysis for metabolomics. Large-scale profiling of tomato fruit volatiles. Plant Physiol. 2005;139(3):1125–1137. doi: 10.1104/pp.105.068130. [DOI] [PMC free article] [PubMed] [Google Scholar]
- 38.Schwarz D, et al. Metabolic and transcriptomic phenotyping of inorganic carbon acclimation in the Cyanobacterium Synechococcus elongatus PCC 7942. Plant Physiol. 2011;155(4):1640–1655. doi: 10.1104/pp.110.170225. [DOI] [PMC free article] [PubMed] [Google Scholar]
- 39.Pfaff C, Glindemann N, Gruber J, Frentzen M, Sadre R. Chorismate pyruvate-lyase and 4-hydroxy-3-solanesylbenzoate decarboxylase are required for plastoquinone biosynthesis in the cyanobacterium Synechocystis sp. PCC6803. J Biol Chem. 2014;289(5):2675–2686. doi: 10.1074/jbc.M113.511709. [DOI] [PMC free article] [PubMed] [Google Scholar]
- 40.Sadre R, Pfaff C, Buchkremer S. Plastoquinone-9 biosynthesis in cyanobacteria differs from that in plants and involves a novel 4-hydroxybenzoate solanesyltransferase. Biochem J. 2012;442(3):621–629. doi: 10.1042/BJ20111796. [DOI] [PubMed] [Google Scholar]
- 41.Ballicora MA, Iglesias AA, Preiss J. 2003. ADP-glucose pyrophosphorylase, a regulatory enzyme for bacterial glycogen synthesis. Microbiol Mol Biol Rev 67(2):213–225. [DOI] [PMC free article] [PubMed]
- 42.Gontero B, Maberly SC. An intrinsically disordered protein, CP12: Jack of all trades and master of the Calvin cycle. Biochem Soc Trans. 2012;40(5):995–999. doi: 10.1042/BST20120097. [DOI] [PubMed] [Google Scholar]
- 43.Howard TP, et al. Antisense suppression of the small chloroplast protein CP12 in tobacco alters carbon partitioning and severely restricts growth. Plant Physiol. 2011;157(2):620–631. doi: 10.1104/pp.111.183806. [DOI] [PMC free article] [PubMed] [Google Scholar]
- 44.Kim Y-I, Vinyard DJ, Ananyev GM, Dismukes GC, Golden SS. Oxidized quinones signal onset of darkness directly to the cyanobacterial circadian oscillator. Proc Natl Acad Sci USA. 2012;109(44):17765–17769. doi: 10.1073/pnas.1216401109. [DOI] [PMC free article] [PubMed] [Google Scholar]
- 45.Haydon MJ, Mielczarek O, Robertson FC, Hubbard KE, Webb AAR. Photosynthetic entrainment of the Arabidopsis thaliana circadian clock. Nature. 2013;502(7473):689–692. doi: 10.1038/nature12603. [DOI] [PMC free article] [PubMed] [Google Scholar]
- 46.Streb S, Zeeman SC. Starch metabolism in Arabidopsis. The Arabidopsis Book. 2012;10:e0160. doi: 10.1199/tab.0160. [DOI] [PMC free article] [PubMed] [Google Scholar]
- 47.Clerico EM, Ditty JL, Golden SS. Specialized techniques for site-directed mutagenesis in cyanobacteria. Methods Mol Biol. 2007;362:155–171. doi: 10.1007/978-1-59745-257-1_11. [DOI] [PubMed] [Google Scholar]
- 48.Xu Y, Mori T, Johnson CH. Cyanobacterial circadian clockwork: Roles of KaiA, KaiB and the kaiBC promoter in regulating KaiC. EMBO J. 2003;22(9):2117–2126. doi: 10.1093/emboj/cdg168. [DOI] [PMC free article] [PubMed] [Google Scholar]
- 49.Ernst A, Kirschenlohr H, Diez J, Böger P. Glycogen content and nitrogenase activity in Anabaena variabilis. Arch Microbiol. 1984;140(2-3):120–125. [Google Scholar]
- 50. ggplot2: Elegant Graphics for Data Analysis (2009) ggplot2: Elegant Graphics for Data Analysis (Springer Science and Business Media, New York) Available at link.springer.com/book/10.1007%2F978-0-387-98141-3. Accessed December 1, 2014.
- 51.R Core Team 2014. R: A Language and Environment for Statistical Computing: Base package (Vienna)
- 52.R Core Team 2013. R: A Language and Environment for Statistical Computing. 1–3604.
- 53.Fiehn O, et al. Quality control for plant metabolomics: Reporting MSI-compliant studies. Plant J. 2008;53(4):691–704. doi: 10.1111/j.1365-313X.2007.03387.x. [DOI] [PubMed] [Google Scholar]
- 54.Xia J, Wishart DS. 2011. Metabolomic data processing, analysis, and interpretation using MetaboAnalyst. Curr Protoc Bioinformatics Chapter 14:Unit 14.10.
- 55.Chagoyen M, Pazos F. MBRole: Enrichment analysis of metabolomic data. Bioinformatics. 2011;27(5):730–731. doi: 10.1093/bioinformatics/btr001. [DOI] [PubMed] [Google Scholar]
Associated Data
This section collects any data citations, data availability statements, or supplementary materials included in this article.