

Significance
Plant cells are incapable of sliding past each other, so generation of shape and structure in plant tissue is dependent on cells dividing and expanding in particular directions. Therefore, understanding how cells choose where to build new walls is critical in understanding how plant tissue is patterned. In the present study we expand on previous models of cell division to further understand what parameters of cell geometry and growth influence the position of new walls.
Keywords: cell division, computer modeling, live imaging, Arabidopsis
Abstract
The stereotypic pattern of cell shapes in the Arabidopsis shoot apical meristem (SAM) suggests that strict rules govern the placement of new walls during cell division. When a cell in the SAM divides, a new wall is built that connects existing walls and divides the cytoplasm of the daughter cells. Because features that are determined by the placement of new walls such as cell size, shape, and number of neighbors are highly regular, rules must exist for maintaining such order. Here we present a quantitative model of these rules that incorporates different observed features of cell division. Each feature is incorporated into a “potential function” that contributes a single term to a total analog of potential energy. New cell walls are predicted to occur at locations where the potential function is minimized. Quantitative terms that represent the well-known historical rules of plant cell division, such as those given by Hofmeister, Errera, and Sachs are developed and evaluated against observed cell divisions in the epidermal layer (L1) of Arabidopsis thaliana SAM. The method is general enough to allow additional terms for nongeometric properties such as internal concentration gradients and mechanical tensile forces.
The Arabidopsis shoot apical meristem (SAM) is a structure at the tip of the shoot that is responsible for generating almost all of the above-ground tissue of the plant (1). Its epidermal and subepidermal cells are organized into layers with very few cells moving between layers (2, 3). When these cells expand they do so laterally, pushing other cells toward the periphery of the meristem. Division in these cells is anticlinal such that each layer remains one cell thick. The underlying mechanism determining the location of new cell walls is unknown but the qualitative properties of meristematic cell division are well documented (4–8). Perhaps the best known summary is Errera’s rule, derived following observations of soap bubble formation. In the modern interpretation, the plane of division corresponds to the shortest path that will halve the mother cell. Errera, in fact, wrote that the wall would be a surface “mit constanter mittlerer Krümmung (= Minimalfläche) [with constant mean curvature (= minimal area)]” (4). Because this does not specify a location for the new cell wall, more recent authors have added to this that the mother cell divides evenly (9, 10). With this modification, Errera’s rule is easily quantifiable.
A second observation is Hofmeister’s rule: New cell walls usually form in a plane normal to the principal axis of cell elongation (5). This rule is more difficult to quantify, because the principal axis of cell elongation is often confused with the direction of growth. Cells are asymmetrical and hence a principal direction of cell elongation can easily be calculated (e.g., the principal axis of inertia or principal component of a segmentation). The assumption is often made that because the cell is more elongated in one direction that the primary growth of the cell has been along that direction, but this is not necessarily the case, because the elongation may be derived from a prior cell division. For example, if a symmetrical square divides into two rectangular cells, this does not mean that the two daughter cells have grown primarily along their longer axis. Quantification of cell growth direction is much more difficult: It requires the observation of matching points over time and varies with the internal and external tensile forces on the cell. It is not clear whether the instantaneous direction of cell growth or the longer-term average (e.g., as measured over a significant fraction of a cell generation) is more directly relevant to forming the division plane. Under compression, single cells tend to divide in a plane perpendicular to the principal axis of the stress tensor (11), which could indicate a mechanical basis for cell wall placement.
Other observations are that new cell walls form in a plane perpendicular to existing cell walls (6), that cell walls tend to avoid four-way junctions (7), and that cell division planes tend to be staggered, like bricks in a wall (8). Because chemical signals can be induced by physical interactions such as mechanical stress and strain it is conceivable that these geometric indicators are merely emergent properties of the underlying physicochemical interaction processes that drives cell division. Although most of the geometric observations tend to be true most of the time, none of them is true all of the time, and it is not possible for all of them to be true at once. For example, the actual growth direction is rarely in alignment with the principal geometric axis of the cell, and hence the division cannot simultaneously satisfy shortest length and perpendicularity requirements. Such conflicting results can in principle be resolved by minimizing a sum of potential functions (12), and insight can often be gained into the underlying mechanisms by examining the results of the optimization. Additionally, recent work by Besson and Dumais (9) suggests that cell division in plants is inherently random. The new wall tends to find a global minimum length, but in situations where there are multiple similar local minima the global minimum is not necessarily chosen.
Previously we looked at cell divisions in the shoot meristem using 2D maximum intensity projections (13). Some of the results from that work may have been biased owing to the inconsistent perspective on cells in the peripheral zone compared with the center created by projecting a 3D object into 2D space. Because the meristem is dome-shaped, when projecting the meristem from the top the cells in the center are viewed perpendicularly, whereas the cells toward the edges are viewed at an angle. This nonperpendicular viewing angle distorts the lengths of the cell walls and the angles at which the walls join each other. To rectify that problem the geometry of the cells must be examined in 3D. Here we expand on earlier work with more comprehensive 3D image processing techniques to analyze the division patterns in the local tangent plane. By using the image processing software MorphoGraphX (14) we were able to reconstruct the cell boundaries in the first layer of a growing SAM.
Having a 3D model of the structure of the epidermal (L1) layer over time allowed us to generate a model composed of a set of functions, each incorporating a different feature from the observed cell divisions. The functions each contribute a single term to a greater potential function and new walls are predicted to form where the combined potential is reduced. This model also brought to light some of the shortcomings of previously proposed plant cell division rules. Additionally, these data allowed us to make the observations reported below of the dynamics of cell expansion and division in different regions of the SAM.
Results
A total of 207 cell divisions were observed from four Arabidopsis thaliana L-er pUBQ1::2x-tdTomato-29-1 inflorescence SAMs observed from live imaging using laser scanning confocal microscopy. Because the original segmentation was performed in three dimensions the segmentation points for any given cell do not lie precisely in a plane. To perform subsequent analysis, a best fit local Euclidean plane (SI Appendix, Projection to Local Euclidean Plane) was found using the method of least squares, and each point was then projected to the local Euclidean plane by dropping the local perpendicular to the plane. The mean offset was 0.07 0.05 μm (Fig. 1A). The mean area of the cells before division was 40.0 6.2 μm2 (mean SD). The mean area of the daughter cells was 21.0 5.5 μm2. Mean cell perimeter before division was 24.9 2.1 μm and of the daughter cells was 18.2 2.4 μm (Fig. 1B). The distribution of areas was more symmetric for the parent cell than for the daughter cells (skewness of 0.22 vs. 0.71). For comparison a study of four meristems showed all cell areas with mean, SD, skewness. This more closely resembles the skewness in the areas as distributed across the entire SAM (Fig. 1C) in which the average area was 22.6 6.5 μm2.
Fig. 1.

(A) Distribution of mean error (mean of the absolute value of perpendicular distance) in fit to local Euclidean. (B) Distribution of parent cell areas before division (white, dashed) and child cell areas after division (gray, solid). (C) Distribution of areas globally across the SAM L1 layer (excluding floral meristems) (four meristems, 200 ± 26 cells per meristem) and one-sigma errors.
Analysis of Traditional Heuristics of Cell Division.
Many rules about cell division have been reported and widely quoted. Care must be taken in applying these rules because they are all only valid in an approximate sense (as will be shown below) and are often in conflict with one another. Because they are only generally (but not absolutely) valid and are only applicable in the proper context, we refer to them as the heuristics (rather than laws or rules). In addition to the three heuristics that we address below, we also analyzed Hofmeister’s rule, new walls forming perpendicular to existing walls, and growth immediately after division in SI Appendix, More Heuristics.
Heuristic 1: The new wall is a minimal area surface that divides the mother cell equally.
Errera’s rule (1888) states that the cell divides along a surface that minimizes the area of the new wall (4). Errera did not specify the position of the new cell wall (the intersection of the new wall with the cortex). If the wall position is not specified, its minimum area could approach zero in cells of many shapes (conical or spherical, for example). To make a predictive model we add, as do other modern authors (9, 15–17), that the division halves the volume of the mother cell. We thus are not testing Errera’s actual rule; rather, we are testing the heuristic that modern authors call Errera’s rule. For cells in the L1 layer, with uniform depth and anticlinal divisions, we can make a 2D equivalent of this heuristic in which the cell divides along a curve that minimizes the length of the new wall and that halves the mother cell.
The projections of the sibling cells resulting from 207 cell divisions ranged in area from 24% to 76% of the total area, with an SD of 9.3% within the full range (0.0–1.0), as illustrated in Fig. 2A, which shows the ratio ( or 2) where is the projected area of the cell in the tangent plane and and are the areas of the two siblings. The plot is completely symmetric because every cell division produces two siblings with ratios and . In fact 20% of the daughter cells fell within 5% of half the total area (), 35% were within 10% (), and 65% fell within 20% ().
Fig. 2.

(A) Distribution of daughter cells as a fraction of the total area. The total area is defined as the sum of the areas of the two siblings. (B) How well each division matches the modern interpretation of Errera’s rule ranked by percentile and grouped into 10 bins indicated by colors where the 90th percentile represents the worst fits and the 0th percentile represents the best fits.
The divisions that fit this heuristic the worst (bottom 20 percentile) were not evenly distributed throughout the meristem. As can be seen in Fig. 2B, depicting one of the meristems we investigated, many of the divisions most poorly predicted occur in the periphery of the meristem. In fact, 72% of the divisions in the bottom 20 percentile occur within three cells of the edge of the meristem. If these uneven divisions are occurring in regions that eventually become flower primordia, the unevenness of the division might be due to the previously reported phenomenon of a change in the polarity of divisions within founder cells in vegetative meristems (18, 19).
Heuristic 2: The new cell wall passes through the center of the cell.
The shortest distance from the new cell wall to the centroid of the cell was determined by (i) fitting a least-squares quadratic to the new cell wall and (ii) finding the minimum distance between the quadratic and the centroid of the combined pair of cells immediately after cell division. The quadratic fit was used to smooth the segmentation that would otherwise be composed of a joined sequence of line segments (Fig. 3A). To obtain a size-independent (dimensionless) measure, the distance was measured in units of , where P is cell perimeter, which would correspond to an effective radius for a spherical cell (illustrated in Fig. 3B). Some 30, 50, and 88% of the cell walls passed within 0.05, 0.1, and 0.2 effective radii, respectively (Fig. 3C).
Fig. 3.

(A) Definition of shortest distance of new cell wall from centroid, for a typical cell. (B) Illustration of the units for values of r = 0.05, 0.1, 0.2, 0.3, and 0.4 for a circular cell. The dashed circles would correspond to a typical cell nucleus that is just skirted by the tangential curved new cell wall. (C) Closest approach of new cell wall to centroid. (D) Distribution of cell walls by new central angle.
A second measure of how nearly the new cell wall passes through the center of the cell is to measure the angle subtended between vectors from the center to the endpoints of the new wall (Fig. 3D). In this measure, a straight-line wall that passes through the centroid would subtend an angle of 180°. With one exception (at Δθ = 88°) virtually every cell division subtended an angle of more than 100°. As illustrated in Fig. 3D, 130° is exceeded over 90% of the time, 140° is exceeded over 80% of the time, 150° is exceeded two-thirds of the time, and over half the cell division had a central angle exceeding 160°, or within 20° of the maximum 180° to make a straight line.
Heuristic 3: The plane of cell division is the shortest path (soap bubble dynamics).
The modern interpretation of Errera’s rule (translated to the tangent plane of the L1 layer) suggests that a new cell wall should form along the shortest path that divides the cell evenly. This prediction cannot completely dissociate into two independent heuristics of length minimization and area equalization, in that it minimizes wall length subject to the constraint that the wall divides the cell evenly. However, to assess the significance of a wall shortness constraint we compared the actual wall lengths to the minimum (dmin) and maximum (dmax) diameters of each cell with the statistic . A cell diameter is defined as the length of a line segment passing through the centroid from one cell wall to the opposite cell wall. As this line segment is rotated about the centroid its length will change. We call its maximum and minimum values the maximum and minimum diameters. When , the wall has the same length as the minimum diameter; when , the wall has the same length as the maximum diameter (SI Appendix, Fig. S4). A value of indicates that the actual wall length is shorter than the minimum diameter, because the actual wall does not pass directly through the center but is skewed somewhat. The wall length was defined as the length of the quadratic fit to the new wall (so as to eliminate noise from the image segmentation) and the diameters were defined as the lengths of line segments through the centroid that spanned the entire cell. We found that in 49% of the cell divisions the relative wall length fell within 10% () of the minimum diameter and that in 69% of the cell divisions it was within 20% of the minimum diameter. The longest wall had . More notably, in 76% of the cases the actual wall length was shorter than the minimum diameter (SI Appendix, Fig. S1).
Our observations are consistent with the conjecture that both Hofmeister's rule (5) and Sach's observations (6) are statistically emergent properties of cell division. Fig. 4 A–C suggest, via the distribution of isoperimetric ratios after cell division, that cells tend away from the oblong and more toward regularity in shape. This is consistent with the new cell wall having a most probable orientation normal to the cell wall (Fig. 4 D and E). Fig. 5 suggests that whereas the new cell wall also has a most probable orientation normal to the existing cell wall, there is a fairly wide spread of orientations, statistically consistent with Sachs' observation in the mean (SI Appendix, More Heuristics).
Fig. 4.

(A) Distribution of isoperimetric ratio over 12 time points from four different meristems having 200 ± 28 cells in each meristem. (B and C) Distribution of isoperimetric ratios over 207 cell division events for the parents in the last observation before cell division (B) and the first observation after cell division (C). (D) Distribution of angle between new cell wall and normal to principal axis of cell extension. (E) Projection of typical segmentation to local Euclidean. The arrow shows the direction of the new cell wall.
Fig. 5.
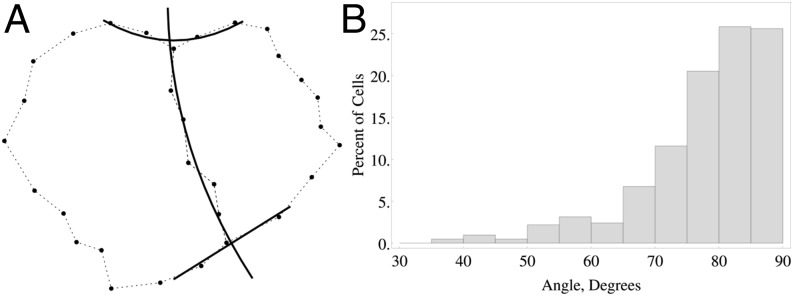
The angle between existing cell wall and new cell wall, degrees. (A) Least-squares quadratics used to calculate angles so as to reduce noise from the segmentation (see dotted line), for a typical cell. (B) Distribution of angle between new wall and existing wall for all cell divisions.
Model.
Four potential functions Vi were defined (SI Appendix, Eqs. S9–S13). For any given weight vector the cell division potential function will describe a landscape in space such that the lowest point of this landscape corresponds to the predicted wall location, with and given the central angles of the two end points of the wall as measured from the cell centroid (SI Appendix, Fig. S4, Left). When plotted as a function of , this landscape is symmetric about the 45° line , and hence only points above (or below) the line need be considered, because the data are duplicated in both parts of the plot. This landscape may be represented by a contour plot, analogous to a topographic map (SI Appendix, Fig. S5). The object of the optimization process is then to find a weight vector that works best in as many cells as possible. Thus, the potential is minimized for each cell and each possible weight vector; for each , the prediction errors are calculated (as a fitness function) for each cell and combined to produce a net fitness for that weight vector.
The cell division potential was minimized and the fitness function calculated for each of the six methods described in SI Appendix. An average value (corresponding to the fitness function averaged over all 207 cell divisions) was assigned to each value of the weight vectors. Because only the direction of the weight vector, and not its actual length, is important in finding the minimum value, the four-component weight vector can be represented by a unit vector in the same direction; for example, the weight vector is completely equivalent to a weight vector . The four-dimensional weights were found by taking 3D slices along two planes: holding parameter three fixed and holding parameter four fixed. With this constraint, each three-component weight vector in a slice can be described by two angles giving the azimuth and elevation in space, where , , and . A global search of weight vector space was then performed at ∼3° increments (620 values) to obtain a coarse description of the fitness. A spatial resolution of 3° was also used. For computational efficiency only cell walls with a minimum central angle of 90° were considered during the optimization (as suggested by Fig. 3). Predictions were made using the predivision observations (“before” data) obtained at the start of a 2-h window during which cell division took place and evaluated in comparison with the observed location of the cell wall as determined from postdivision observations (“after” data) obtained at the end of the same window. For comparison, a second set of predictions were calculated using only the after data (“hindsight” predictions). In the hindsight predictions the outer boundary of the pair of daughter cells was used to represent the predivision cell wall.
Model Predictions.
The minimum fitness results were clustered around a weight vector of , where the four values represent the relative importance of area equalization, length minimization, perpendicularity to cell elongation, and perpendicularity to growth direction (SI Appendix, Fig. S6). Variations in the first component have very little effect, except as , where it becomes rapidly worse for . The fitness decreases gradually as increases from zero. There were no significant differences between the different types of fitness measure. All of our fits in the primary cluster indicate that the third component in w is zero. This indicates that neither geometrical elongation nor instantaneous direction of growth (as measured over a 2-h period) are significant predictors of cell division. A second cluster of minima occurs around (0.02, 0.81, 0.58, 0) in the case where εe = 0 in SI Appendix, Eq. S12 corresponding to cell extension. No significant change was observed in changing the constant εg corresponding to cell growth direction, nor with any change observed when the constant cL in SI Appendix, Eq. S11 was changed.
This result would suggest that when the different predictors are dissociated in this manner that the best predictor is the shortest length wall that passes near the center. This prediction is very similar to the modern interpretation of Errera’s rule, that the wall will form in the shortest path that divides the cell in half. To compare these statements, the predicted wall location according to this rule was computed for all 207 cell divisions. The distribution of fitnesses for a potential function minimization with was slightly better than for the modern interpretation of Errera’s rule (SI Appendix, Fig. S10). Thirteen of the 14 worst cases were the same cells for both methods. Visually there is very little difference between the two methods of prediction. Using a distance fitness measure, the potential method gave a better fit in 68 of the 207 cell division, the modern interpretation of Errera’s method in 40 cases, and both had identical fitnesses in 2 cases. Best and worst fits using the optimal weight vector are shown in Fig. 6. In the hindsight model the numbers were 36 (Errera), 2 (tie), and 72 (potential) (SI Appendix).
Fig. 6.

Comparison of predictions between the length-minimization potential and the Besson–Dumais model. Dotted lines, actual new wall; solid lines, predicted new wall.
Simulation results for both the modern interpretation of Errera’s model and the optimized potential model are illustrated in SI Appendix, Fig. S7 after 1,000 cell divisions had occurred. The tissues were grown in silico from single quadrilateral cells and projected onto a parabolic surface. The resulting cell division patterns in both cases are evocative of observed data.
Discussion
Previous work in this field has shown that rules must exist to control the positioning of new cell walls in the meristem to produce the patterns (size, shape, and connectedness) that are observed (13, 20). Here we determined that the rules are not simple, and in fact the rules seem to be different depending on the location in the meristem. This might be a result of flower founder cells changing their “preferred” division polarity before the rapid growth characteristic of flower primordia. This is similar to the observation in vegetative meristems of pea plants, where leaf founder cells often divide periclinally (parallel to the surface of the meristem) about one-half plastochron before primordial growth, where nonfounder cells would usually divide anticlinally (perpendicular to the surface) (21, 22). This is different from the phenomenon observed in Arabidopsis inflorescence meristems where periclinal divisions are not observed but similar in that the divisions that do not abide by the modern interpretation of Errera’s rule or our potential minimization rule are found preferentially near the edge, possibly in regions of flower founder cells. One explanation for the deviation from the rules near the perimeter of the meristem is that it helps make the elongated cells commonly observed in the boundary region of new primordia (23).
Explanations for these rules get more complicated when we consider the underlying mechanisms controlling plant cell divisions. Before cell division the nucleus moves to the center of the cell during S or G2 phases of mitosis (24) and actin filaments and microtubules expand outward from the nuclear to the cellular membrane, in a pattern that resembles a concentric spoked wheel (25). Following this, the region defined by the ends of the spokes develops the preprophase band of microtubules, which defines the position of the new cell wall. If the shape of the spoked wheel is then perturbed somewhat from circular, and the inner wheel is perturbed somewhat from the center of mass, we have an oblong cell with an off-center nucleus. Presuming that multiple spokes grow outward from the inner wheel, starting at the same time, the first spokes to reach the outer wheel will be the ones that have to travel the shortest distance. Reaching the outer membrane will induce a change in tensile forces, and this could be transmitted as a signal back to the nuclear end of the spoke. In this model a new cell wall would be represented by the first two spokes to reach the outer wall, together with a collection of filaments tangent to the inner circle (e.g., near the nuclear membrane) that connect them. At this point the full preprophase band has not coalesced yet and the filaments of the new proto-wall are free to increase their tension, forming into a more smoothly aligned curve that connects the two endpoints, perhaps tangent to the inner circle or even forming a straight line.
This argument would support a model in which shortest-distance paths that pass close to the cell nucleus dominate (as suggested by a weight vector heavily dominated by the length potential). Because lines that pass through the center of the cell will, on the average, divide the cell in half, a rule stating that a new wall be the shortest path that divides the cell in half will emerge as a consequence. Furthermore, because the shortest distance from a point (e.g., the nucleus) to a line (e.g., the outer cell wall) is along a perpendicular path, Sachs’ (6) observation that new walls are perpendicular to existing walls and daughter cells are equal in volume will also emerge. Finally, because the principal axis of elongation is often the longest axis of the cell, the paths will cluster about the shortest path normal to the principal axis that passes through (or nearly through) the cell center. Thus, Hofmeister’s rule (5) is also emergent.
Nevertheless, the modern interpretation of Errera’s rule is a poor predictor in a number of cases. In many of these cases the actual wall forms closer to the longest wall that divides the cell in half rather than the shortest. This may indicate that additional dynamic forces are involved in these cells that are not accounted for by a minimum-length heuristic. One possibility is that cortical microtubule alignment, which is regulated by stress, is an input to preprophase band location, and the physical stress imposed on a boundary region by a protruding flower primordium thereby influences the plane of cell division. In most of the SAM, where there are no protrusions, such stresses will not exist.
The model of shortest path that passes nearly through the cell center thus eliminates the need for the cellular machinery to somehow “sense” either the cellular orientation (elongation) or direction of growth. That biomechanical forces could affect the growth of the microtubules is nevertheless likely, perhaps changing their growth rate or causing a preferential growth direction. This could possibly explain the cases in which none of the traditional rules is followed. Additionally, even though our model indicates that strain direction does not relate to wall placement, it is possible that the instantaneous strain direction does matter but our imaging period was too long to capture that phenomenon.
It should be noted that this study only considered the first layer of cells in the meristem, which have a uniform thickness and divide only periclinally. More could be learned about the mechanisms of cell division if divisions were observed in tissues that divide in all directions and the images were processed in 4D (3D z-stacks over time) using the methods of Fernandez et al., for example (25). Additional studies should also look at how cell division planes are affected by mechanical perturbations of the tissue before division. Such additional studies could help determine universal predictors of cell division plane placement.
Methods
Plants.
Seeds from the pUBQ::tdTomato-29-1 line in the L-er background were sterilized with 70% (vol/vol) ethanol and added to agar plates containing MS and sucrose (30 g/L). After a 3-d vernalization at 4 °C, seeds were germinated under constant light at room temperature. Ten days after germination, plants were transferred to boxes containing solid growth medium and grown under constant light at room temperature. Plastic boxes 4 cm high were prepared under sterile conditions, filled 1 cm high with a growth media consisting of MS, MS vitamins, and agar. One thin layer of agar without MS was poured on top of the solid MS agar.
Time-Series Images.
Laser scanning confocal images of four different Arabidopsis meristems were taken at 2-h intervals during which 207 cell divisions were observed. To image the meristems, the boxes containing the plants were filled with sterile water and placed under the microscope objective. A 63 × 0.95 N.A. Achroplan objective was used for imaging. Z-stacks containing 20 optical sections were acquired using a Zeiss LSM 510 with 543-nm laser, 543-nm dichroic mirror, 560-nm long-pass filter, 2-µs scan time per pixel, and a resolution of 0.25 µm (X) by 0.25 µm (Y) by 1.0 µm (Z), creating images of 512 × 512 pixels.
Static Images.
For comparison geometric statistics were also measured on a collection of 12 additional images of four different meristems at different time points (∼200 cells per image) used in Fig. 4A. Arabidopsis seeds of the L-er background were germinated on soil under constant light at room temperature. When the shoots bolted, flowers and flower primordia were dissected from the inflorescence. The meristems were cut from the shoot 1cm below the top and inserted into dishes of solid agar. The meristems were stained with 10 µM FM4-64 (Invitrogen) at 4 °C for 15 min. The meristems were then washed with distilled water to remove the excess stain and the dishes were filled with distilled water. The same microscope parameters from the time-series imaging were used here.
Image Processing.
Z-stacks in LSM format were first converted into a TIF series using ImageJ (26) and the LSMToolbox plugin. These series of TIF images were then imported into MorphoGraphX. The cell boundaries of the L1 were extracted and segmented using the general methods described by Kierzkowski et al. (14). For the Python code see SI Appendix, Image Segmentation.
Supplementary Material
Acknowledgments
This work was supported by grants from the Beckman Institute at California Institute of Technology, the Division of Biology, and the Provost’s Office at California Institute of Technology; a gift from Peter Cross; and Department of Energy Office of Basic Energy Sciences, Division of Chemical Sciences, Geosciences and Biosciences of the US Department of Energy Grant DE-FG02-88ER13873 (to E.M.M.). The E.M.M. laboratory is also supported by funds from the Howard Hughes Medical Institute and the Gordon and Betty Moore Foundation (through Grant GBMF3406). Funding for E.M. was provided by NIH Grants R01-GM086883 and P50GM76516 to University of California, Irvine.
Footnotes
The authors declare no conflict of interest.
This article contains supporting information online at www.pnas.org/lookup/suppl/doi:10.1073/pnas.1502588112/-/DCSupplemental.
References
- 1.Furner IJ, Pumfrey JE. Cell fate in the shoot apical meristem of Arabidopsis thaliana. Development. 1992;115(3):755–764. [Google Scholar]
- 2.Traas J, Vernoux T. The shoot apical meristem: The dynamics of a stable structure. Philos Trans R Soc Lond B Biol Sci. 2002;357(1422):737–747. doi: 10.1098/rstb.2002.1091. [DOI] [PMC free article] [PubMed] [Google Scholar]
- 3.Satina S, Blakeslee AF, Avery AG. Demonstration of the three germ layers in the shoot apex of datura by means of induced polyploidy periclinal chimaeras. Am J Bot. 1940;27(10):895–905. [Google Scholar]
- 4.Errera L. Über Zellformen und Seifenblasen. Botanisches Centralblatt. 1888;34:395–398. [Google Scholar]
- 5.Hofmeister W. Zusatze und berichtigungen zu den 1851 veröffentlichen untersuchungen der entwicklung höherer kryptogamen. Jahrbucher fur Wissenschaft und Botanik. 1863;3:259–293. [Google Scholar]
- 6.Sachs J. Uber die Anordnung der Zellen in jungsten Pflanzentheilen. Arbeiten des Botanisches Institut Wurzburg. 1878;2:46–104. [Google Scholar]
- 7.Flanders DJ, Rawlins DJ, Shaw PJ, Lloyd CW. Nucleus-associated microtubules help determine the division plane of plant epidermal cells: Avoidance of four-way junctions and the role of cell geometry. J Cell Biol. 1990;110(4):1111–1122. doi: 10.1083/jcb.110.4.1111. [DOI] [PMC free article] [PubMed] [Google Scholar]
- 8.Sinnot EW, Bloch R. The relative position of cell walls in developing plant tissues. Am J Bot. 1941;28(7):607–617. [Google Scholar]
- 9.Besson S, Dumais J. Universal rule for the symmetric division of plant cells. Proc Natl Acad Sci USA. 2011;108(15):6294–6299. doi: 10.1073/pnas.1011866108. [DOI] [PMC free article] [PubMed] [Google Scholar]
- 10. Smith L (2006) Division plane determination in plant cells. Plant Physiology, eds Taiz L, Zeiger E (Sinauer, Sunderland, MA), 5th Ed. Available at 5e.plantphys.net/article.php?ch=&id=225.
- 11.Lynch TM, Lintilhac PM. Mechanical signals in plant development: A new method for single cell studies. Dev Biol. 1997;181(2):246–256. doi: 10.1006/dbio.1996.8462. [DOI] [PubMed] [Google Scholar]
- 12.Chadi D. Energy minimization approach to the atomic geometry of semiconductor surfaces. Phys Rev Lett. 1994;41(15):1062–1065. [Google Scholar]
- 13.Shapiro BE, et al. Using geometric markers to predict the cell division plane in meristem cells. In: DeJong T, Da Silva D, editors. Proceedings of the Sixth International Workshop on Functional-Structural Plant Models. Univ of California; Davis, CA: 2010. pp. 128–131. [Google Scholar]
- 14.Kierzkowski D, et al. Elastic domains regulate growth and organogenesis in the plant shoot apical meristem. Science. 2012;335(6072):1096–1099. doi: 10.1126/science.1213100. [DOI] [PubMed] [Google Scholar]
- 15.Smith LG. Plant cell division: Building walls in the right places. Nat Rev Mol Cell Biol. 2001;2(1):33–39. doi: 10.1038/35048050. [DOI] [PubMed] [Google Scholar]
- 16.Alim K, Hamant O, Boudaoud A. Regulatory role of cell division rules on tissue growth heterogeneity. Front Plant Sci. 2012;3:174. doi: 10.3389/fpls.2012.00174. [DOI] [PMC free article] [PubMed] [Google Scholar]
- 17.Kwiatkowska D. Structural integration at the shoot apical meristem: Models, measurements, and experiments. Am J Bot. 2004;91(9):1277–1293. doi: 10.3732/ajb.91.9.1277. [DOI] [PubMed] [Google Scholar]
- 18.Smith LG, Hake S. The initiation and determination of leaves. Plant Cell. 1992;4(9):1017–1027. doi: 10.1105/tpc.4.9.1017. [DOI] [PMC free article] [PubMed] [Google Scholar]
- 19.Foard DE. The initial protrusion of a leaf primordium can form without concurrent periclinal cell divisions. Can J Bot. 1971;49(9):1601–1603. [Google Scholar]
- 20.Sahlin P, Jönsson H. A modeling study on how cell division affects properties of epithelial tissues under isotropic growth. PLoS ONE. 2010;5(7):e11750. doi: 10.1371/journal.pone.0011750. [DOI] [PMC free article] [PubMed] [Google Scholar]
- 21.Cunninghame ME, Lyndon RF. The relationship between the distribution of periclinal cell divisions in the shoot apex and leaf initiation. Ann Bot (Lond) 1986;57(6):737–746. [Google Scholar]
- 22.Lyndon RF. Leaf formation and growth of the shoot apical meristem. Physiol Veg. 1972;10:209–222. [Google Scholar]
- 23.Reddy GV, Meyerowitz EM. Stem-cell homeostasis and growth dynamics can be uncoupled in the Arabidopsis shoot apex. Science. 2005;310(5748):663–667. doi: 10.1126/science.1116261. [DOI] [PubMed] [Google Scholar]
- 24.Mineyuki Y. The preprophase band of microtubules: Its function as a cytokinetic apparatus in higher plants. Int Rev Cytol. 1999;187:1–49. [Google Scholar]
- 25.Fernandez R, et al. Imaging plant growth in 4D: Robust tissue reconstruction and lineaging at cell resolution. Nat Methods. 2010;7(7):547–553. doi: 10.1038/nmeth.1472. [DOI] [PubMed] [Google Scholar]
- 26.Collins TJ. ImageJ for microscopy. Biotechniques. 2007;43(1) Suppl:25–30. doi: 10.2144/000112517. [DOI] [PubMed] [Google Scholar]
Associated Data
This section collects any data citations, data availability statements, or supplementary materials included in this article.