Therapy-related acute myeloid leukemia (t-AML) and therapy-related myelodysplastic syndrome (t-MDS) are well-recognized complications of cytotoxic chemotherapy and/or radiotherapy1. There are several features that distinguish t-AML from de novo AML including a higher incidence of TP53 mutations2,3, abnormalities of chromosomes 5 or 7, complex cytogenetics, and a reduced response to chemotherapy4. However, it is not clear how prior exposure to cytotoxic therapy influences leukemogenesis. In particular, the mechanism by which TP53 mutations are selectively enriched in t-AML/t-MDS is unknown. Here, we show by sequencing the genomes of 22 cases of t-AML that the total number of somatic single nucleotide variants and percentage of chemotherapy-related transversions are similar in t-AML and de novo AML, indicating that prior chemotherapy does not induce genome-wide DNA damage. We identified four cases of t-AML/t-MDS where the specific TP53 mutation was present at low frequencies (0.003–0.7%) in mobilized blood leukocytes or bone marrow 3–6 years prior to the development of t-AML/t-MDS, including two cases in which the relevant TP53 mutation was detected prior to any chemotherapy. Moreover, functional TP53 mutations were identified in small populations of peripheral blood cells of healthy chemotherapy-naïve elderly individuals. Finally, murine bone marrow chimeras containing both wild type and Tp53+/− hematopoietic stem/progenitor cells (HSPCs) preferentially expanded after exposure to chemotherapy. These data suggest that cytotoxic therapy does not directly induce TP53 mutations. Rather, they support a model in which rare HSPCs carrying age-related TP53 mutations are resistant to chemotherapy and expand preferentially after treatment. The early acquisition of TP53 mutations in the founding HSPC clone probably contributes to the frequent cytogenetic abnormalities and poor responses to chemotherapy that are typical of patients with t-AML/t-MDS.
T-AML/t-MDS are clonal hematopoietic disorders that typically develop 1–5 years following exposure to chemotherapy or radiotherapy1. To better understand how prior cytotoxic therapy contributes to the high incidence of TP53 mutations and karyotypic abnormalities in t-AML/t-MDS, we sequenced the genomes of 22 cases of t-AML, including one case reported previously5. These data were compared to whole genome sequence data previously reported for de novo AML6 and secondary-AML (s-AML) arising from MDS not receiving previous chemotherapy except hydroxyurea7,8. Of the sequenced t-AML cases, 23% had rearrangements of MLL, 23% complex cytogenetics, and 36% normal cytogenetics (Extended Data Table 1 & Suppl. Table 1).
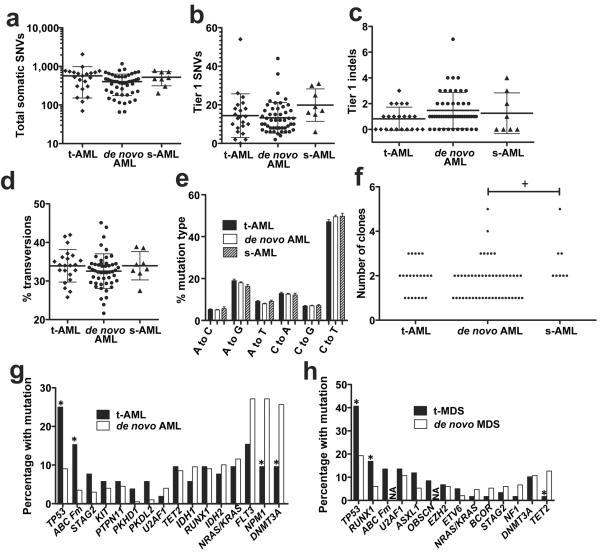
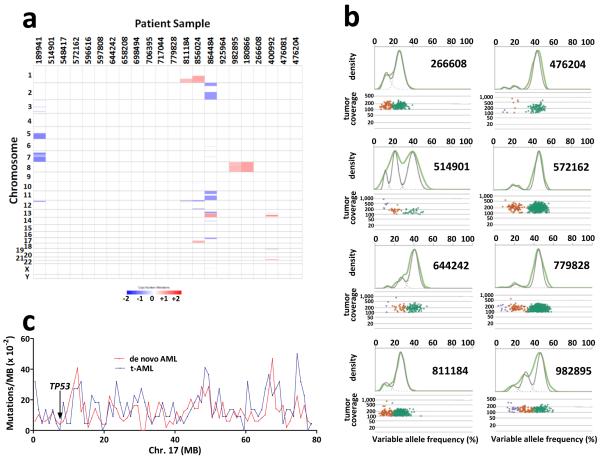
We predicted that DNA damage induced during exposure to cytotoxic therapy would manifest itself in t-AML genomes with an increased mutation burden. However, the total number of validated somatic single nucleotide variants (SNVs) and genic (tier 1) somatic SNVs identified was similar to that for de novo AML and s-AML (Fig. 1a–b). Likewise, the number of small insertions or deletions (indels) in genic regions was similar in t-AML, de novo AML, and s-AML (Fig. 1c). A prior study showed that transversions are specifically enriched in relapsed AML following chemotherapy9. However, the percentage of transversions, and in fact of all six classes of SNVs, was similar in all three cohorts (Fig. 1d–e). Structural variants and somatic copy number alterations were uncommon in these t-AML cases (Suppl. Table 2 and Extended Data Fig. 1A). Moreover, the number of identifiable subclones in t-AML was similar to that observed in de novo AML (Fig. 1f and Extended Data Fig. 1B). Collectively, these data show that the mutation burden of t-AML genomes is similar to that of de novo AML genomes.
Figure 1. The mutational burden in t-AML is similar to de novo AML.
a, Total number of validated tier 1–3 somatic SNVs in t-AML (n=22), de novo AML (n=49), and s-AML (n=8). The mean ages of the t-AML, de novo AML, and s-AML cohorts were 55.7, 51, and 54.6 years respectively. b, Number of validated tier 1 somatic SNVs. c, Number of validated tier 1 small insertions/deletions (indels). d, Percentage of tier 1–3 somatic SNVs that are transversions. e, Mutational spectrum for all validated tier 1–3 somatic SNVs. f, Number of distinct clones per sample inferred from the identification of discrete clusters of mutations with distinct variant allele frequencies. g, Percentage of cases of t-AML (n=52) or de novo AML (n=199) harboring non-synonymous mutations of the indicated gene. h, Percentage of cases of t-MDS (n=59) or de novo MDS (n=150) harboring non-synonymous mutations of the indicated gene. ABC Fm: ABC family genes; NA: not available; s-AML: AML following MDS. +P<0.05 by one-way Anova. *P<0.05 by Fisher's Exact test. Data represent the mean ± SD.
We next asked whether the pattern of genes frequently mutated in t-AML/t-MDS is distinct from that observed in de novo AML/MDS. Whole genome sequencing identified an average of 10.2 ± 7.1 missense, nonsense, in-frame indel, or frameshift mutations per t-AML genome (Suppl. Table 3). To better define the frequency of specific mutations in t-AML/t-MDS, we sequenced a panel of 149 “AML/MDS” genes in an additional 89 patients with t-AML or t-MDS (Suppl. Table 4). We combined the whole genome sequence data with the extension series to report on 52 cases of t-AML and 59 cases of t-MDS. Abnormalities of chromosome 5 or 7 or complex cytogenetics were present in 55.0% of cases (Extended Data Table 2 & Suppl. Table 1). The t-AML/t-MDS data were compared to 199 previously reported de novo AML genomes or exomes6 or 150 previously reported cases of de novo MDS in which extensive candidate gene sequencing was performed8. As reported previously, TP53 mutations are significantly enriched in t-AML/t-MDS compared with de novo AML/MDS (Fig. 1g–h and Suppl. Table 5). Interestingly, mutations of ABC transporter genes, a subset of which have been implicated in chemotherapy resistance, also are enriched in t-AML versus de novo AML. On the other hand, several well-defined driver gene mutations (i.e., DNMT3A and NPM1) were significantly less common in t-AML. Thus, although the total mutation burden is similar, a distinct subset of mutated genes is present in t-AML/t-MDS.
TP53 is the most commonly mutated gene in t-AML/t-MDS with 33.3% of patients affected in our series (Fig. 1g–h); the vast majority of these mutations have previously been identified as pathogenic10. Multivariate analysis revealed that TP53 mutations were associated with poor risk cytogenetics and a worse prognosis (Suppl. Tables 6 & 7 and Extended Data Fig. 2), both hallmarks of t-AML/t-MDS. These observations suggest a central role for TP53 mutations in the pathogenesis of many cases of t-AML/t-MDS. However, the mechanism by which TP53 mutations are selectively enriched in t-AML/t-MDS is unclear. The mutation burden in the genomic region containing TP53 (including silent Tier 1, Tier2, and Tier 3 mutations) is similar between t-AML and de novo AML (Extended Fig. 1C). Thus, it is not likely that chemotherapy directly induces TP53 mutations. We recently reported that individual HSPCs accumulate somatic mutations as a function of age, such that by age 50, there are on average 5 coding gene mutations per HSPC11. Based on this data and on current estimates that there are approximately 10,000 HSCs in humans12, we predict that 44% of healthy individuals at 50 years of age may have at least one HSPC that carries a randomly generated, functional TP53 mutation (see extended Methods). TP53 plays a central role in regulating cellular responses to genotoxic stress13–17, and loss of TP53 provides a selective advantage for neoplastic growth18. Together, these observations suggest a model in which rare HSPCs carrying age-related TP53 mutations are resistant to chemotherapy and expand preferentially after treatment (Extended Data Fig. 3).
This model suggests the following testable predictions: 1) in patients with t-AML containing clonal TP53 mutations, HSPCs harboring the specific TP53 mutation will be present long before the development of overt t-AML; 2) somatic TP53 mutations will be present in the HSPCs of some healthy individuals never exposed to cytotoxic therapy; and 3) HSPCs harboring TP53 mutations will expand under the selective pressure of chemotherapy.
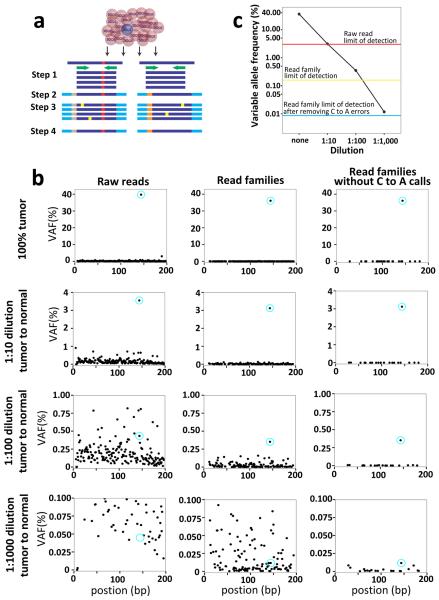
To test the first prediction, we identified 7 cases of t-AML/t-MDS with specific TP53 mutations for whom we had leukapheresis or bone marrow specimens banked 3–8 years prior to the development of t-AML/t-MDS (Extended Table 3). Of note, in all the cases, the TP53 mutation was clonal in the t-AML/t-MDS diagnostic sample. Current next-generation sequencing (NGS) technology is limited in the detection of rare variant alleles due to an intrinsic sequencing error rate of ~ 0.1%19. To overcome this limitation, we introduced random bar codes during production of the sequencing libraries, such that sequence “read families” containing unique bar codes are generated (Extended Fig. 4a). Using tumor DNA with a known TP53 mutation, we show that this assay can detect a variant allele with a frequency of 0.009% (Extended Fig. 4b–c).
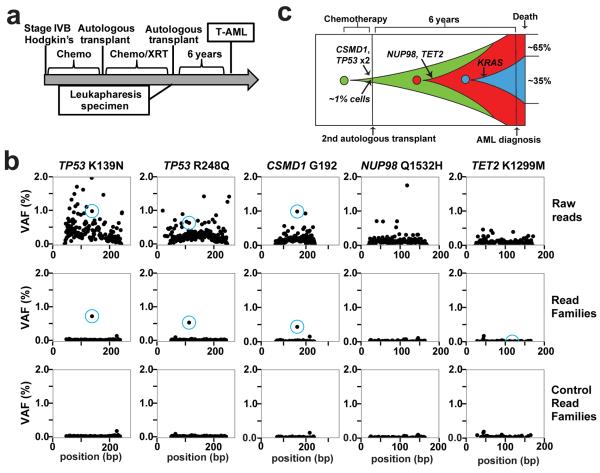
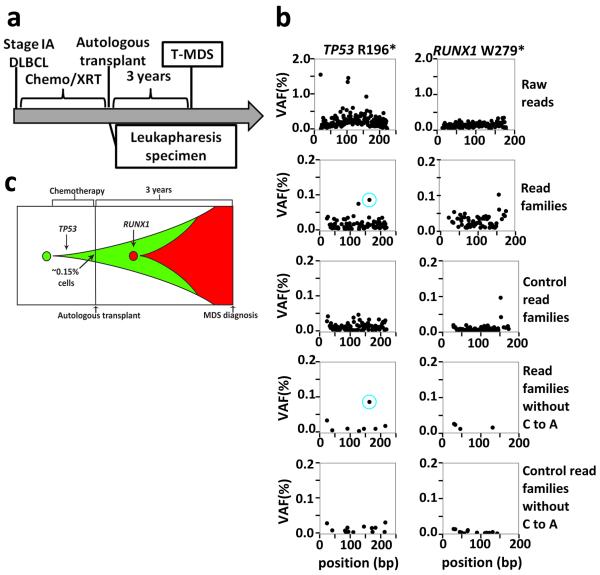
The specific TP53 mutation present in the diagnostic t-AML/t-MDS sample was identified in prior-banked specimens in four out of the seven cases tested (see Supplementary Materials for case presentations); in the other three cases, we were unable to detect the diagnostic TP53 mutation in the prior banked blood or bone marrow sample; it is not clear whether these mutations were present but below our limit of detection or were truly absent. Patient 530447 developed t-AML after an autologous stem cell transplant for refractory Hodgkin's lymphoma (Fig. 2A). The diagnostic t-AML sample carried biallelic mutations of TP53, missense mutations of TET2 and NUP98, a silent mutation of CSMD1, and a subclonal KRAS mutation. Analysis of a leukapheresis sample obtained 6 years prior to the development of t-AML revealed that both TP53 mutant alleles were present with a variant allele fraction (VAF) of approximately 0.5% (Fig. 2b). The CSMD1 mutation was also present at the same VAF and is likely a passenger mutation. However, two potential driver mutations (TET2 and NUP98) were not detectable in the prior banked sample. Thus, these data show that, in this patient, the biallelic TP53 mutations preceded the development of t-AML by at least six years and antedated the development of the TET2 and NUP98 mutations (Fig. 2c). In a second case (patient 341666), a heterozygous R196* TP53 mutation was identified in mobilized peripheral blood leukocytes 3 years prior to the development of t-MDS at a frequency of 0.1%, preceding the acquisition of a RUNX1 mutation (Extended Data Fig. 5).
Figure 2. Bi-allelic TP53 mutations are an early mutational event in the AML cells of UPN 530447.
a, Clinical course of case 530447. b, Unique adaptor sequencing of a leukapheresis sample obtained 6 years prior to the diagnosis of t-AML for each of the five clonal somatic SNVs identified in the diagnostic t-AML sample. Genomic DNA from a patient lacking these variants served as a control. The blue circle indicates the position of the variant SNV. c, Proposed model of clonal evolution to t-AML in this case.
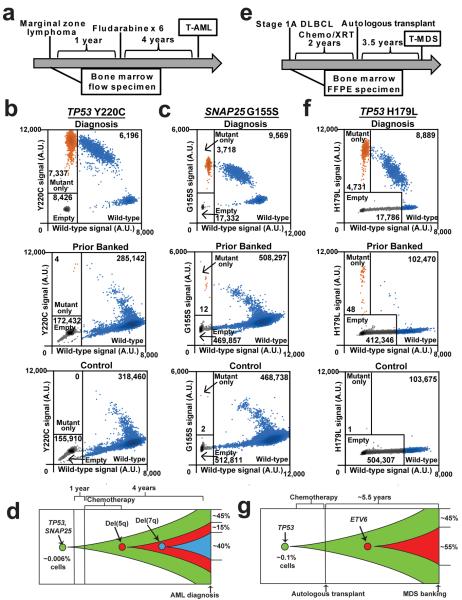
In two of the four cases, the prior banked sample was obtained prior to the initiation of chemotherapy. Patient 967645 developed t-AML 5 years after the diagnosis of marginal zone lymphoma (Fig 3a). The diagnostic t-AML sample contained a homozygous Y220C TP53 mutation. Using a droplet digital PCR (ddPCR) assay, we identified the same Y220C TP53 mutation in a bone marrow sample obtained before any chemotherapy at a frequency of 0.0027% (average of two independent experiments) (Fig 3b). We next asked whether other mutations in the diagnostic t-AML sample also were present in this prior banked sample (Suppl. Table 8). We focused on G155S SNAP25; this mutation is likely a non-pathogenic mutation as this gene is not expressed in AML samples6. Indeed, we identified the G155S SNAP25 mutation in the prior banked bone marrow sample with a similar VAF (0.0029%) as that for Y220C TP53 (Fig 3c). Of note, del 5 and del 7 were subclonal at diagnosis (present in 54% and 38% of metaphases, respectively) (Suppl. Table 1). Collectively, these data provide evidence that an HSPC harboring a Y220C TP53 mutation preferentially expanded after chemotherapy with the subsequent acquisition of del 5 and then del 7 (Fig 3d). Of note, we found two other cases of t-AML/t-MDS with clonal TP53 mutations but subclonal del 5 and/or del 7 (UPNs 756582 and 837334, Suppl. Table 1). Together, these data suggest that TP53 mutations precede the development of these characteristic cytogenetic abnormalities of t-AML/t-MDS.
Figure 3. HSPC clones harboring somatic TP53 mutations are detected in patients prior to cytotoxic therapy exposure.
a, Clinical course of case 967645. b, Dot plots of droplet digital PCR of a diagnostic t-AML sample from case 967645, a bone marrow sample from this patient obtained 5 years prior to the development of t-AML (prior to any cytotoxic therapy), or a control sample from a patient lacking a mutation in TP53. Droplets containing only the Y220C TP53 allele are highlighted in orange, droplets containing wild type TP53 (with or without Y220C TP53) are highlighted in blue; empty droplets are gray. The number of droplets in each gate is indicated. Data are representative of two independent experiments. c, Dot plots of droplet digital PCR data for G155S SNAP25 using the same genomic DNA as in b. d, Proposed model of clonal evolution to t-AML in case 967645. e, Clinical course of case 895681. f, Dot plots of droplet digital PCR data of the diagnostic t-AML sample from case 895681, a bone marrow FFPE sample from this patient obtained 3.5 years prior to the development of t-MDS (prior to any cytotoxic therapy), or a control FFPE sample obtained from a patient lacking a mutation in TP53. The labeling scheme is the same as in b. g, Proposed model of clonal evolution to t-AML in case 895681; the diagnostic t-MDS sample contained a subclonal ETV6 mutation.
In a second case, patient 895681 developed t-MDS 3.5 years after the initiation of chemotherapy for Non-Hodgkin's lymphoma (Fig 3e). The diagnostic t-MDS sample contained a clonal TP53 H179L mutation. Using ddPCR, we identified TP53 H179L at a VAF of 0.05% in a bone marrow sample taken prior to the initiation of cytotoxic therapy (Fig 3f). Thus, as with patient 967645, a HSPC carrying a functional TP53 mutation was present prior to cytotoxic therapy exposure, later giving rise to the malignant t-AML/t-MDS clone (Fig 3g).
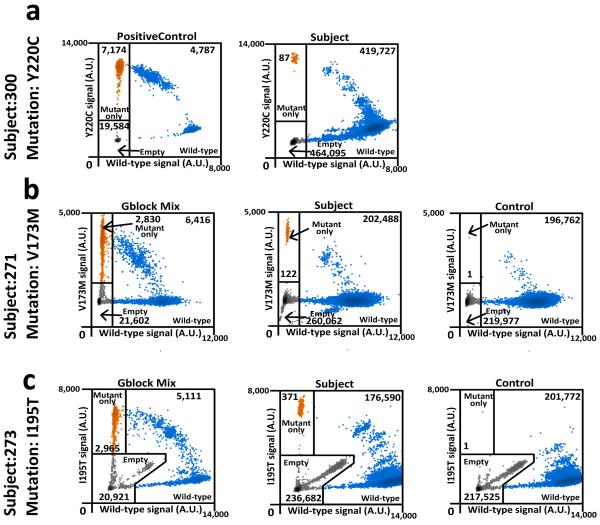
To determine whether HSPCs harboring TP53 mutations are present in healthy individuals, we analyzed peripheral blood leukocytes from 20 elderly (68—89 years old) cancer-free donors who had not received prior cytotoxic therapy. We limited our sequencing to exons 4–8 of TP53 since the majority of pathogenic mutations in TP53 are located in these exons. Using our unique adaptor sequencing assay, we identified TP53 mutations in 9 of 19 evaluable cases, with VAFs ranging from 0.01% to 0.37% (Extended Table 4). Of note, since we did not sequence the entire coding region of TP53, it is likely that our study underestimates the true frequency of healthy elderly individuals harboring HSPCs with TP53 mutations. Droplet digital PCR confirmed the presence of the TP53 mutation in all three cases that were tested (Extended Fig. 6). Interestingly, the majority of the TP53 mutations identified are known pathogenic mutations previously implicated in cancer. These data suggest that functional TP53 mutations may confer (even in the absence of cytotoxic therapy) a subtle competitive advantage that results in modest HSPC expansion over time.
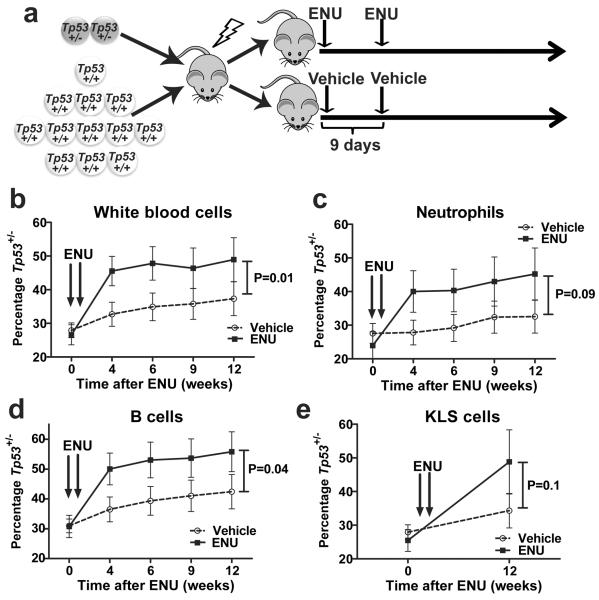
To directly test the hypothesis that functional TP53 mutations confer a survival advantage after chemotherapy, we generated mixed bone marrow chimeras containing both wild type and Tp53+/− cells (Fig. 4a). In mice treated with vehicle control, we observed a non-significant trend towards increased Tp53+/− donor contribution to hematopoiesis (Fig 4b–e). Whether longer follow up would confirm a subtle competitive advantage, as suggested by the expansion of TP53 mutant HSPC clones in elderly healthy individuals, will require additional study. Regardless, upon treatment with N-ethyl-N-nitrosourea, Tp53+/− HSPCs display a competitive advantage. Importantly, a prior study similarly showed that Tp53+/− HSCs also have a competitive advantage following irradiation, which appeared to be due, at least in part, to reduced irradiation-induced senescence in Tp53+/− HSCs 20,21.
Figure 4. Heterozygous loss of TP53 confers a clonal advantage to HSCs after exposure to ENU.
a, Experimental schema. Bone marrow chimeras were generated by transplanting a seven to one ratio of wild type to Tp53+/− bone marrow into irradiated syngenic recipients. Following hematopoietic reconstitution (5 weeks) mice were treated with ENU or vehicle control as indicated. b–d, Shown is the percentage of total leukocytes (b), Gr-1+ neutrophils (c), or B220+ B cells (d) that were derived from Tp53+/− cells. e, Percentage of Kit+ lineage− Sca+ (KSL) cells in the bone marrow 12 weeks after ENU exposure that were derived from Tp53+/− cells. Data represent the mean ± SEM of 11 and 14 mice in the ENU and vehicle cohorts respectively. Peripheral chimerism was analyzed using 2-way Anova and KLS chimerism with ANCOVA.
There is increasing evidence that cancers undergo clonal evolution under the selective pressure of chemotherapy 22. For example, the clonal architecture of de novo AML is dynamic, with certain (often minor) subclones becoming dominant at relapse following chemotherapy 9. Here, we show that HSPCs that acquire heterozygous TP53 mutations as a function of normal aging also are subject to Darwinian selection upon exposure to cytotoxic therapy, ultimately resulting in the expansion of HSPCs with these mutations. The high frequency (nearly 50%) of elderly individuals with detectable heterozygous TP53 mutations in their circulating leukocytes far exceeds the prevalence of AML or MDS in this age group. Clearly, additional mutations, including mutation of the second TP53 allele, are needed for transformation to AML or MDS. Consistent with this observation, only a minority of patients with Li Fraumeni syndrome, most of whom harbor germline heterozygous TP53 mutations, develop AML or MDS 23. This model provides a potential mechanism for the high incidence of TP53 mutations in t-AML/t-MDS24. The TP53 mutation in the founding clone likely contributes to the frequent cytogenetic abnormalities and poor response to chemotherapy that are typical of t-AML/t-MDS. For t-AML/t-MDS cases that do not harbor TP53 mutations, it will be important to determine whether different age-related mutations also confer a competitive advantage to HSPCs that are exposed to cytotoxic therapy and to define the nature of these mutations.
METHODS
Patient Characteristics
For the whole genome sequencing study, we intentionally selected the original 22 cases of t-AML to have minimal numbers of cytogenetic abnormalities. However, the additional 89 cases of t-AML/t-MDS were randomly selected from those samples with sufficient tumor and skin DNA. All patients were selected from a larger cohort of adult AML and MDS patients enrolled in a single institution tissue banking protocol that was approved by the Washington University Human Studies Committee (WU HSC#01-1014). Written informed consent for whole genome sequencing was obtained from all study participants. Patients were treated in accordance with NCCN guidelines (www.nccn.org) with an emphasis on enrollment in therapeutic clinical trials whenever possible. Clinical data for all patients, including the pre-existing condition requiring cytotoxic therapy, the cytotoxic therapy received prior to the t-AML/t-MDS diagnosis, cytogenetics, treatment approach, and outcomes data, are presented in Extended Table 1 and 2 & Suppl. Table 1. Peripheral blood leukocyte genomic DNA from cancer-free individuals (median age = 75.3 ± 6.6 years) was obtained as part of a Washington University Institutional Review Board-approved protocol. All subjects had no previous history of invasive cancer or treatment with cytotoxic therapy, as determined by the medical history.
Whole genome sequencing and variant detection
The procedure described by Mardis et al25 was followed for library construction and whole genome sequencing. Briefly, Illumina DNA sequencing was used to generate sequence that covered the haploid reference at a depth between 30.51 and 72.60 (Suppl. Table 9). Sequence data was aligned to reference sequence build NCBI-human-build36 using bwa version 0.5.526 (params: -t 4) then merged and deduplicated using picard version 1.29. We detected SNVs using the intersection of samtools version r96327 (params: -A -B) and Somatic Sniper v0.7.328 (params: -q 1 -Q 15) and filtered to remove false-positives (params: min-base-quality 15, minmapping-quality 40, min-somatic-score 40). Indels were detected using GATK version 533629 unioned with Pindel version 0.530. Somatic copy number alterations were detected using copyCat version 1.5 (http://github.com/chrisamiller/copycat). We detected structural variants using BreakDancer version 1.231 and SquareDancer version 0.1 (https://github.com/genome/gms-core/blob/master/lib/perl/Genome/Model/Tools/Sv/SquareDancer.pl) followed by assembly with Tigra-SV (http://gmt.genome.wustl.edu/tigra-sv/0.1/index.html). SciClone (in review - http://github.com/genome/sciclone) was used to infer the subclonal architecture of all WGS samples.
Validation and extension sequencing with variant detection
We used custom sequence capture arrays from Roche Nimblegen that targeted variants detected by whole genome sequencing and extended this array to cover all coding exons from an additional 149 genes of interest (Suppl. Table 4). Libraries were prepared, sequence was generated, and somatic alterations identified as described for whole genome sequencing, with the addition of VarScan v2.2.632 (params: --min-var-freq 0.08 --p-value 0.10 --somatic-p-value 0.01 -validation) as a variant caller for both SNVs and indels. On average, genes were covered with a depth of 58.3 (Suppl. Table 10). Biallelic TP53 mutations in case 530447 were confirmed with PCR amplification of the genomic region containing both somatic mutations from the diagnostic t-AML sample. The resulting amplicons were cloned into the pCR-TOPO plasmid vector (Life Sciences) and sequenced using Sanger sequencing.
Statistical analyses
Fisher's Exact tests were used to evaluate the association between pairs of dichotomous variables, with a significant right-sided p-value indicating a positive relationship and a significant left-sided p-value indicating a negative relationship. The relationship between overall survival and each discrete measure was tested with Kaplan-Meier survival analyses with separate analyses for the AML and MDS groups. Age at diagnosis was discretized into quartiles for each group. Multivariate proportional-hazards regression models were created separately for the AML and MDS groups. All variables with log-rank p-values of 0.20 or less in the Kaplan-Meier analyses were included in the first step. In successive steps, the variable with the largest p-value was removed and the model re-run until all remaining variables had p-values of 0.05 or less. Two-way interactions among the remaining variables were examined. Variables removed in earlier steps were added back to the model one at a time to determine if they significantly improved the final model. The proportionality assumption was evaluated for each variable in the final models.
Rare variant detection using unique adaptor next generation sequencing (NGS)
Amplicons approximately 200 bp in length were prepared from patient genomic DNA samples using primers designed to amplify genomic regions harboring known tumor-specific SNVs (Suppl. Table 11). These amplicons were prepared for NGS using the Illumina TruSeq DNA Sample Preparation Kit (Illumina Catalog #FC-121-2001) replacing the kit adapters with adapters containing a random nucleotide index sequence. Libraries were quantified using the Agilent qPCR NGS Library Quantification Kit, Illumina GA (Agilent Technologies Catalog #G4880A). Using this quantification, each library was diluted to ensure that each random index would be observed in multiple sequenced reads33,34. Each diluted library was amplified and sequenced on the Illumina MiSeq platform. Sequenced reads containing the same index sequence were grouped together creating “read families” in a manner similar to established methods33,34. Reads within a read family were aligned against each other to filter out stochastic sequencing errors generating an error-corrected read family consensus sequence. Each consensus sequence was locally-aligned to UCSC hg19/GRCh37 using bowtie235 with the default settings. The aligned read families were processed with Mpileup27 using the parameters –BQ0 –d 10000000000000. Next, variants were called with VarScan32 using the parameters --min-coverage 10000 --min-reads2 10 --min-avg-qual 0 --min-var-freq 0 --p-value 1. Variant allele frequencies for the expected mutations and the background error rate were visualized using IGV36 and graphically represented using ggplot237. Variant coordinates are displayed in hg18/GRCh36.
Detection of somatic TP53 mutations in cancer free subjects using unique adaptor NGS
Amplicons were prepared from healthy control genomic DNA samples using primers designed to amplify exons four through eight of TP53 (Suppl. Table 11). Patient specific barcodes, six nucleotides in length, were appended to the 5-prime end of each primer to enable pooling of multiple samples for sequencing. Amplicons generated from each TP53 exon/patient sample combination were generated as previously described and purified products were pooled in equimolar amounts. The pooled barcoded amplicons were prepared for error-corrected sequencing as previously described. Sequencing was completed on the Illumina Hi-Seq 2500 platform. Sequenced reads were demultiplexed based on the known patient-specific barcode sequences using a two nucleotide hamming distance. Demultiplexed sequence reads were organized into read families based on their random oligonucleotide index sequence and error-corrected as outlined previously. Read families comprised of three reads or more were used for analysis. A binomial distribution of the substitution rate at each covered base in TP53 was used to identify individuals with somatic TP53 mutations. A variant was called if it met the following criteria: 1) the binomial p-value was less than 10−6; 2) the VAF was greater than 1:10,000; 3) at least 10,000 unique read families were sequenced at the position of interest; 4) at least 10 read families called the variant; and 5) the VAF in the individual was greater than five times the mean VAF for all individuals with greater than 10,000x coverage at that specific nucleotide. Read families from one patient sample (barcode GTACGGC) were removed from analysis due to a high error rate. All somatic mutations were identified in this manner except for TP53 Y220C, which received closer manual inspection due to the large number of these mutations observed in our t-AML cohort.
Extraction of genomic DNA from FFPE samples
Genomic DNA was extracted from FFPE samples with the QIAamp DNA FFPE Tissue Kit. Because of the effects of formalin fixation (cross-linking, DNA fragmentation, etc.), the amount of amplifiable DNA per sample was less than would be expected with Qubit® fluorometric quantitation. As such, ddPCR was used to quantify the amount of amplifiable genomic DNA per sample such that the number of amplifiable domains tested were comparable between experimental and control samples.
Droplet digital PCR
All primers and probes for droplet digital PCR were designed by Bio-Rad per MIQE guidelines38. In the case of TP53 Y220C, the TP53 region of interest in exon 6 was amplified with the following primers: 5'-TTTTCGACATAGTGTGGTG-3' and 5'-CTGACAACCACCCTTAAC-3'. The 5'-Hex/TGCCCTATGAGCCGCCT/Iowa Black FQ® -3' probe was used to detect the wild-type allele and the 5'-FAM/CCCTGTGAGCCGCCTGA/Iowa Black FQ®-3' probe was used to detect the mutant allele. All reagents were purchased from Bio-Rad. Droplet digital PCR was performed as previously described39. Specifically, quantitative PCR was performed with 900 nM-1800 nM forward and reverse primers, 250 nM mutant and wild-type genomic probes, and 2–4 ng/μl genomic DNA. Quantitative PCR was performed with annealing/extension temperatures of 55.5–60°C × 40 cycles. For droplet generation and analysis, we used the Bio-Rad QX100™ and QX200™ Droplet Digital™ PCR Systems.
Due to the fact that DNA degradation with time (i.e. guanosine oxidation, cytosine deamination) is known to interfere with rare allele detection34, we only identified variant alleles present in droplets also lacking the reference allele. This greatly increased the specificity of our calls by removing droplets in which one of the two DNA strands may have been chemically altered. At low variant allele frequency, it was assumed that only a single variant allele was present in these “mutant only” drops. Droplet allele distribution follows a Poisson distribution such that the number of droplets only containing a single allele (either variant or reference) can be determined from the percentage of empty droplets. Of note, droplets showing evidence of template independent amplification (i.e., observed in “no template controls”) were counted as empty droplets. The VAF was determined from the fraction of the single allele droplets containing the variant allele. When appropriate, control samples were used to subtract potential background signal. VAFs calculated in this method were highly concordant with VAFs obtained through unique-adaptor NGS.
Generation and analysis of Tp53+/− bone marrow chimeras
Tp53+/− and wild type mice were in bred on a C57BL/6 strain. Bone marrow from Tp53+/− mice expressing Ly5.2 was mixed at a 1:7 ratio with bone marrow from wild-type mice expressing Ly5.1 and transplanted retro-orbitally into lethally irradiated Ly5.1/5.2 recipients. Tp53+/− and wild-type donors were both age (6–12 weeks) and sex matched (female). A total of 3 × 10⁶ cells were injected per recipient mice. Recipient mice were conditioned with 1000–1100 cGy from a 137Cesium source at a rate of approximately 95 cGy/minute before transplantation. Prophylactic antibiotics (trimethoprim-sulfamethoxazole; Alpharma, East Bridgewater, NJ) were given during the initial 2 weeks after transplantation. Five weeks after transplantation, mice were given two doses of N-Nitroso-N-ethylurea (ENU, 100 mg/kg;Sigma-Aldrich, St. Louis, MO) or vehicle alone intraperitoneally 9 days apart. Mice were stratified according to Tp53+/− chimerism and then randomly distributed into the ENU and vehicle controls such that both cohorts had similar levels of Tp53+/− chimerism at baseline. ENU and placebo were delivered in a final solution with 10% DMSO, 90 mM sodium citrate, and 180 mM sodium phosphate, pH 5.0. Peripheral blood chimerism was measured prior to ENU administration and 4–12 weeks after ENU administration. The investigator was not blinded. Mice were euthanized and bone marrow chimerism analyzed 12 weeks after ENU administration. The desired cohort size was determined based on observations from previously reported experiments20, and two independent experiments were performed. Mice were maintained under standard pathogen free conditions according to methods approved by the Washington University animal studies committee.
Flow cytometry
Flow cytometry data were collected on a Gallios 10-color, 3-laser flow cytometer (Beckman Coulter) and analyzed with FlowJo software (Treestar). Cells were stained by standard protocols with the following antibodies (eBiosciences unless otherwise noted): Ly5.1 (A20, CD45.1), Ly5.2 (104, CD45.2), Ly6C/G (RB6-8C5, Gr-1), CD3e (145-2C11), CD45R (RA3-6B2, B220), CD11c (N418), TER-119, CD41 (MWReg30), CD117 (ACK2, c-kit), and Ly-6A/E (D7, Sca).
Estimation of TP53 mutation frequency in aging stem cells
The frequency and profile of somatic single nucleotide mutations in the HSCs of normal individuals have been previously measured. The somatic mutational burden is aging-related, and the estimated rate of mutagenesis obtained from this study was 3.2 × 10⁻⁹ mutations/nucleotide/year (95% CI 2.4 – 4.0 × 10⁻⁹) for the average nucleotide in the exome. Thus, we would predict an average 50 year old to have 1.6 × 10⁻⁷ mutations/position. These mutations would not be randomly distributed but biased (in particular towards C to T/G to A transitions). It has been previously proposed that an individual possesses approximately 10,000 distinct HSCs. We used a randomized Monte Carlo simulation to model the prevalence of somatic single nucleotide mutations in healthy 50 year olds with 10,000 HSCs given a normal somatic mutational profile and mutation rate. Repeated simulation (n=100,000) allowed us to predict the distribution of aging-induced TP53 (NM_000546) somatic mutations. As expected, this simulation modeled a Poisson process. We classified TP53 mutations as likely to be functional if they fulfilled both of the following criteria. First, we analyzed the mutations using the SIFT program (http://sift.jcvi.org) and required a SIFT score <=0.05. Second, we required that the somatic mutations be reported at least once if a nonsense mutation or at least twice if a missense mutation in the IARC TP53 database (http://p53.iarc.fr). Based on this simulation, we predict that 44% of 50 year-old individuals harbor one or more HSCs with a functional TP53 mutation.
Extended Data
Extended Data Figure 1. Whole genome sequencing analysis of tAML.
a, Somatic copy number alterations in the 22 cases of t-AML. Blue indicates copy number loss. Red indicates copy number gain. b, Representative clonality plots for 8 cases of t-AML are shown. Scatter plots (lower panel) show variant allele frequency and read depth in the tumor sample. Variant alleles in the founding clone are depicted as green, while variants in subclones are depicted as orange or purple. The upper panels contain kernel density plots of the VAF data (green line) along with the posterior predictive densities (grey line) from the mathematical model used to segregate clusters. c, Frequency of Tier 1 silent, Tier 2, and Tier 3 mutations in 1 Mb increments across chromosome 17 in de novo AML and t-AML. The TP53 genomic locus is identified.
Extended Data Figure 2. TP53 mutations are associated with decreased overall survival in t-AML/t-MDS.
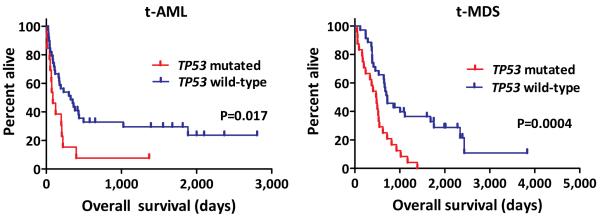
a, Overall survival in TP53 mutated (n=13) and TP53 wildtype (n=39) t-AML patients. b, Overall survival in TP53 mutated (n=24) and TP53 wildtype (n=35) t-MDS patients.
Extended Data Figure 3. Model of how cytotoxic therapy shapes clonal evolution in t-AML/t-MDS.

Age-related mutations in hematopoietic stem/progenitor cells (HSPCs) result in the production of a genetically heterogeneous population of HSPCs, including rare HSPCs with heterozygous TP53 mutations in some individuals. During chemotherapy and/or radiotherapy for the primary cancer, HSPC clones harboring a TP53 mutation have a selective growth advantage, resulting in expansion of that clone. Subsequent acquisition of additional driver mutations results in transformation to t-AML/t-MDS. Of note, the presence of TP53 mutations likely accounts for this high incidence of cytogenetic abnormalities in t-AML/t-MDS and poor response to chemotherapy.
Extended Data Figure 4. Validation of the unique adaptor sequencing method.
a, Unique adaptor sequencing approach. Step 1: Genomic DNA is amplified with TP53-specific primers (green) with subpopulation-specific variant alleles highlighted in red. Step 2: Randomly indexed adapters (tan and gray) are ligated to each amplicon. Step 3: The indexed amplicons are amplified to generate multiple reads possessing the same bar code (i.e., read families). Step 4: After sequencing, reads are aligned and grouped by read families to generate an error-corrected consensus sequence. Sequencing errors (yellow) are randomly distributed amongst read families, while true variant alleles (red) are present in all members of a given read family. b, A tumor sample (UPN 895681) with a known TP53 somatic mutation (chromosome 17: 7519119 T to A) at a variant allele frequency (VAF) of ~37% was mixed with normal genomic DNA sample at the indicated ratio, and conventional (left panel) or unique adaptor next generation sequencing (middle and right panels) was performed, as described in Methods. DNA degradation with time may result in errors which are then amplified during PCR, providing a source of false positive calls. This is particularly true for C to A transversions. Since none of the TP53 mutations analyzed in this study were C to A transversions, we also analyzed the data after removing C to A calls (right panel). The TP53 variant allele is circled in blue. c, The threshold of detection for the variant allele with each sequencing method is shown.
Extended Data Figure 5. Clonal evolution in case 314666.
a, Clinical course of case 341666. b, Unique adaptor sequencing was performed on genomic DNA derived from a leukapharesis samples obtained 3 years prior to the diagnosis of t-MDS for the two clonal mutations present in the diagnostic t-AML sample. Genomic DNA from a patient lacking these variants was used as a control. The blue circle indicates the position of the variant SNV. c, Proposed model of clonal evolution to t-MDS in this case.
Extended Data Figure 6. Droplet digital PCR verification of selected somatic TP53 mutations identified in peripheral blood of cancer-free individuals.
Droplet digital PCR was performed on genomic DNA isolated from the peripheral blood of cancer-free individuals (middle panel) for whom unique-read adaptor sequencing suggested the presence of the indicated TP53 mutation. Controls represent peripheral blood DNA from cancer-free elderly individuals with variant allele frequencies not above background levels for the mutation of interest (right panel); the negative control for Y220C TP53 is shown in Fig. 3b. The diagnostic t-AML sample from patient 967645 was used as a positive control for Y220C TP53 (a). For V173M TP53 (b) and I195T TP53 (c) double-stranded genomic blocks (gBlocks) were synthesized containing the mutation of interest and mixed with gBlocks of wild-type sequence. Droplets containing only the variant TP53 allele are highlighted in orange, droplets containing the wild type TP53 allele (with or without the variant TP53 allele) are highlighted in blue; empty droplets are gray. The number of droplets in each gate is indicated.
Extended Data Table 1. Clinical summary of the 22 t-AML whole genome sequencing cases.
Latency is defined as the time from the original cancer diagnosis to the development of t-AML/t-MDS.
| Age | Median | 56.5 years (26–80) |
|
| ||
| Gender | Male | 36.4% |
| Female | 63.6% | |
|
| ||
| Prior Disease | Breast | 45.5% |
| Non-Hodgkin's Lymphoma | 13.6% | |
| Multiple Sclerosis | 9.1% | |
|
| ||
| Known Previous Treatment | Other | 31.8% |
| Alkylator | 45.5% | |
| Topoisomerase inhibitor | 63.6% | |
| Radiation | 68.2% | |
| Autologous Transplant | 9.1% | |
|
| ||
| Latency | Median | 3.2 years (0.9–13.3) |
|
| ||
| Cytogenetics | complex | 22.7% |
| MLL rearrangement | 22.7% | |
| non-complex non-MLL | 63.6% | |
|
| ||
| % Blasts in the bone marrow | Median | 79% (19–95%) |
|
| ||
| Most intensive t-AML/t-MDS treatment regimen | Allogeneic transplant | 27.3% |
| Myeloablative | 40.9% | |
| Non-myeloablative | 13.6% | |
| Other/unknown | 18.2% | |
|
| ||
| Remisison | Yes | 50% |
| No | 40.9% | |
|
| ||
| Overal Survival | Median | 140.5 days (8–2000) |
Extended Data Table 2. Clinical summary of the combined 111 t-AML/t-MDS cases.
Latency is defined as the time from the original cancer diagnosis to the development of t-AML/t-MDS.
| Age | Median | 61 years (18–82) |
|
| ||
| Gender | Male | 53.2% |
| Female | 46.8% | |
|
| ||
| Prior Disease | Breast | 29.7% |
| Non-Hodgkin's Lymphoma | 24.7% | |
| Hodgkin's Disease | 22.5% | |
| Other | 37.8% | |
|
| ||
| Known Previous Treatment | Alkylator | 55.9% |
| Topoisomerase inihbitor | 50.5% | |
| Radiation | 63.1% | |
| Autologous Transplant | 21.6% | |
|
| ||
| Latency | Median | 6.25 years (0.4–40.7) |
|
| ||
| Diagnosis | Leukemia | 46.8% |
| MDS | 53.2% | |
|
| ||
| Cytogenetics | deletion 5 | 26.1% |
| deletion 7 | 28.8% | |
| complex | 45.0% | |
| MLL rearrangement | 5.4% | |
| other/unknown | 41.4% | |
|
| ||
| % Blasts in the bone marrow | Median | 13% (0–95%) |
|
| ||
| Most intensive AML treatment regimen | Allogeneic transplant | 41.4% |
| Myeloablative | 17.1% | |
| Non-myeloablative | 24.3% | |
| Other/unknown | 17.1% | |
|
| ||
| Remisison | Yes | 49.5% |
| No | 43.2% | |
|
| ||
| Overal Survival | Median | 414 days (8–3831) |
Extended Data Table 3. Prior banked tissue samples in patients with t-AML/t-MDS with clonal TP53 mutations.
All patients had one or more clonal TP53 mutation in their diagnostic t-AML/t-MDS samples (530447 had biallelic mutations). Cases in which the prior banked sample had detectable TP53 mutated cells are highlighted in red. See Suppl. Table 1 for the clinical and molecular features of these cases. BM FFPE: formalin-fixed parafin-embedded sample; BM flow: snap frozen bone marrow leukocyte pellet.
| Patient |
TP53 mutation in t-AML/t-MDS |
Prior banked tissue sample |
||||
|---|---|---|---|---|---|---|
| Position (Chr 17) | Mutation | Coding change | Year of Banking | Year of Diagnosis | Prior Banked Tissue | |
| 236041 | 7,518,261 | T to A | R249W | 2007 | 2011 | BM FFPE |
| 341666 | 7,518,988 | G to A | R196* | 2002 | 2005 | Pharesis |
| 530447 | 7,519,238 | C to G | K139N | 2001 | 2007 | Pharesis |
| 530447 | 7,518,263 | C to T | R248Q | 2001 | 2007 | Pharesis |
| 648904 | 7,514,759 | C to T | Exon 9 splice site | 2001 | 2004 | Pharesis |
| 756582 | 7,519,015 | C to T | Exon 6 splice site | 1999 | 2007 | Pharesis |
| 895681 | 7,519,119 | T to A | H179L | 2000 | 2006 | BM FFPE |
| 967645 | 7,518,915 | T to C | Y220C | 2005 | 2010 | BM Flow |
Extended Data Table 4. Somatic TP53 mutations in 19 cancer-free individuals. Coverage statistics are as follows.
In the amplicon targeting exon 4, 17/19 subjects had >10,000 coverage in 100% of the amplicon. In the amplicon targeting exon 5, 17/19 subjects had >10,000 coverage in 100% of the amplicon. In the amplicon targeting exon 6, 5/19 subjects had >10,000 coverage in 100% of the amplicon, and 11/19 subjects had >10,000 coverage in at least 75% of the amplicon. In the amplicon targeting exon 7, 17/19 subjects had >10,000 coverage in 100% of the amplicon. In the amplicon targeting exon 8, 18/19 subjects had >10,000 coverage in 100% of the amplicon. See Suppl. Table 11 for the primers used to make the amplicons from genomic DNA.
| Sample | Chr | Exon | Start | Stop | Ref | Var | Amino acid | COSMIC ID | Var count | Total read family count | VAF (read-family | VAF (ddPCR) |
|---|---|---|---|---|---|---|---|---|---|---|---|---|
| 34 | 17 | 7 | 7518230 | 7518230 | T | G | D259A | none | 13 | 33085 | 0.039% | N.D. |
| 99 | 17 | 7 | 7518273 | 7518273 | C | T | G245S | COSM6932 | 18 | 41836 | 0.043% | N.D. |
| 99 | 17 | 8 | 7517849 | 7517849 | C | T | V272M | COSM10891 | 26 | 81015 | 0.032% | N.D. |
| 269 | 17 | 8 | 7517845 | 7517845 | C | T | R273H | COSM10660 | 489 | 420026 | 0.12% | N.D. |
| 271 | 17 | 5 | 7519138 | 7519138 | C | T | V173M | COSM11084 | 177 | 182809 | 0.097% | 0.081% |
| 271 | 17 | 5 | 7519174 | 7519174 | C | T | A161T | COSM10739 | 25 | 164591 | 0.015% | N.D. |
| 271 | 17 | NA | 7520035 | 7520035 | A | T | SPLICING | COSM152274 | 23 | 165672 | 0.014% | N.D. |
| 271 | 17 | NA | 7517934 | 7517934 | C | T | INTRONIC | none | 36 | 333996 | 0.011% | N.D. |
| 273 | 17 | 6 | 7518990 | 7518990 | A | G | I195T | COSM11089 | 57 | 15540 | 0.37% | 0.28% |
| 300 | 17 | 6 | 7518915 | 7518915 | T | C | Y220C | COSM10758 | 91 | 316765 | 0.029% | 0.029% |
| 324 | 17 | 8 | 7517819 | 7517819 | G | A | R282W | COSM10704 | 51 | 86090 | 0.059% | N.D. |
| 335 | 17 | 7 | 7518264 | 7518264 | G | C | R248G | COSM11564 | 245 | 218077 | 0.11% | N.D. |
| 338 | 17 | 7 | 7518264 | 7518264 | G | A | R248W | COSM10656 | 188 | 51001 | 0.37% | N.D. |
Supplementary Material
ACKNOWLEDGEMENTS
We thank Amy Schmidt, Dr. Brandon McKethan (BIO-RAD), and Dr. Raymond Miller (BIO-RAD) for technical assistance and Kevin Odell and Jackie Tucker-Davis for animal care. We thank Dr. Paul Goodfellow and Jennifer Ivanovich for providing peripheral blood leukocyte genomic DNA from cancer-free individuals. This work was supported by NIH grants PO1 CA101937 (DCL) and U54 HG003079 (RKW) and by a grant from the Leukemia & Lymphoma Society (DCL).
Footnotes
Supplementary Information is linked to the online version of the paper at www.nature.com/nature.
AUTHOR CONTRIBUTIONS TNW and GR designed and performed the research, analyzed the data, and wrote the manuscript. ALY and TD developed and optimized the amplicon-based random primer sequencing assay. CAM, DS, JH, RSF, LD, ERM, and RKW contributed to the generation and analysis of the whole genome or targeted sequencing. WT, TL, SH, JDK, and PW collected and processed clinical data and tissue samples. JDB performed statistical analyses of the clinical data. JSW, JFD, MJW, TAG, and TJL provided contributed to data analysis. DCL supervised all of the research and edited the manuscript, which was approved by all co-authors.
AUTHOR INFORMATION Sequence information on the 22 t-AML WGS patients has been submitted to dbGaP (pending). The Authors declare no competing financial interests.
REFERENCES
- 1.Godley LA, Larson RA. Therapy-related myeloid leukemia. Semin Oncol. 2008;35:418–429. doi: 10.1053/j.seminoncol.2008.04.012. [DOI] [PMC free article] [PubMed] [Google Scholar]
- 2.Christiansen DH, Andersen MK, Pedersen-Bjergaard J. Mutations with loss of heterozygosity of p53 are common in therapy-related myelodysplasia and acute myeloid leukemia after exposure to alkylating agents and significantly associated with deletion or loss of 5q, a complex karyotype, and a poor prognosis. J Clin Oncol. 2001;19:1405–1413. doi: 10.1200/JCO.2001.19.5.1405. [DOI] [PubMed] [Google Scholar]
- 3.Shih AH, et al. Mutational analysis of therapy-related myelodysplastic syndromes and acute myelogenous leukemia. Haematologica. 2013;98:908–912. doi: 10.3324/haematol.2012.076729. [DOI] [PMC free article] [PubMed] [Google Scholar]
- 4.Kayser S, et al. The impact of therapy-related acute myeloid leukemia (AML) on outcome in 2853 adult patients with newly diagnosed AML. Blood. 2011;117:2137–2145. doi: 10.1182/blood-2010-08-301713. [DOI] [PubMed] [Google Scholar]
- 5.Link DC, et al. Identification of a novel TP53 cancer susceptibility mutation through whole-genome sequencing of a patient with therapy-related AML. JAMA. 2011;305:1568–1576. doi: 10.1001/jama.2011.473. [DOI] [PMC free article] [PubMed] [Google Scholar]
- 6.Genomic and epigenomic landscapes of adult de novo acute myeloid leukemia. N Engl J Med. 2013;368:2059–2074. doi: 10.1056/NEJMoa1301689. [DOI] [PMC free article] [PubMed] [Google Scholar]
- 7.Walter MJ, et al. Clonal architecture of secondary acute myeloid leukemia. N Engl J Med. 2012;366:1090–1098. doi: 10.1056/NEJMoa1106968. [DOI] [PMC free article] [PubMed] [Google Scholar]
- 8.Walter MJ, et al. Clonal diversity of recurrently mutated genes in myelodysplastic syndromes. Leukemia. 2013;27:1275–1282. doi: 10.1038/leu.2013.58. [DOI] [PMC free article] [PubMed] [Google Scholar]
- 9.Ding L, et al. Clonal evolution in relapsed acute myeloid leukaemia revealed by whole-genome sequencing. Nature. 2012;481:506–510. doi: 10.1038/nature10738. [DOI] [PMC free article] [PubMed] [Google Scholar]
- 10.Petitjean A, et al. Impact of mutant p53 functional properties on TP53 mutation patterns and tumor phenotype: lessons from recent developments in the IARC TP53 database. Hum Mutat. 2007;28:622–629. doi: 10.1002/humu.20495. [DOI] [PubMed] [Google Scholar]
- 11.Welch JS, et al. The origin and evolution of mutations in acute myeloid leukemia. Cell. 2012;150:264–278. doi: 10.1016/j.cell.2012.06.023. [DOI] [PMC free article] [PubMed] [Google Scholar]
- 12.Catlin SN, Busque L, Gale RE, Guttorp P, Abkowitz JL. The replication rate of human hematopoietic stem cells in vivo. Blood. 2011;117:4460–4466. doi: 10.1182/blood-2010-08-303537. [DOI] [PMC free article] [PubMed] [Google Scholar]
- 13.Carvajal LA, Manfredi JJ. Another fork in the road--life or death decisions by the tumour suppressor p53. EMBO Rep. 2013;14:414–421. doi: 10.1038/embor.2013.25. [DOI] [PMC free article] [PubMed] [Google Scholar]
- 14.Chen X, Ko LJ, Jayaraman L, Prives C. p53 levels, functional domains, and DNA damage determine the extent of the apoptotic response of tumor cells. Genes Dev. 1996;10:2438–2451. doi: 10.1101/gad.10.19.2438. [DOI] [PubMed] [Google Scholar]
- 15.Purvis JE, et al. p53 dynamics control cell fate. Science. 2012;336:1440–1444. doi: 10.1126/science.1218351. [DOI] [PMC free article] [PubMed] [Google Scholar]
- 16.Zhang XP, Liu F, Cheng Z, Wang W. Cell fate decision mediated by p53 pulses. Proc Natl Acad Sci U S A. 2009;106:12245–12250. doi: 10.1073/pnas.0813088106. [DOI] [PMC free article] [PubMed] [Google Scholar]
- 17.Zhang XP, Liu F, Wang W. Two-phase dynamics of p53 in the DNA damage response. Proc Natl Acad Sci U S A. 2011;108:8990–8995. doi: 10.1073/pnas.1100600108. [DOI] [PMC free article] [PubMed] [Google Scholar]
- 18.Hollstein M, Sidransky D, Vogelstein B, Harris CC. p53 mutations in human cancers. Science. 1991;253:49–53. doi: 10.1126/science.1905840. [DOI] [PubMed] [Google Scholar]
- 19.Kandoth C, et al. Mutational landscape and significance across 12 major cancer types. Nature. 2013;502:333–339. doi: 10.1038/nature12634. [DOI] [PMC free article] [PubMed] [Google Scholar]
- 20.Bondar T, Medzhitov R. p53-mediated hematopoietic stem and progenitor cell competition. Cell Stem Cell. 2010;6:309–322. doi: 10.1016/j.stem.2010.03.002. [DOI] [PMC free article] [PubMed] [Google Scholar]
- 21.Marusyk A, Porter CC, Zaberezhnyy V, DeGregori J. Irradiation selects for p53-deficient hematopoietic progenitors. PLoS Biol. 2010;8:e1000324. doi: 10.1371/journal.pbio.1000324. [DOI] [PMC free article] [PubMed] [Google Scholar]
- 22.Greaves M, Maley CC. Clonal evolution in cancer. Nature. 2012;481:306–313. doi: 10.1038/nature10762. [DOI] [PMC free article] [PubMed] [Google Scholar]
- 23.Birch JM, et al. Relative frequency and morphology of cancers in carriers of germline TP53 mutations. Oncogene. 2001;20:4621–4628. doi: 10.1038/sj.onc.1204621. [DOI] [PubMed] [Google Scholar]
- 24.Casas-Selves M, Degregori J. How cancer shapes evolution, and how evolution shapes cancer. Evolution (N Y) 2011;4:624–634. doi: 10.1007/s12052-011-0373-y. [DOI] [PMC free article] [PubMed] [Google Scholar]
- 25.Mardis ER, et al. Recurring mutations found by sequencing an acute myeloid leukemia genome. N Engl J Med. 2009;361:1058–1066. doi: 10.1056/NEJMoa0903840. [DOI] [PMC free article] [PubMed] [Google Scholar]
- 26.Li H, Durbin R. Fast and accurate short read alignment with Burrows-Wheeler transform. Bioinformatics. 2009;25:1754–1760. doi: 10.1093/bioinformatics/btp324. [DOI] [PMC free article] [PubMed] [Google Scholar]
- 27.Li H, et al. The Sequence Alignment/Map format and SAMtools. Bioinformatics. 2009;25:2078–2079. doi: 10.1093/bioinformatics/btp352. [DOI] [PMC free article] [PubMed] [Google Scholar]
- 28.Larson DE, et al. SomaticSniper: identification of somatic point mutations in whole genomesequencing data. Bioinformatics. 2012;28:311–317. doi: 10.1093/bioinformatics/btr665. [DOI] [PMC free article] [PubMed] [Google Scholar]
- 29.McKenna A, et al. The Genome Analysis Toolkit: a MapReduce framework for analyzing next-generation DNA sequencing data. Genome Res. 2010;20:1297–1303. doi: 10.1101/gr.107524.110. [DOI] [PMC free article] [PubMed] [Google Scholar]
- 30.Ye K, Schulz MH, Long Q, Apweiler R, Ning Z. Pindel: a pattern growth approach to detect break points of large deletions and medium sized insertions from paired-end short reads. Bioinformatics. 2009;25:2865–2871. doi: 10.1093/bioinformatics/btp394. [DOI] [PMC free article] [PubMed] [Google Scholar]
- 31.Chen K, et al. BreakDancer: an algorithm for high-resolution mapping of genomic structuralvariation. Nat Methods. 2009;6:677–681. doi: 10.1038/nmeth.1363. [DOI] [PMC free article] [PubMed] [Google Scholar]
- 32.Koboldt DC, et al. VarScan 2: somatic mutation and copy number alteration discovery incancer by exome sequencing. Genome Res. 2012;22:568–576. doi: 10.1101/gr.129684.111. [DOI] [PMC free article] [PubMed] [Google Scholar]
- 33.Kinde I, Wu J, Papadopoulos N, Kinzler KW, Vogelstein B. Detection and quantification of rare mutations with massively parallel sequencing. Proc Natl Acad Sci U S A. 2011;108:9530–9535. doi: 10.1073/pnas.1105422108. [DOI] [PMC free article] [PubMed] [Google Scholar]
- 34.Schmitt MW, et al. Detection of ultra-rare mutations by next-generation sequencing. Proc Natl Acad Sci U S A. 2012;109:14508–14513. doi: 10.1073/pnas.1208715109. [DOI] [PMC free article] [PubMed] [Google Scholar]
- 35.Langmead B, Salzberg SL. Fast gapped-read alignment with Bowtie 2. Nat Methods. 2012;9:357–359. doi: 10.1038/nmeth.1923. [DOI] [PMC free article] [PubMed] [Google Scholar]
- 36.Thorvaldsdottir H, Robinson JT, Mesirov JP. Integrative Genomics Viewer (IGV): high-performance genomics data visualization and exploration. Brief Bioinform. 2013;14:178–192. doi: 10.1093/bib/bbs017. [DOI] [PMC free article] [PubMed] [Google Scholar]
- 37.Wickham H. ggplot2: Elegant Graphics for Data Analysis. Springer New; New York: 2009. [Google Scholar]
- 38.Bustin SA, et al. The MIQE guidelines: minimum information for publication of quantitativereal-time PCR experiments. Clin Chem. 2009;55:611–622. doi: 10.1373/clinchem.2008.112797. [DOI] [PubMed] [Google Scholar]
- 39.Hindson BJ, et al. High-throughput droplet digital PCR system for absolute quantitation of DNA copy number. Anal Chem. 2011;83:8604–8610. doi: 10.1021/ac202028g. [DOI] [PMC free article] [PubMed] [Google Scholar]
Associated Data
This section collects any data citations, data availability statements, or supplementary materials included in this article.


