

Summary
Specific cellular fates and functions depend on differential gene expression, which occurs primarily at the transcriptional level, controlled by complex regulatory networks of transcription factors. Transcription factors act through combinatorial interactions with other transcription factors, co-factors and chromatin-remodelling proteins. We present a study of 459 Drosophila melanogaster transcription related factors, defining protein-protein interactions using a co-affinity purification mass spectrometry methodology, representing approximately half of the established catalogue of transcription factors. We probe this network in vivo, demonstrating functional interactions for many interacting proteins testing the predictive value for our data set. Building on these analyses, we combine regulatory network inference models with physical interactions to define an integrated network, connecting combinatorial transcription factor protein interactions to the transcriptional regulatory network of the cell. We use this integrated network as a tool to connect the functional network of genetic modifiers related to mastermind, a transcriptional co-factor of the Notch pathway.
Keywords: Drosophila, Transcription Factor, Interactome
Graphical Abstract

Introduction
As the targets of signalling pathways and the focal point of gene regulatory networks, transcription factors (TFs) represent a crucial point of regulation relating to the vast majority of cellular processes. As a rule, TFs function through interactions with a wide range of proteins including other TFs, cofactors, and chromatin modifiers (D'Alessio et al., 2009, Grove and Walhout 2008, Naar et al., 2001, Spitz and Furlong 2012). The biological activity of each TF depends upon these protein interactions, which ultimately govern DNA-binding affinity, activation of chromatin remodelling, and DNA binding sequence specificity (Siggers et al., 2011, Slattery et al., 2011). Given the importance of the cooperative action of TFs, defining their protein interaction profile is essential for understanding the regulation of cellular gene expression.
Several studies over the last decade have made inroads toward defining the Drosophila protein “interactome” (Giot et al., 2003, Guruharsha et al., 2011, Stanyon et al., 2004). While these studies defined large networks of protein-protein interactions (PPI), TFs are largely under-represented in these data sets, likely because the protein preparations (whole cell extracts) used for those studies were biased against nuclear proteins. Other studies have taken advantage of two-hybrid screening strategies to focus on TF-TF interactions in both Caenorhabditis elegans and in mammals (Grove et al., 2009, Ravasi et al., 2010) identifying a large number of novel connections between TFs. However only a small portion of the entire TF interactome has been examined and, by experimental design, reveal only TF pairs in isolation not taking into account the large repertoire of protein interactions between TFs and other non-TF proteins.
Alternative approaches in exploring the TF interactome included interaction predictions based on co-expression (Adryan and Teichmann 2010, Suzuki et al., 2009, Tomancak et al., 2007) or combined multiple TF occupancy studies (Cole et al., 2008, Lee et al., 2006, Mathur et al., 2008, Roy et al., 2010). In each case, direct interactions must still be confirmed through additional experimental means. Furthermore, TF occupancy studies treat each TF in isolation and it has been estimated that only 10-25% of bound DNA sites in higher eukaryotes result in expression changes of the cognate targets (Spitz and Furlong 2012). Given the combinatorial nature of TFs and the absence of general rules for their incorporation into protein complexes, systematically defining their interactions would help explain the disconnect between physical binding and functional output, and would contribute substantially in our understanding of gene regulatory networks in the cell.
Toward this goal, we interrogated the protein interaction network of Drosophila TFs using a co-affinity purification/mass spectrometry (co-AP/MS) platform. The vast majority of edges in our network are novel, representing new avenues for investigation. As a proof of principle, we used this PPI framework to predict and validate proteins that function in vivo in the Notch signalling network. Building on large-scale expression data sets from modENCODE, we defined tissue-specific PPI networks, addressing the importance of TFs in tissue specification. Our PPI network is also integrated with learned regulatory network inference models to create an integrated regulatory network that is linked directly to TF protein complexes. The resulting network enables us to bridge the gap between our physical PPI data and functional data sets, which we demonstrate by connecting genetic modifiers identified in a genome-wide screen for mastermind, a Notch transcriptional co-activator. As regulatory programs are often conserved across species (Erwin and Davidson 2009), these analyses provide a universal framework from which to interrogate the biology of TFs and their targets.
Results
Drosophila Transcription Factor Protein Interaction Networks
Transcription factors are defined as proteins that bind specific sequences of DNA and either activate or repress transcription. They are customarily defined by the presence of one or more sequence-specific DNA binding domains, falling into several families depending on the type of DNA binding domain present (Adryan and Teichmann 2006, Babu et al., 2004, Reece-Hoyes et al., 2005). Of the 14,000 protein-coding genes in the Drosophila genome, approximately 708 are transcription factors with characterized DNA-binding domains (Hammonds et al., 2013). We surveyed the literature and gathered a list of 996 genes, containing TFs with characterized binding domains, computationally predicted (putative) TFs, chromatin-related proteins and transcriptional machinery components (Adryan and Teichmann 2006, Pfreundt et al., 2010) (Table S1). We obtained FLAG-HA tagged clones encoding 668 of these proteins from the Universal Proteomics Resource (Yu et al., 2011) (http://fruitfly.org/EST/proteomics/shtml), a part of the Berkeley Drosophila Genome Project (BDGP).
These clones were transiently transfected into Drosophila S2R+ cells and nuclear extracts were generated, allowing us to address TF interactions specifically in the context of the nucleus. Protein complexes were isolated using single-step affinity purification, fragmented with trypsin, and analyzed by high-pressure liquid chromatography followed by tandem mass spectrometry (LC/MS/MS). Approximately 80% of the transfected clones were expressed successfully, as their unique cognate peptides were detected by LC/MS/MS. Across all experiments, we recovered 2,065 proteins with a 2.27% false discovery rate (FDR) from 468 individual affinity purifications (Table S2). This represents approximately one-third of the expressed S2R+ proteome, based on transcriptome and whole proteome analyses (Cherbas et al., 2011, Guruharsha et al., 2011). From these raw data, we identified 3407 binary TF-TF interactions, as well as interaction data for 72 chromatin-related proteins and 327 TFs with characterized DNA binding domains (Table S2).
We subsequently filtered our data using the HyperGeometric Spectral Counts scoring method (Guruharsha et al, 2011) (HGSCore), taking into account only bait-prey interactions to focus the network specifically on TF interactions and to decrease network noise. In total, 174,561 interactions between the 2,065 identified proteins were analyzed and scored. These scored interactions were filtered to a false discovery rate of 2%, based on the use of random datasets, leading to a high-confidence network containing 647 proteins of which 229 (35%) are characterized TFs (Figure 1, Data S1, Table S3). This interaction network shows a group of 406 proteins (63%) as the giant component of the network with a second group of 241 proteins in smaller, independent protein complexes. Of particular interest, 39% (253) of the proteins in the high-confidence network have no previous functional annotation or are annotated only in silico (by inferred electronic annotation) thus our map provides direct physical evidence for the functions of these previously uncharacterized proteins. We next analyzed these high-confidence interactions using the Markov clustering algorithm (MCL) (Enright et al., 2002), defining 171 putative protein complexes (Table S3).
Figure 1. Drosophila Transcription Factor Interaction Network.

High-confidence interaction network map representing interactions involving 229 site-specific transcription factors (Red nodes). The network contains 647 proteins connected by 624 edges. 117 putative protein complexes were defined using MCL clustering (Enright et al., 2002) (Table S3). 9.46% of interactions are binary TF-TF interactions, 21.79% are nonTF-nonTF interactions, and 68.75% are interactions between a TF and a nonTF protein. Protein interactions are shown as grey lines, with line thickness proportional to the HGScore for the interaction and inter-complex interactions shown in light grey. A number of previously characterized protein complexes have been labelled.
TF Network Quality Assessment
As with previous large-scale protein interaction studies, defining a reference set of positive interactions has been difficult due to the small degree of overlap between existing data sets and the lack of a high-quality manually curated set of interactions for Drosophila, such as in yeast (Yu et al., 2008). We utilized the Drosophila Interactions Database (Murali et al., 2011) (DroID), which contains protein interaction data from nine discrete sources, including recently published large-scale data sets (Friedman et al., 2011, Guruharsha et al., 2011). 18.4% of our high-confidence network overlaps with interactions in DroID with a p-value of <0.001 (Table S4).
We recovered a number of well-characterized complexes such as RNA polymerase II, Polycomb Repressive Complex 2 and the extradenticle-homothorax transcription factor complex (exd-hth), among others (Figure 1) and examined several of these complexes in light of existing interaction data (Figure 2). First, achintya (achi) and vismay (vis), two homeobox containing TFs, have been shown to interact with one another to play an essential role in Drosophila spermatogenesis, forming a complex with two meiotic arrest genes, always early (aly) and cookie monster (comr) (Wang and Mann 2003). Despite their role in spermatogenesis, both genes are expressed across multiple stages in development in both sexes, suggesting additional roles for these TFs. As our analysis was performed in an embryonically derived, macrophage-like cell line, it may not be surprising that we do not recover interactions with aly and comr. Nevertheless, we recovered a previously identified interaction between achi-vis and CG15445, a protein with unknown function (Figure 2A). In addition, our analysis identified novel interactions with four additional unstudied proteins, providing targets for future work.
Figure 2. TF Protein complexes.

Interactions identified in our TF study are marked in red, while blue edges represent interactions from the DroID database. (A) achintya and vismay protein complex. Previously identified interactions between achi, vis and CG15445 are recovered. Novel interactions with CG34179, CG6568, CG6540 and CG17272 represent targets for functional studies. (B) Su(Hw) protein complex. Known interactions with Cp190 and mod(mdg)4 are recovered. An interaction between CG8436 and Cp190 connects a novel interactor to the known Su(Hw) protein complex.
We also examined the protein interactions related to suppressor of Hairy wing (Su(Hw)), a zinc-finger containing C2H2 protein that is essential for gypsy insulator function and the development of the female germ line (Figure 2B). Su(Hw) functions through the recruitment of Centrosomal Protein 190 kD (Cp190) and Modifier of mdg4 (mod(mdg)4) (Georgiev and Kozycina 1996, Pai et al., 2004). We recovered these interactions in our experiments, confirming the interactions described previously. Furthermore, we recovered an interaction with CG8436, a protein of unknown function that has been previously shown to interact with Cp190 (Guruharsha et al., 2011), suggesting a Su(Hw) related role and providing additional evidence for the validity of this particular interaction.
As an additional means of quality control, outlined in the subsequent section, we performed a genetic screen looking specifically at Drosophila proteins that physically interact, according to our data, with known genetic modifiers of the Notch transcription co-activator, mastermind (mam). When tested in vivo, we recovered functional genetic interactions more frequently compared to random screening. This not only validates a number of our physical interactions functionally, but also demonstrates predictive value for our protein-protein interaction data with regard to biological function.
It is important to emphasize that demonstrating the high quality of our data presents a unique challenge due to the lack of a “gold standard” reference set of PPI interactions in Drosophila to compare our data with, and the fact that 39% of the proteins in our network are otherwise unstudied. As such, we have used rigorous, established statistical methods to define interactions, leaning heavily on strict statistical cut-offs to limit the number of false-positive interactions in our high-confidence interaction network. The recovery of well-characterized protein complexes, and as outlined in the following section, our ability to functionally validate in vivo relationships predicted by our proteomic data, indicate that the network we generated is reliable.
Functional Validation of the TF Interaction Network
An essential aspect of PPI networks is their utility in predicting biological function and generating hypotheses. We tested predictions from our interactions in vivo, specifically focusing our efforts on the Notch pathway, a conserved fundamental signalling mechanism broadly controlling cell fates in development in metazoans (Artavanis-Tsakonas et al., 1999). In a previous report, genome-wide genetic modifier studies of a dominant-negative allele of mam, a Notch transcriptional co-activator (Kankel et al., 2007), identified 408 genes that genetically interact with mam, recovering genetic modifiers in 4% of genes screened. This particular screen utilized the Exelixis collection, a transposon-induced mutant collection with insertions in just over half of all genes in the Drosophila genome (Thibault et al., 2004, Parks et al., 2004).
With a simple guilt-by-association hypothesis that proteins that interact often share function, we mapped these previously identified genetic modifiers onto our interaction data and identified 88 proteins that physically interact with mam modifiers that had not been identified as Notch signal modifiers before (Table S5). To interrogate these 88 genes functionally, we obtained transgenic RNAi alleles under UAS control and crossed them to a dominant-negative C-terminal mam truncation driven in the developing wing 1/2C96-GAL4, UAS-MamN (C96-MamN) (Helms et al., 1999, Kankel et al., 2007, Kitagawa et al, 2001, Wu et al., 2000). We recovered genetic interactions in 35% of our crosses (Figure 3A-H) representing a seven-fold increase when compared to a random screening, demonstrating clear predictive power for our protein-protein interaction data.
Figure 3. mastermind genetic screen.

(A) Wild type fly wing (B) dominant negative mam (c96-mamN) phenotype (C, E, G) enhancer phenotypes seen with loss of gfzf, Cdk12 and ct. (D, F, H) suppressor phenotypes seen with loss of NELF-B, Poxn, and C15. Note the presence of patches of wild type wing margin. (I) Interactions between previously identified mam modifiers and the Notch target gene, ct. Red nodes represent transcription factors.
One of the biggest challenges with interpreting genetic screens is in understanding how disparate genes that modify the same pathway are related to one another at a mechanistic level. In one instance, we found that five previously characterized modifiers of the mam phenotype — simj, Lim1, CG11334, fd68A and CG34417 — though previously unlinked to one another, physically interact with cut (ct), a transcriptional target of the Notch pathway. ct itself is a TF that was also shown to interact with mam in our genetic screen (Figure 3I). As three of the interacting proteins are TFs (the other two are unstudied), this strongly suggests that their functional connection to the Notch signalling pathway may be mediated through TF-TF interactions with ct.
Tissue-Specific Interaction Networks
As a general rule, we expect that proteins that interact are expressed in the same place at the same time. To examine co-expression and tissue specificity of proteins in our interaction network, we integrated our PPI network with RNA-seq data from the modENCODE project spanning 29 tissues and developmental time points (Graveley et al., 2011, Smibert et al., 2011). This type of integration between PPI and expression data sets has been used previously to infer both network dynamics and to identify functional modules within PPI networks (Lin et al., 2010, Przytycka et al., 2010, Tang et al., 2011). While TFs are often discussed in the context of conferring tissue specificity, a significant proportion of Drosophila TFs are expressed ubiquitously at some point during embryonic development (Hammonds et al., 2013, Tomancak et al., 2007) and most exhibit a broad pattern of expression in the adult animal (Adryan and Teichmann 2010). TFs that show tissue specificity embryonically are usually not limited to a single tissue, but rather a narrow range of expression in several tissues. These findings suggest that it is not only the presence of a specific TF that defines a particular tissue, but also the interactions of these TFs that establish tissue identity.
All proteins in our network were scored using tissue specificity score (TSPS) (Ravasi et al., 2010). The distribution of TSPS-scored proteins revealed three categories of expression, one representing broad or “general” expression across tissues, a group with high or “specific” tissue specificity, and a middle group exhibiting expression across several tissues (Figure 4A). Low TSPS proteins, representing broad expression, were assembled into a “core” network of 128 interactions which, based on their ubiquitous expression, are likely to be present across many tissues. We then focused on the group of high scoring TSPS proteins, utilizing an outlier method (Kadota et al., 2003) to assign each protein to specific tissues (Table S6). We combined these high-specificity proteins with our “core” network to build 24 different tissue-specific interaction networks (Data S2).
Figure 4. Tissue Specific Protein Complexes.

(A) Tissue specificity distribution for all proteins in the high-confidence interaction network scored using the tissue specificity score algorithm11. Low-specificity proteins are labelled in green, moderate specificity proteins are labelled in yellow and high-specificity proteins in blue. Distribution was fit to a trimodal distribution and bins were defined with cut-offs of 0.4781 and 1.1741. (B) Testis-specific protein complex. Rounded squares represent “core” network proteins, while blue circles represent “specific” proteins. CG8117 is an ortholog of a human testis-specific transcription elongation factor, also expressed specifically in the Drosophila testis. The other Polymerase II components are expressed broadly. (C) Larval CNS specific protein complex. Nerfin-1 is highly specific to the larval CNS. It interacts with two low-specificity proteins, the transcription factor sd and the transcription co-activator yki.
Two very different protein complexes are illustrative of the value of this tissue-specificity analysis, one specific to the testis and another to the larval central nervous system (Figure 4B,C). The first complex is centered on an unnamed protein CG8117, which according to our results is a part of the RNA polymerase II complex, connected, in our map, through 8 physical edges (Figure 4B). CG8117 is electronically inferred to have transcription regulatory activity and to bind both zinc ions and nucleic acids. It is expressed at high levels in the adult testis, but is largely absent from other tissues (Chintapalli et al., 2007). Outside of large-scale screens, CG8117 has not been independently studied in Drosophila. However, the human ortholog of this protein, TCEA2, has been characterized to be a testis-specific transcription factor (Weaver and Kane 1997), suggesting that this gene could play a similar tissue-specific role in Drosophila.
The second protein complex we wish to highlight, links two TFs, nervous fingers 1 (nerfin-1) and scalloped (sd) to the transcriptional co-activator yorkie (yki) (Figure 4C). sd is expressed in the developing nervous system, where it is essential for development of the sensory organs (Campbell et al., 1992). nerfin-1 has been shown to be important for axon guidance during early CNS development (Kuzin et al., 2005). yki is the Drosophila ortholog of the human protein YAP and is a transcriptional co-activator that functions in the hippo-yap pathway and has been previously shown to interact with sd (Goulev et al., 2008). It has also been suggested that nerfin-1 is a binding partner of sd (Garg et al., 2007 Abstract). Both nerfin-1 and sd are expressed in a highly specific manner in the larval CNS and given their established importance in CNS development, and their physical interaction in our map, we can formulate the hypothesis that they work together to regulate CNS development, possibly in tandem with the co-activator yki.
Combinatorial Targets of Interacting Transcription Factors
Given the importance of combinatorial TF interactions in gene regulation, we compared the in vitro protein-protein interaction data to in vivo DNA binding data for all protein pairs for which genome-wide ChIP data was available (Table S7). We identified multiple pairs where the protein-protein interactions and regulatory factor co-binding are consistent with the existing literature. For example, we observed an interaction between ecdysone receptor (EcR) and ultraspiracle (USP), which are the two proteins that comprise the complete ecdysone receptor; upon ligand binding, EcR-USP are activated and coordinately regulate genes including Eip75B and DHR3 (Yao et al., 1993) (Figure 5A). We also recovered an interaction between polycomblike (Pcl) and enhancer of zeste (E(z)), two proteins that are members of the polycomblike-polycomb repressive complex 2 (Pcl-PRC2; Figure 5B), as well an interaction between the segment polarity gene engrailed (en) and the co-repressor groucho (gro) (Figure 5C) (Hittinger and Carroll 2008).
Figure 5. Combinatorial targets of interacting TFs.

Shared physical targets of interacting TF pairs. Enriched gene ontology terms for shared targets are delineated in red. (A) ecdysone receptor (EcR) and ultraspiracle (usp) comprise the two parts of the complete Ecdysone receptor. They co-occupy 93 shared targets during pupal stages. (B) Polycomblike (Pcl) and Enhancer of zeste (E(z)), two members of the Pcl-PRC2 complex. (C) engrailed (en) and groucho (gro). (D) tramtrack (ttk) and Trithoraxlike (Trl), two BTB/POZ domain containing proteins.
Beyond these well-characterized complexes, we found several examples of protein-protein interactions that are supported by co-localization on DNA. For instance, we observed an interaction between tramtrack (ttk) and Trithorax-like (Trl) (Figure 5D). Both are BTB/POZ (Br-C, ttk and bab/Pox virus and Zinc finger) domain containing proteins. This interaction has been identified previously in a large-scale yeast two-hybrid screen and in Drosophila S2 cells, providing additional evidence for this particular interaction (Pagans et al., 2002). ttk has been shown to function both as a transcriptional repressor and as an activator, playing a variety of roles including development of the nervous system, photoreceptor differentiation and in tracheal development (Araujo et al., 2007, Badenhorst 2001, Lai and Li 1999). Trl (also known as GAGA factor, or GAF) has been suggested to play a role in transcriptional activation through chromatin changes and in some cases, is necessary for transcriptional activation driven by some transcription factor complexes (Bayarmagnai et al., 2012, Granok et al., 1995). This raises the possibility that ttk activity is modulated through Trl interactions, likely playing a role in activation of gene expression of shared targets.
Inferred Regulatory Motifs for TF complexes
To gain insight into the regulatory consequences of the PPI in our network, we have integrated our results with existing inferred regulatory network models (Marbach et al., 2012). These inferred networks integrate a wide range of data sets, including TF binding, gene expression and chromatin modifications, utilizing supervised and unsupervised machine-learning frameworks to predict regulatory edges. These networks have been shown to be useful tools in predicting gene function (Marbach et al., 2012). It is important to note, however, that protein-protein interaction data were not included in the assembly of these particular networks. By integrating our PPI data with such transcriptional regulatory networks, we provide a new dimension to this analysis, gaining insight into the combinatorial action of interacting TFs by linking their regulatory edges directly to TF protein complexes.
To combine PPI with regulatory interaction and probe these large integrated networks, we defined a set of TF regulatory motifs based on physical and regulatory interactions (Figure 6A, Table S8). These three motifs represent instances where (1) An interacting protein is regulated by its binding partner; (2) Where two interacting proteins regulate the same target; and (3) a single factor regulates interacting proteins. Each instance of each of these motifs essentially defines a biological hypothesis, representing an avenue for future inquiry.
Figure 6. Inferred Regulatory Edges for Transcriptional Complexes.

(A) Transcriptional regulatory motifs, representing instances where an interacting protein regulates its binding partner (1:1), combinatorial regulation of a target by two interacting factors (2:1), and regulation of interacting proteins by a single factor (1:2). Red edges indicate protein-protein interactions while grey edges with arrows indicate directional regulatory edges. (B) The components of the Drosophila dREAM complex recovered in our interaction network. (C) Transcriptional regulators of Dp-E2f (D) Basal Transcription Machinery components (E) Cell Cycle Proteins (F) DNA Replication Related Proteins (G) Transcription (H) Chromatin Related (I) Unannotated targets of Dp/E2f.
By permuting the edges of both our high confidence PPI network and the inferred regulatory networks independently, we confirmed that these motifs are significantly more frequent than expected by chance (Figure 6A). Furthermore, as we have demonstrated the predictive power of the high-confidence interactions in our PPI network, focusing only on motifs containing one of our PPI edges effectively filters the regulatory network based on experimental evidence. These motifs were combined to build networks containing 22,781 edges between 3,145 proteins and 19,062 edges between 2,331 proteins, in supervised and unsupervised models respectively (Data S3).
Within the supervised model, we have highlighted the regulatory network related to Dp transcription factor and E2F, members of the dREAM (RBF, dE2F2, dMyb) complex (Figure 6B-I). The dREAM complex is conserved in most eukaryotes and plays multiple roles including the regulation of cell fates, cell division and apoptosis (van den Heuvel and Dyson 2008). Dp and E2f comprise a dimeric transcription factor that is important in the G1/S phase transition during the cell cycle, where E2f levels are rate-limiting for cell proliferation (Johnson et al., 1993).
Previous work has described interactions between E2f and Dp as well as Rbf, consistent with interactions revealed in our network (Frolov et al., 2001) (Figure 6B). Another component of the dREAM complex, Myb, acts in a mutually exclusive manner with Dp-E2f to regulate target selection(Georlette et al., 2007). Though we did not recover Myb as a physical interactor, it is one of only three proteins that are inferred to both regulate Dp-E2f and is in turn targeted by the TF pair. The other two proteins are MTA1-like and CG17385, which have not been tied to dREAM functions previously, thus defining targets for functional analyses (Figure 6B). As expected, downstream targets of Dp-E2f in our network include genes important for the cell cycle (Figure 6E) and DNA replication (Figure 6F).
The dREAM complex is thought to modulate transcription through the repressive binding of Rbf to E2f, through the inhibition of the basal transcription machinery and by recruiting chromatin-modifying proteins (Georlette et al., 2007). Our regulatory network reflects all three of these possibilities, showing a physical interaction between Rbf and E2f, the targeting of a number of basal transcriptional machinery components (Figure 6D), and the regulation of chromatin-modifying proteins such as brahma and MRG15 (Figure 6H). Other downstream targets of Dp-E2f in our network include a group largely enriched for transcription-related proteins (Figure 6G) and 28 targets that are not annotated (Figure 6I). Dp and E2f are themselves targeted by a cohort of TFs and cofactors including DREF, Mad and Trl (Figure 6C). Consequently, we have identified a well-characterized protein complex, a number of its known regulatory targets, and, most interestingly, targets that have not been previously linked to dREAM complex function, thereby defining new specific functional hypotheses.
Connecting functional networks
Genetic screens, especially in Drosophila, have been used as a powerful tool to define networks of proteins that share function (Fortini and Artavanis-Tsakonas 1994, Go and Artavanis-Tsakonas 1998, Sen et al., 2013, St Johnston 2002, Xu and Artavanis-Tsakonas 1990). One of the resulting difficulties is in understanding, at a mechanistic level, how these proteins are connected to one another. On the other end of the spectrum, PPI networks describe the physical relationships between proteins, but do not capture functional relationships. While there is some overlap between these two network types, not every functional relationship is the result of a direct protein-protein interaction. As such, the majority of network edges between these two data types do not typically overlap. By combining transcriptional regulatory networks with our PPI data, our integrated network allows us to bridge the gap between physical and functional relationships through defined regulatory edges, providing insight into the combinatorial regulation of targets by interacting TFs.
For an example, we once again focused on the genetic interaction network of mam, defined in a genome-wide screen in Drosophila (Kankel et al., 2007). From the 408 genes that were shown to interact genetically with mam, in vivo, our supervised and unsupervised integrated networks contain 140 and 103 of these modifiers respectively. If we examine direct relationships between these in our networks, 62 and 35 proteins are directly linked to one another (Figure 7A, B). If we expand this view to include first neighbor interactions, all mastermind modifiers in both instances are connected to one another.
Figure 7. Connecting the mastermind genetic network.
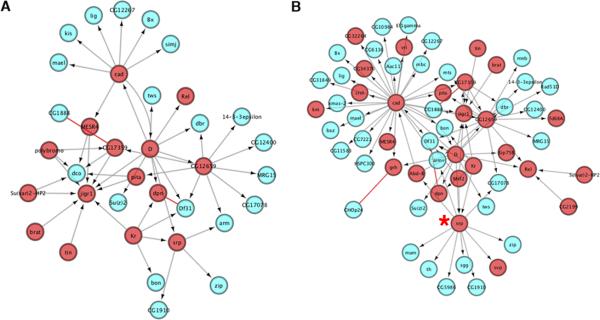
(A) Unsupervised network view of 35 mastermind modifiers. (B) Supervised network view of 62 mastermind modifiers. All nodes in interaction network are previously identified mastermind modifiers. Red nodes represent TFs. Blue nodes represent non-TF proteins. Red edges represent protein-protein interactions. Gray edges with arrows represent directional regulatory edges. The red asterisk indicates interactions related to serpent (srp).
The organization of these networks reveals several potential “hubs” of regulation, based on the total number of edges that connect to a particular node. For instance, the transcription factor serpent (srp) is connected by 12 separate network edges in our supervised network (Figure 7B). Though srp itself has not been demonstrated to be directly regulated by the Notch pathway, it has been previously shown to function upstream of direct Notch targets during Drosophila larval hematopoiesis (Duvic et al., 2002). This would suggest a potential mechanism by which loss of srp would modulate Notch activity downstream, thus explaining the genetic interaction between srp and mam. Interestingly, our network identifies mam as a direct target of srp.
While these regulatory edges will certainly vary depending on context, this approach provides a network of hypotheses linking functional data points to be used as the basis for probing the mechanisms that link these proteins. We expect, as more data become available, that these networks will be further refined and expanded to provide higher resolution insight into the mechanisms driving biological function. As things stand, our integrated networks provide a substantial foundation from which to explore the mechanisms that connect functional data sets.
Discussion
We present here a network analysis of TFs in Drosophila melanogaster, based on the determination of TF protein interactions determined by a co-affinity purification/mass spectrometry (co-AP/MS) approach. Our integrated analysis, in addition to protein-protein interactions for TFs, takes into account tissue-specific interaction sub-networks, candidate combinatorial gene targets and an integrated regulatory network approach from which to examine combinatorial transcriptional regulation and to probe functional data sets.
A considerable fraction of our interaction results are novel, yet we demonstrate the high quality of our findings by recovering previously identified interactions as well as through functional validation in vivo. Given the lack of a reference set of positive interactions based on a high-quality manually curated set of interactions for Drosophila, our interaction network is based on strict statistical cut-offs, which minimize false positives, but may also mask interactions of interest. It will therefore be important for those with an interest in a specific protein to examine our raw interaction data as many well-characterized interactions fell below our deliberately strict statistical cut-off. We acknowledge several limitations in our methods, in particular, the use of epitope-tagged fusion proteins expressed at non-physiological levels. While we cannot ignore that epitope tags in some cases will perturb protein folding and function, the recovery of previously characterized interactions, including those identified via alternative methods such as two-hybrid, provide additional evidence of the validity of our experimental pipeline. Furthermore, similar methods have been used successfully to identify confirmed interactions in a number of settings, including the human autophagy system and a proteome-wide analysis in Drosophila (Behrends et al., 2010, Guruharsha et al., 2011, Sowa et al., 2009).
Our tissue specific sub-networks emphasize the importance of context with regard to TF function. We have defined groups of proteins based on their broad or specific expression, and then connect these categories, providing insight into how general and specific TFs cooperate with one another to drive transcriptional programs. As has been suggested previously, it is likely that the presence of a particular TF protein interaction within a specific tissue, rather than the expression of a single tissue-specific TF, that confers tissue identity (Ravasi et al., 2010).
Building on the recent availability of large-scale genomic data sets from the modENCODE project and others, we focused on connecting the TF PPI network with the gene regulatory network of the cell. As previous work has shown, TFs do not function in isolation, nor does physical binding necessarily correlate to a change in gene expression (Spitz and Furlong 2012). It is the combination of various TFs and their interacting proteins that confers a specific activity and therefore, defined common physical targets between interacting sets of proteins. Indeed, we find multiple examples of protein interactions that are supported by the genome-wide DNA binding data (e.g., EcR-Usp, Pcl-E(z), and En-Gro), as well as interactions that warrant further exploration. Our data provide an extensive catalogue of physical interactions from which to probe function at the level of the complex.
We also connected TF protein complexes to the gene regulatory network using inferred regulatory edges, allowing us to expand target prediction beyond direct physical targets. We established the predictive value of the physical edges in our network and hence it is likely that this improves the quality of the inferred regulatory network as we have examined only edges that are directly linked to an experimentally validated physical interaction. The analysis of the Drosophila dREAM protein complex presented, including the identification of both characterized and novel targets is indicative of the utility of this integrated network.
Finally, we used our integrated networks to interrogate large-scale functional data sets. While genetic screens have been used for decades, connecting the large number of functional modifiers identified in these screens to one another has been a significant challenge. While Gene Ontology analysis certainly provides insight into the categorization of genes within these data sets, the complex relationships between these components are only captured from a network perspective. Our integrated network analysis provides a considerable framework from which to build hypotheses as to how various functionally connected proteins are related to one another.
We view our data as a framework for developing specific hypotheses for future studies in Drosophila and other metazoans. Given the conservation of regulatory programs, it is likely that many of the regulatory connections presented here will be preserved in other species, though possibly, and interestingly, used in different biological contexts. As transcription factors represent fundamental points of regulation in the cell, we expect the present work to be relevant to a broad spectrum of biological processes.
Experimental Procedures
Protein Expression and Purification
C-terminal FLAG-HA tagged transcription factor clones in the pMK33-CFH-BD vector were acquired from the Berkeley Drosophila Genome Project (Yu et al., 2011). Each clone was transiently transfected into two 54 ml cultures of Drosophila S2R+ cells using Effectene (Qiagen), and subsequently cultured in Schneider's media with 10% Fetal Bovine Serum. Twenty-four hours post-transfection, gene expression was induced with 0.35 mM CuSO4 and cells were harvested 24 hours after induction (Veraksa et al., 2005). Nuclear extracts were prepared as previously described with the exception that cells were lysed using an 18-gauge syringe (Dignam et al., 1983). Nuclear extracts were diluted 1:1 with dialysis buffer (20 mM HEPES pH 7.6, 20% glycerol, 100 mM KCl, 2mM MgCl2, 0.1 mM EDTA, 1mM DTT, 0.25mM PMSF, and Roche Complete protease inhibitor) to reduce the overall salt concentration. Each extract was incubated with 40 uL of dimethyl pimelimidate cross-linked anti-HA immunoaffinity resin (Sigma) for three hours at 4°. Following incubation, the resin was washed twice with dialysis buffer followed by two PBS washes. Bound proteins were eluted using IgG Elution Buffer (ThermoPierce Scientific), 400 uL total divided into two separate five minute incubations performed at room temperature with gentle shaking. The elution was then neutralized with 52 uL 1M Tris pH 8.0.
Mass Spectrometry and Network Construction
Co-purified proteins were precipitated with trichloroacetic acid (TCA), followed by a 10% TCA wash and two acetone washes. The samples were then dried, digested overnight with trypsin, cleaned with c18 Stage Tips (Thermo Scientific), and analyzed by LCMS/MS on a linear ion trap quadrupole (Thermo Scientific) instrument. MS/MS spectra were searched with SEQUEST (Eng et al., 2008) against FlyBase release 5.41 and filtered to 2.27% protein FDR for the entire data set with the reverse database approach (Elias and Gygi 2007). Column carry-over between experiments was corrected with a statistical approach, incorporating peptide abundance and probability of consecutive observations. Following processing and filtering, the high-confidence TF interaction map was generated using the HGSCore method to distinguish specific interactions as described previously, but filtering out indirect prey-prey interactions to focus the network on the TF-interacting subspace. To draw the cut-off for interaction specificity and determine false discovery rate, we ran HGScore on 40 simulated data sets, randomly sampled from the real data set until convergence on a cut-off score resulting in a 2% FDR. This high-confidence interaction network was clustered using MCL (Enright et al., 2002) using an inflation value of 1.8.
Genetic Screen
Flies were cultured on standard media and crosses were carried out at 23°C. The C96-Gal4, UASMamN (C96-MamN) stocks were previously described (Helms et al., 1999). UAS-RNAi fly stocks were obtained from the TRiP collection at Harvard Medical School (NIH/NIGMRS R01-GM084947). Adult fly wings were dehydrated in isopropanol and mounted in a 3:1 dilution of CMCP-10 (Masters Company Inc, Wood Dale, IL) and lactic acid.
Tissue Specificity Analysis
The tissue specificity score was executed as previously described (Ravasi et al., 2010) utilizing 24 mRNA-sequencing datasets (Smibert et al., 2012), encompassing 24 groups containing various tissues dissected from Oregon R wild type flies. The distribution for all proteins based on their TSPS was fit to a tri-modal Gaussian distribution, identifying cutoff values of 0.4781 for low (general) specificity proteins, while the cut-off for high specificity (specific) was 1.17406. High specificity proteins, based on TSPS distribution were assigned to specific tissues using previously described methods (Kadota et al., 2003).
Chromatin-Immunoprecipitation Data
ChIP data were used from both the modENCODE project (Roy et al., 2010) and the Berkeley Drosophila Transcription Network Project (MacArthur et al., 2009). For published ChIP-chip and ChIP-seq datasets, filtered peaks were taken directly from the published analyses. New ChIP-seq datasets were generated as described (Roy et al., 2010) and analyzed through the Irreproducible Discovery Rate data analysis pipeline, described in detail here (https://sites.google.com/site/anshulkundaje/projects/idr).
Supplementary Material
Acknowledgements
This work was supported by a grant from the National Institutes of Health (NIH 5RO1HG003616) to S.A.T. Generation of the clone set was supported by a grant from the NHGRI (P41HG3487) to S.E.C. DYC and TMP were supported by the Intramural Research program of the National Institutes of Health, National Library of Medicine. Special thanks to Mark Kankel, Mat Sowa, Jean-Francois Rual and SAT lab members for helpful discussion and comments.
Footnotes
Publisher's Disclaimer: This is a PDF file of an unedited manuscript that has been accepted for publication. As a service to our customers we are providing this early version of the manuscript. The manuscript will undergo copyediting, typesetting, and review of the resulting proof before it is published in its final citable form. Please note that during the production process errors may be discovered which could affect the content, and all legal disclaimers that apply to the journal pertain.
References
- Adryan B, Teichmann SA. FlyTF: a systematic review of site-specific transcription factors in the fruit fly Drosophila melanogaster. Bioinformatics. 2006;22:1532–3. doi: 10.1093/bioinformatics/btl143. [DOI] [PubMed] [Google Scholar]
- Adryan B, Teichmann SA. The developmental expression dynamics of Drosophila melanogaster transcription factors. Genome biology. 2010;11:R40. doi: 10.1186/gb-2010-11-4-r40. [DOI] [PMC free article] [PubMed] [Google Scholar]
- Araujo SJ, Cela C, Llimargas M. Tramtrack regulates different morphogenetic events during Drosophila tracheal development. Development. 2007;134:3665–3676. doi: 10.1242/dev.007328. [DOI] [PubMed] [Google Scholar]
- Artavanis-Tsakonas S, Rand MD, Lake RJ. Notch signalling: cell fate control and signal integration in development. Science. 1999;284:770–776. doi: 10.1126/science.284.5415.770. [DOI] [PubMed] [Google Scholar]
- Babu MM, Luscombe NM, Aravind L, Gerstein M, Teichmann SA. Structure and evolution of transcriptional regulatory networks. Curr Opin Struct Biol. 2004;14:283–91. doi: 10.1016/j.sbi.2004.05.004. [DOI] [PubMed] [Google Scholar]
- Badenhorst P. Tramtrack controls glial number and identity in the Drosophila embryonic CNS. Development. 2001;128:4093–4101. doi: 10.1242/dev.128.20.4093. [DOI] [PubMed] [Google Scholar]
- Bayarmagnai B, Nicolay BN, Islam AB, Lopez-Bigas N, Frolov MV. Drosophila GAGA factor is required for full activation of the dE2f1-Yki/Sd transcriptional program. Cell Cycle. 2012;11:4191–4202. doi: 10.4161/cc.22486. [DOI] [PMC free article] [PubMed] [Google Scholar]
- Behrends C, Sowa ME, Gygi SP, Harper JW. Network organization of the human autophagy system. Nature. 2010;466:68–76. doi: 10.1038/nature09204. [DOI] [PMC free article] [PubMed] [Google Scholar]
- Campbell S, Inamdar M, Rodrigues V, Raghavan V, Palazzolo M, Chovnick A. The scalloped gene encodes a novel, evolutionarily conserved transcription factor required for sensory organ differentiation in Drosophila. Genes & development. 1992;6:367–379. doi: 10.1101/gad.6.3.367. [DOI] [PubMed] [Google Scholar]
- Cherbas L, Willingham A, Zhang D, Yang L, Zou Y, Eads BD, Carlson JW, Landolin JM, Kapranov P, Dumais J, et al. The transcriptional diversity of 25 Drosophila cell lines. Genome Res. 2011;21:301–14. doi: 10.1101/gr.112961.110. [DOI] [PMC free article] [PubMed] [Google Scholar]
- Chintapalli VR, Wang J, Dow JA. Using FlyAtlas to identify better Drosophila melanogaster models of human disease. Nat Genet. 2007;39:715–20. doi: 10.1038/ng2049. [DOI] [PubMed] [Google Scholar]
- Cole MF, Johnstone SE, Newman JJ, Kagey MH, Young RA. Tcf3 is an integral component of the core regulatory circuitry of embryonic stem cells. Genes & development. 2008;22:746–755. doi: 10.1101/gad.1642408. [DOI] [PMC free article] [PubMed] [Google Scholar]
- D'Alessio JA, Wright KJ, Tjian R. Shifting players and paradigms in cell- specific transcription. Molecular cell. 2009;36:924–931. doi: 10.1016/j.molcel.2009.12.011. [DOI] [PMC free article] [PubMed] [Google Scholar]
- Dignam JD, Lebovitz RM, Roeder RG. Accurate transcription initiation by RNA polymerase II in a soluble extract from isolated mammalian nuclei. Nucleic acids research. 1983;11:1475–1489. doi: 10.1093/nar/11.5.1475. [DOI] [PMC free article] [PubMed] [Google Scholar]
- Duvic B, Hoffmann JA, Meister M, Royet J. Notch signaling controls lineage specification during Drosophila larval hematopoiesis. Curr Biol. 2002;12:1923–7. doi: 10.1016/s0960-9822(02)01297-6. [DOI] [PubMed] [Google Scholar]
- Elias JE, Gygi SP. Target-decoy search strategy for increased confidence in large-scale protein identifications by mass spectrometry. Nature methods. 2007;4:207–214. doi: 10.1038/nmeth1019. [DOI] [PubMed] [Google Scholar]
- Eng JK, Fischer B, Grossmann J, Maccoss MJ. A fast SEQUEST cross correlation algorithm. Journal of proteome research. 2008;7:4598–4602. doi: 10.1021/pr800420s. [DOI] [PubMed] [Google Scholar]
- Enright AJ, Van Dongetn S, Ouzounis CA. An efficient algorithm for large-scale detection of protein families. Nucleic Acids Res. 2002;30:1575–1584. doi: 10.1093/nar/30.7.1575. [DOI] [PMC free article] [PubMed] [Google Scholar]
- Erwin DH, Davidson EH. The evolution of hierarchical gene regulatory networks. Nature reviews Genetics. 2009;10:141–148. doi: 10.1038/nrg2499. [DOI] [PubMed] [Google Scholar]
- Fortini ME, Artavanis-Tsakonas S. The suppressor of hairless protein participates in notch receptor signalling. Cell. 1994;79:273–282. doi: 10.1016/0092-8674(94)90196-1. [DOI] [PubMed] [Google Scholar]
- Friedman AA, Tucker G, Singh R, Yan D, Vinayagam A, Hu Y, Binari R, Hong P, Sun X, Porto M, et al. Proteomic and functional genomic landscape of receptor tyrosine kinase and ras to extracellular signal-regulated kinase signalling. Science signalling. 2011;4:rs10. doi: 10.1126/scisignal.2002029. [DOI] [PMC free article] [PubMed] [Google Scholar]
- Frolov MV, Huen DS, Stevaux O, Dimova D, Balczarek-Strang K, Elsdon M, Dyson NJ. Functional antagonism between E2F family members. Genes & development. 2001;15:2146–2160. doi: 10.1101/gad.903901. [DOI] [PMC free article] [PubMed] [Google Scholar]
- Georgiev P, Kozycina M. Interaction between mutations in the suppressor of Hairy wing and modifier of mdg4 genes of Drosophila melanogaster affecting the phenotype of gypsy-induced mutations. Genetics. 1996;142:425–36. doi: 10.1093/genetics/142.2.425. [DOI] [PMC free article] [PubMed] [Google Scholar]
- Georlette D, Ahn S, MacAlpine DM, Cheung E, Lewis PW, Beall EL, Bell SP, Speed T, Manak JR, Botchan MR. Genomic profiling and expression studies reveal both positive and negative activities for the Drosophila Myb MuvB/dREAM complex in proliferating cells. Genes & development. 2007;21:2880–2896. doi: 10.1101/gad.1600107. [DOI] [PMC free article] [PubMed] [Google Scholar]
- Giot L, Bader JS, Brouwer C, Chaudhuri A, Kuang B, Li Y, Hao YL, Ooi CE, Godwin B, Vitols E, et al. A protein interaction map of Drosophila melanogaster. Science. 2003;302:1727–1736. doi: 10.1126/science.1090289. [DOI] [PubMed] [Google Scholar]
- Go MJ, Artavanis-Tsakonas S. A genetic screen for novel components of the notch-signalling pathway during Drosophila bristle development. Genetics. 1998;150:211–220. doi: 10.1093/genetics/150.1.211. [DOI] [PMC free article] [PubMed] [Google Scholar]
- Goulev Y, Fauny JD, Gonzalez-Marti B, Flagiello D, Silber J, Zider A. SCALLOPED interacts with YORKIE, the nuclear effector of the hippo tumor-suppressor pathway in Drosophila. Current biology : CB. 2008;18:435–441. doi: 10.1016/j.cub.2008.02.034. [DOI] [PubMed] [Google Scholar]
- Granok H, Leibovitch BA, Shaffer CD, Elgin SC. Chromatin. Ga-ga over GAGA factor. Current biology : CB. 1995;5:238–241. doi: 10.1016/s0960-9822(95)00048-0. [DOI] [PubMed] [Google Scholar]
- Graveley BR, Brooks AN, Carlson JW, Duff MO, Landolin JM, Yang L, Artieri CG, van Baren MJ, Boley N, Booth BW, et al. The developmental transcriptome of Drosophila melanogaster. Nature. 2011;471:473–479. doi: 10.1038/nature09715. [DOI] [PMC free article] [PubMed] [Google Scholar]
- Grove CA, De Masi F, Barrasa MI, Newburger DE, Alkema MJ, Bulyk ML, Walhout AJ. A multiparameter network reveals extensive divergence between C. elegans bHLH transcription factors. Cell. 2009;138:314–327. doi: 10.1016/j.cell.2009.04.058. [DOI] [PMC free article] [PubMed] [Google Scholar]
- Grove CA, Walhout AJ. Transcription factor functionality and transcription regulatory networks. Molecular bioSystems. 2008;4:309–314. doi: 10.1039/b715909a. [DOI] [PMC free article] [PubMed] [Google Scholar]
- Guruharsha KG, Rual JF, Zhai B, Mintseris J, Vaidya P, Vaidya N, Beekman C, Wong C, Rhee DY, Cenaj O, et al. A protein complex network of Drosophila melanogaster. Cell. 2011;147:690–703. doi: 10.1016/j.cell.2011.08.047. [DOI] [PMC free article] [PubMed] [Google Scholar]
- Hammonds AS, Bristow CA, Fisher WW, Weiszmann R, Wu S, Hartenstein V, Kellis M, Yu B, Frise E, Celniker SE. Spatial expression of transcription factors in Drosophila embryonic organ development. Genome Biol. 2013;14(12):R140. doi: 10.1186/gb-2013-14-12-r140. [DOI] [PMC free article] [PubMed] [Google Scholar]
- Helms W, Lee H, Ammerman M, Parks AL, Muskavitch MA, Yedvobnick B. Engineered truncations in the Drosophila mastermind protein disrupt Notch pathway function. Developmental biology. 1999;215:358–374. doi: 10.1006/dbio.1999.9477. [DOI] [PubMed] [Google Scholar]
- Hittinger CT, Carroll SB. Evolution of an insect-specific GROUCHO- interaction motif in the ENGRAILED selector protein. Evolution & development. 2008;10:537–545. doi: 10.1111/j.1525-142X.2008.00269.x. [DOI] [PMC free article] [PubMed] [Google Scholar]
- Johnson DG, Schwarz JK, Cress WD, Nevins JR. Expression of transcription factor E2F1 induces quiescent cells to enter S phase. Nature. 1993;365:349–352. doi: 10.1038/365349a0. [DOI] [PubMed] [Google Scholar]
- Kadota K, Nishimura S, Bono H, Nakamura S, Hayashizaki Y, Okazaki Y, Takahashi K. Detection of genes with tissue-specific expression patterns using Akaike's information criterion procedure. Physiological genomics. 2003;12:251–259. doi: 10.1152/physiolgenomics.00153.2002. [DOI] [PubMed] [Google Scholar]
- Kankel MW, Hurlbut GD, Upadhyay G, Yajnik V, Yedvobnick B, Artavanis-Tsakonas S. Investigating the genetic circuitry of mastermind in Drosophila, a notch signal effector. Genetics. 2007;177:2493–2505. doi: 10.1534/genetics.107.080994. [DOI] [PMC free article] [PubMed] [Google Scholar]
- Kitagawa M, Oyama T, Kawashima T, Yedvobnick B, Kumar A, Matsuno K, Harigaya K. A human protein with sequence similarity to Drosophila mastermind coordinates the nuclear form of notch and a CSL protein to build a transcriptional activator complex on target promoters. Molecular and cellular biology. 2001;21:4337–4346. doi: 10.1128/MCB.21.13.4337-4346.2001. [DOI] [PMC free article] [PubMed] [Google Scholar]
- Kuzin A, Brody T, Moore AW, Odenwald WF. Nerfin-1 is required for early axon guidance decisions in the developing Drosophila CNS. Developmental biology. 2005;277:347–365. doi: 10.1016/j.ydbio.2004.09.027. [DOI] [PubMed] [Google Scholar]
- Lai ZC, Li Y. Tramtrack69 is positively and autonomously required for Drosophila photoreceptor development. Genetics. 1999;152:299–305. doi: 10.1093/genetics/152.1.299. [DOI] [PMC free article] [PubMed] [Google Scholar]
- Lee TI, Jenner RG, Boyer LA, Guenther MG, Levine SS, Kumar RM, Chevalier B, Johnstone SE, Cole MF, Isono K, et al. Control of developmental regulators by Polycomb in human embryonic stem cells. Cell. 2006;125:301–313. doi: 10.1016/j.cell.2006.02.043. [DOI] [PMC free article] [PubMed] [Google Scholar]
- Lin CC, et al. Dynamic functional modules in co-expressed protein interaction networks of dilated cardiomyopathy. BMC Syst Biol. 2010;4:138. doi: 10.1186/1752-0509-4-138. [DOI] [PMC free article] [PubMed] [Google Scholar]
- Marbach D, Roy S, Ay F, Meyer PE, Candeias R, Kahveci T, Bristow CA, Kellis M. Predictive regulatory models in Drosophila melanogaster by integrative inference of transcriptional networks. Genome research. 2012;22:1334–1349. doi: 10.1101/gr.127191.111. [DOI] [PMC free article] [PubMed] [Google Scholar]
- MacArthur S, Li XY, Brown JB, Chu HC, Zeng L, Grondona BP, Hechmer A, Simirenko L, Keranen SV, Knowles DW, et al. Developmental roles of 21 Drosophila transcription factors are determined by quantitative differences in binding to an overlapping set of thousands of genomic regions. Genome Biol. 2009;10:R80. doi: 10.1186/gb-2009-10-7-r80. [DOI] [PMC free article] [PubMed] [Google Scholar]
- Mathur D, Danford TW, Boyer LA, Young RA, Gifford DK, Jaenisch R. Analysis of the mouse embryonic stem cell regulatory networks obtained by ChIP-chip and ChIP-PET. Genome biology. 2008;9:R126. doi: 10.1186/gb-2008-9-8-r126. [DOI] [PMC free article] [PubMed] [Google Scholar]
- Murali T, Pacifico S, Yu J, Guest S, Roberts GG, 3rd, Finley RL., Jr. DroID 2011: a comprehensive, integrated resource for protein, transcription factor, RNA and gene interactions for Drosophila. Nucleic acids research. 2011;39:D736–743. doi: 10.1093/nar/gkq1092. [DOI] [PMC free article] [PubMed] [Google Scholar]
- Naar AM, Lemon BD, Tjian R. Transcriptional coactivator complexes. Annual review of biochemistry. 2001;70:475–501. doi: 10.1146/annurev.biochem.70.1.475. [DOI] [PubMed] [Google Scholar]
- Pagans S, Ortiz-Lombardia M, Espinas ML, Bernues J, Azorin F. The Drosophila transcription factor tramtrack (TTK) interacts with Trithorax-like (GAGA) and represses GAGA-mediated activation. Nucleic Acids Res. 2002;30:4406–13. doi: 10.1093/nar/gkf570. [DOI] [PMC free article] [PubMed] [Google Scholar]
- Pai CY, Lei EP, Ghosh D, Corces VG. The centrosomal protein CP190 is a component of the gypsy chromatin insulator. Mol Cell. 2004;16:737–48. doi: 10.1016/j.molcel.2004.11.004. [DOI] [PubMed] [Google Scholar]
- Parks AL, Cook KR, Belvin M, Dompe NA, Fawcett R, Huppert K, Tan LR, Winter CG, Bogart KP, Deal JE, et al. Systematic generation of high-resolution deletion coverage of the Drosophila melanogaster genome. Nature genetics. 2004;36:288–292. doi: 10.1038/ng1312. [DOI] [PubMed] [Google Scholar]
- Pfreundt U, James DP, Tweedie S, Wilson D, Teichmann SA, Adryan B. FlyTF: improved annotation and enhanced functionality of the Drosophila transcription factor database. Nucleic acids research. 2010;38:D443–447. doi: 10.1093/nar/gkp910. [DOI] [PMC free article] [PubMed] [Google Scholar]
- Przytycka TM, Singh M, Slonim DK. Toward the dynamic interactome: it's about time. Brief Bioinform. 2010;11:15–29. doi: 10.1093/bib/bbp057. [DOI] [PMC free article] [PubMed] [Google Scholar]
- Ravasi T, Suzuki H, Cannistraci CV, Katayama S, Bajic VB, Tan K, Akalin A, Schmeier S, Kanamori-Katayama M, Bertin N, et al. An atlas of combinatorial transcriptional regulation in mouse and man. Cell. 2010;140:744–752. doi: 10.1016/j.cell.2010.01.044. [DOI] [PMC free article] [PubMed] [Google Scholar]
- Reece-Hoyes JS, Deplancke B, Shingles J, Grove CA, Hope IA, Walhout AJ. A compendium of Caenorhabditis elegans regulatory transcription factors: a resource for mapping transcription regulatory networks. Genome Biol. 2005;6:R110. doi: 10.1186/gb-2005-6-13-r110. [DOI] [PMC free article] [PubMed] [Google Scholar]
- Roy S, Ernst J, Kharchenko PV, Kheradpour P, Negre N, Eaton ML, Landolin JM, Bristow CA, Ma L, Lin MF, et al. Identification of functional elements and regulatory circuits by Drosophila modENCODE. Science. 2010;330:1787–1797. doi: 10.1126/science.1198374. [DOI] [PMC free article] [PubMed] [Google Scholar]
- Sen A, Dimlich DN, Guruharsha KG, Kankel MW, Hori K, Yokokura T, Brachat S, Richardson D, Loureiro J, Sivasankaran R, et al. Genetic circuitry of Survival motor neuron, the gene underlying spinal muscular atrophy. Proc Natl Acad Sci U S A. 2013;110:E2371–80. doi: 10.1073/pnas.1301738110. [DOI] [PMC free article] [PubMed] [Google Scholar]
- Siggers T, Duyzend MH, Reddy J, Khan S, Bulyk ML. Non-DNA- binding cofactors enhance DNA-binding specificity of a transcriptional regulatory complex. Molecular systems biology. 2011;7:555. doi: 10.1038/msb.2011.89. [DOI] [PMC free article] [PubMed] [Google Scholar]
- Slattery M, Riley T, Liu P, Abe N, Gomez-Alcala P, Dror I, Zhou T, Rohs R, Honig B, Bussemaker HJ, et al. Cofactor binding evokes latent differences in DNA binding specificity between Hox proteins. Cell. 2011;147:1270–1282. doi: 10.1016/j.cell.2011.10.053. [DOI] [PMC free article] [PubMed] [Google Scholar]
- Smibert P, Miura P, Westholm JO, Shenker S, May G, Duff MO, Zhang D, Eads BD, Carlson J, Brown JB, et al. Global patterns of tissue-specific alternative polyadenylation in Drosophila. Cell reports. 2012;1:277–289. doi: 10.1016/j.celrep.2012.01.001. [DOI] [PMC free article] [PubMed] [Google Scholar]
- Sowa ME, Bennett EJ, Gygi SP, Harper JW. Defining the human deubiquitinating enzyme interaction landscape. Cell. 2009;138:389–403. doi: 10.1016/j.cell.2009.04.042. [DOI] [PMC free article] [PubMed] [Google Scholar]
- Spitz F, Furlong EE. Transcription factors: from enhancer binding to developmental control. Nature reviews Genetics. 2012;13:613–626. doi: 10.1038/nrg3207. [DOI] [PubMed] [Google Scholar]
- St Johnston D. The art and design of genetic screens: Drosophila melanogaster. Nature reviews Genetics. 2002;3:176–188. doi: 10.1038/nrg751. [DOI] [PubMed] [Google Scholar]
- Stanyon CA, Liu G, Mangiola BA, Patel N, Giot L, Kuang B, Zhang H, Zhong J, Finley RL., Jr. A Drosophila protein-interaction map centered on cell- cycle regulators. Genome biology. 2004;5:R96. doi: 10.1186/gb-2004-5-12-r96. [DOI] [PMC free article] [PubMed] [Google Scholar]
- Suzuki H, Forrest AR, van Nimwegen E, Daub CO, Balwierz PJ, Irvine KM, Lassmann T, Ravasi T, Hasegawa Y, de Hoon MJ, et al. The transcriptional network that controls growth arrest and differentiation in a human myeloid leukemia cell line. Nature genetics. 2009;41:553–562. doi: 10.1038/ng.375. [DOI] [PMC free article] [PubMed] [Google Scholar]
- Tang X, et al. A comparison of the functional modules identified from time course and static PPI network data. BMC Bioinformatics. 2011;12:339. doi: 10.1186/1471-2105-12-339. [DOI] [PMC free article] [PubMed] [Google Scholar]
- Thibault ST, Singer MA, Miyazaki WY, Milash B, Dompe NA, Singh CM, Buchholz R, Demsky M, Fawcett R, Francis-Lang HL, et al. A complementary transposon tool kit for Drosophila melanogaster using P and piggyBac. Nature genetics. 2004;36:283–287. doi: 10.1038/ng1314. [DOI] [PubMed] [Google Scholar]
- Tomancak P, Berman BP, Beaton A, Weiszmann R, Kwan E, Hartenstein V, Celniker SE, Rubin GM. Global analysis of patterns of gene expression during Drosophila embryogenesis. Genome Biol. 2007;8:R145. doi: 10.1186/gb-2007-8-7-r145. [DOI] [PMC free article] [PubMed] [Google Scholar]
- van den Heuvel S, Dyson NJ. Conserved functions of the pRB and E2F families. Nature reviews Molecular cell biology. 2008;9:713–724. doi: 10.1038/nrm2469. [DOI] [PubMed] [Google Scholar]
- Veraksa A, Bauer A, Artavanis-Tsakonas S. Analyzing protein complexes in Drosophila with tandem affinity purification-mass spectrometry. Developmental dynamics : an official publication of the American Association of Anatomists. 2005;232:827–834. doi: 10.1002/dvdy.20272. [DOI] [PubMed] [Google Scholar]
- Wang Z, Mann RS. Requirement for two nearly identical TGIF-related homeobox genes in Drosophila spermatogenesis. Development. 2003;130:2853–65. doi: 10.1242/dev.00510. [DOI] [PubMed] [Google Scholar]
- Weaver ZA, Kane CM. Genomic characterization of a testis-specific TFIIS (TCEA2) gene. Genomics. 1997;46:516–519. doi: 10.1006/geno.1997.5073. [DOI] [PubMed] [Google Scholar]
- Wu L, Aster JC, Blacklow SC, Lake R, Artavanis-Tsakonas S, Griffin JD. MAML1, a human homologue of Drosophila mastermind, is a transcriptional co- activator for NOTCH receptors. Nature genetics. 2000;26:484–489. doi: 10.1038/82644. [DOI] [PubMed] [Google Scholar]
- Xu T, Artavanis-Tsakonas S. deltex, a locus interacting with the neurogenic genes, Notch, Delta and mastermind in Drosophila melanogaster. Genetics. 1990;126:665–77. doi: 10.1093/genetics/126.3.665. [DOI] [PMC free article] [PubMed] [Google Scholar]
- Yao T, Forman B, Jiang Z, Cherbas L, Chen J, McKeown M, Cherbas P, Evans R. Functional ecdysone receptor is the product of EcR and ultraspiracle genes. Nature. 1993;366:476–479. doi: 10.1038/366476a0. [DOI] [PubMed] [Google Scholar]
- Yu C, Wan KH, Hammonds AS, Stapleton M, Carlson JW, Celniker SE. Development of expression-ready constructs for generation of proteomic libraries. Methods Mol Biol. 2011;723:257–272. doi: 10.1007/978-1-61779-043-0_17. [DOI] [PubMed] [Google Scholar]
- Yu J, Pacifico S, Liu G, Finley RL., Jr. DroID: the Drosophila Interactions Database, a comprehensive resource for annotated gene and protein interactions. BMC genomics. 2008;9:461. doi: 10.1186/1471-2164-9-461. [DOI] [PMC free article] [PubMed] [Google Scholar]
Associated Data
This section collects any data citations, data availability statements, or supplementary materials included in this article.