

Abstract
Brain activation associated with anhedonic depression and co-occurring anxious arousal and anxious apprehension was measured by fMRI during performance of an emotion-word Stroop task. Consistent with EEG findings, depression was associated with rightward frontal lateralization in dorsolateral prefrontal cortex (DLPFC), but only when anxious arousal was elevated and anxious apprehension was low. Activity in right inferior frontal gyrus (IFG) was also reduced for depression under the same conditions. In contrast, depression was associated with more activity in anterior cingulate cortex (dACC and rACC) and bilateral amygdala. Results imply that depression, particularly when accompanied by anxious arousal, may result in a failure to implement top-down processing by appropriate brain regions (left DLPFC, right IFG) due to increased activation in regions associated with responding to emotionally salient information (right DLPFC, amygdala).
EEG studies have indicated a pattern of frontal asymmetry for depression, characterized by relatively less left than right activity (for review, see Coan & Allen, 2004). A review of prefrontal asymmetry research suggested that affect-related prefrontal asymmetries may be more apparent during tasks that involve a response component, and that these asymmetries likely reflect differences in dorsolateral prefrontal cortex (DLPFC) activity (Davidson, 2004). This review also suggested the need for further research to relate frontal EEG asymmetry measures in studies of emotional processes to individual differences in fMRI activation patterns in response to affective challenges. However, there is considerable heterogeneity in neuroimaging studies that have identified abnormal DLPFC activity in depression, and EEG patterns of frontal asymmetry have not been consistently replicated in the hemodynamic neuroimaging literature (Fitzgerald et al., 2006; Herrington et al., in press; Johnstone, van Reekum, Urry, Kalin, & Davidson, 2007; Reid, Duke, & Allen, 1998).
In studies of brain activation patterns for depression during affective challenge tasks involving top-down control in the presence of emotional distractors (such as the emotional stroop or affective go/no-go), only a handful of experiments have carefully assessed anxiety (Elliott, Rubinsztein, Sahakian, & Dolan, 2002; George et al., 1997; Herrington et al., in press; Mitterschiffthaler et al., 2008). We have argued that it is critical to take anxiety into account when investigating brain function in depression (Engels et al., 2007; Heller, 1990, 1993; Heller and Nitschke, 1998; Heller, Nitschke, Etienne, & Miller, 1997; Nitschke, Heller, Palmieri, & Miller, 1999; Keller et al., 2000). Anxiety and depression frequently co-occur (Brown, Campbell, Lehman, Grisham, & Mancill, 2001; Joorman, Kosfelder, & Schulte, 2005; Kessler, Dupont, Berglund, Wittchen, 1999; Sanderson, DiNardo, Rapee, & Barlow, 1990), and the degree, severity, and type of co-occurring anxiety may differentially affect patterns of brain activation in depression. Inconsistency in depression findings could therefore be due in part to different (and unassessed) degrees of co-occurring anxiety.
Resting EEG studies of depression that explicitly assess comorbid anxiety suggest that the co-occurrence of anxiety can increase right frontal lateralization (e.g., Bruder et al., 1997; Pizzagalli et al., 2002). Other resting EEG findings are consistent with right-posterior hypoactivity for pure depression (no co-occurring anxiety) or when anxiety is equated (Bruder et al., 2001), with co-occurring anxiety reducing this effect or producing the opposite pattern (Bruder et al., 1997; Kentgen et al., 2000). Moderation of right-posterior asymmetry by anxiety is consistent with the hypothesized role of the posterior right hemisphere in arousal, vigilance, and other aspects of adaptive threat response (e.g., Compton et al., 2003; Davidson, 2004; Nitschke & Heller, 2005; Nitschke, Heller, & Miller, 2000) Thus, EEG frontal and posterior asymmetries at rest observed for depression appear to depend on levels of co-occurring anxiety. Empirical support for theoretical distinctions between two types of anxiety, specifically anxious arousal (akin to fear or panic) and anxious apprehension (akin to worry or anticipatory anxiety), has also been obtained in EEG and fMRI research, suggesting greater left frontal activity for anxious apprehension and greater right frontal and posterior activity for anxious arousal (Engels et al., 2007; Heller et al., 1997; Nitschke et al., 1999, Nitschke et al., 2000; Nitschke & Heller, 2005). Further EEG and fMRI research is needed to assess the moderating effect of anxiety types on laterality patterns for depression in the context of an affective challenge.
In the few neuroimaging studies of depression and performance on tasks involving top-down control in the presence of emotional distractors that carefully considered anxiety, participant selection was most commonly done using a structured clinical interview to select individuals with depression, and participants with co-occurring anxiety were excluded (e.g., Elliott et al., 2002; George et al., 1997; Mitterschiffthaler et al., 2008). One additional study selected participants using dimensional measures of depression and anxiety symptoms, with both the depressed and control group scoring low on anxiety scales (Herrington et al., in press). Together these studies suggest abnormal rostral anterior cingulate (rACC), dorsal anterior cingulate (dACC), dorsolateral prefrontal cortex (DLPFC), and amygdala activity for depression in the context of a cognitive task with emotional distractors. For example, depressed patients showed more dACC activation than controls for negative words during an emotional Stroop task (Mitterschiffthaler et al., 2008). Depressed patients also showed increased rACC activation for sad compared to happy words during an emotional go/no-go task, but controls showed the opposite pattern (Elliot et al., 2002). Depressed patients also showed greater right-hemisphere DLPFC activation to emotional targets than did controls (Elliot et al., 2002). Finally, Herrington et al. (in press) found that a depressed group showed more right-lateralized activation than controls for both DLPFC and amygdala for negative compared to neutral distractors in an emotion-word Stroop task.
Because anxiety was explicitly excluded, none of the imaging studies reviewed above was able to examine the potential influence of anxiety on the patterns of brain activity for depression. Moreover, hemodynamic neuroimaging studies very rarely include explicit tests of laterality, instead inferring a laterality pattern by the simple presence or absence of activation in either hemisphere. Of the studies reviewed above, only Herrington et al. (in press) explicitly tested laterality of DLPFC and amygdala. The present report extends analyses of Herrington et al. (in press) by examining, in a new, large, undergraduate sample, the implications for co-occurring anxiety, as well as investigating the effects of anxiety type (anxious apprehension versus anxious arousal) on patterns of brain activation and lateralization in depression during an emotional stroop task.
A dimensional approach and hierarchical linear regression strategies were employed to identify regions where the relationship between depression and brain activation varied depending on co-occurring anxiety, regions where depression captured unique variance, and regions where depression and anxiety types shared variance. Because Herrington et al. tested possible effects of valence, arousal, negative affect, and positive affect based on psychometric definitions of these terms, finding differences in lateralization between a depressed group and controls only for negative affect (operationalized as the negative versus neutral word comparison), the present investigation focused on negative affect. Based on the psychophysiological data reviewed above, depression was expected to be associated with reduced DLPFC activation, especially in the left hemisphere, and increased ACC activation. Co-occurring anxiety was expected to modulate this pattern. Based on previous research (e.g., Engels et al., 2007), it was predicted that anxious apprehension would mitigate a rightward DLPFC asymmetry and that anxious arousal would augment it.
Present analyses also examined the arousal contrast (operationalized as negative plus positive versus neutral words) in order to investigate additional predictions for posterior asymmetry. For the arousal contrast, depression was predicted to be associated with right-posterior hypoactivation with co-occurring anxious arousal attenuating or reversing this effect.
Method
The data examined here are part of a larger project that collected EEG and fMRI data in separate sessions for both emotion-word and color-word Stroop tasks. The data from this project also encompass a replication and extension of the findings of Engels et al. (2007) regarding distinctions between anxious apprehension and anxious arousal, reported elsewhere (Engels et al., in preparation). The present report focuses on behavioral and fMRI data from the emotion-word Stroop task using a dimensional approach to examine the effects of depression and co-occurring symptoms of anxiety.
Participants
Of 2,723 college undergraduates screened, participants were 91 (51 female) paid volunteers (mean age = 19.01, SD = 1.00) recruited via group questionnaire screening sessions. Screening measures included the Penn State Worry Questionnaire (PSWQ, measuring anxious apprehension; Meyer, Miller, Metzger, & Borkovec, 1990; Molina, & Borkovec, 1994) and Mood and Anxiety Symptom Questionnaire (MASQ, measuring anxious arousal (MASQAA) and anhedonic depression (MASQAD8); Watson, Clark, et al., 1995; Watson, Weber, et al., 1995). MASQAD8 refers to an eight-item subscale of the MASQ Anhedonic Depression scale that has been shown to reflect depressed mood (Nitschke, Heller, Imig, McDonald, & Miller, 2001). Participants were selected to cover a range of depression and anxiety scores to allow both categorical and dimensional analytic strategies. The present investigation utilized a dimensional analytic approach. Participants were given a laboratory tour, informed of the procedures of the study, and screened for claustrophobia or other contraindications for MRI participation. The questionnaires were administered again (Time 2) when participants attended an individual laboratory tour. Questionnaire scores for the mass testing sample and selected participants (at Time 1 and Time 2) are reported in Table 1, and questionnaire correlations are reported in Table 2. All participants were right-handed, native speakers of English with self-reported normal color vision.
Table 1. Questionnaire Scores Used in Participant Selection.
| Sample | PSWQ | MASQAA | MASQAD8 | |||
|---|---|---|---|---|---|---|
| M | SD | M | SD | M | SD | |
| Questionnaire Screening Sample N = 2,723 |
49.27 | 13.70 | 28.54 | 8.87 | 17.69 | 5.57 |
| Experiment Sample Time 1 N = 91 |
49.14 | 17.42 | 29.19 | 10.50 | 18.92 | 7.43 |
| Experiment Sample Time 2 N = 91 |
47.82 | 18.00 | 26.80 | 6.72 | 16.79 | 6.13 |
Note. Time 1 scores (Questionnaire screening testing) were unavailable for one subject. PSWQ Time 2 scores (individual lab tour) were unavailable for four subjects. In those cases, analyses used available scores rather than the average of Time 1 and Time 2.
Table 2. Correlations of Anxiety and Depression Questionnaires.
| 1 | 2 | 3 | |
|---|---|---|---|
| Mass Testing (N = 2723) | |||
| 1. PSWQ | -- | .293** | .322** |
| 2. MASQAA | -- | .484** | |
| 3. MASQAD8 | -- | ||
|
| |||
| Experiment Sample Time 1 (N = 91) | |||
| 1. PSWQ | -- | .493** | .523** |
| 2. MASQAA | -- | .570** | |
| 3. MASQAD8 | -- | ||
|
| |||
| Experiment Sample Time 2 (N = 91) | |||
| 1. PSWQ | -- | .472** | .445** |
| 2. MASQAA | -- | .516** | |
| 3. MASQAD8 | -- | ||
Note.
Correlation is significant at the 0.01 level (2-tailed).
Twelve additional participants were excluded from the study for a variety of reasons, yielding 91 participants. Four were excluded due to excessive motion in the scanner; four were excluded due to other MRI artifact; one was excluded due to poor co-registration of structural and functional images; one was excluded due to experimenter error during fMRI acquisition; one was excluded due to loss of questionnaire data; and one was excluded as an RT outlier (defined as =3 SD away from the mean and discontinuous from the distribution).
Stimuli and Experimental Design
The emotion-word Stroop task consisted of blocks of positive or negative emotion words alternating with blocks of neutral words. Participants received 16 word blocks (four positive, eight neutral, four negative), each 32 seconds long. Each participant received one of eight counterbalanced block orders designed to ensure that emotional and neutral words preceded each other equally often. In addition to the 16 word blocks, there were four fixation blocks (each 32 seconds long)—one at the beginning, one at the end, and two in the middle of the session. There were also several brief rest periods during the task, totaling 100 seconds of rest.
Participants received 256 word trials in the 16 word blocks. Each block contained 16 trials, with a variable ITI (±225 ms) averaging 2000 ms between trial onsets. A trial began with the presentation of a word for 1500 ms, followed by a fixation cross for an average of 500 ms. Each trial consisted of one word presented in one of four ink colors (red, yellow, green, blue) on a black background, with each color occurring equally often with each word type (positive, neutral, negative). Within a word block, each color appeared four times, and trials were pseudorandomized such that no more than two trials featuring the same color appeared in a row. Familiarity was controlled by ensuring that no word was repeated throughout the experiment. In the fixation condition, instead of a word, participants were presented with 16 trials of fixation crosses. For each fixation trial, a brighter fixation cross was presented for 1500 ms, followed by a dimmer fixation cross for an average of 500 ms.
Participants were instructed to press one of four buttons to indicate the color in which the word appeared on the screen, with word meaning irrelevant to the task. Participants responded with their middle and index fingers using left- and right-hand response boxes. To the extent emotion stimuli attract attention, rapid and correct performance depends on attention being directed away from word meaning. Stimuli were displayed using backprojection, and word presentation and reaction-time measurement were controlled by STIM software (James Long Company, Caroga Lake, NY).
The 256 word stimuli were selected from the Affective Norms for English Words (ANEW) set (see Table 3; Bradley & Lang, 1998). Sixty-four positive (e.g., birthday, ecstasy, laughter), 64 negative (e.g., suicide, war, victim), and two sets of 64 neutral (e.g., hydrant, moment, carpet) words were carefully selected on the basis of established norms for valence, arousal, and frequency of usage in the English language (Bradley & Lang, 1998; Toglia & Battig, 1978) as well as for number of letters. In the ANEW rating system, all words are considered “emotional” and located somewhere in a valence/arousal plane. Neutral words were toward the low-arousal end of the arousal dimension, and the positive and negative words selected for this study were toward the high-arousal end.
Table 3. Stimulus Characteristics.
| Pleasant Words | Unpleasant Words | Neutral Words | |
|---|---|---|---|
| Average Valence | 7.83 | 2.47 | 5.21 |
| Average Arousal | 6.59 | 6.54 | 3.82 |
| Average Frequency | 52.39 | 60.03 | 60.00 |
| Average Word Length | 5.78 | 5.36 | 5.33 |
Note. Word stimuli were selected from the Affective Norms for English Words (ANEW) set (Bradley & Lang, 1999). Valence and arousal data from the ANEW set are represented on a scale ranging from 1 to 9, with 9 representing the most pleasant and most arousing ratings, respectively. Frequency information was collected from Toglia & Battig (1978).
Image Acquisition
Instructions were read verbatim by experimenters to ensure that participants were provided with all relevant information about the procedure before participating. The MRI technologist and experimenter assisted the participant in correct placement of earplugs and protective headphones. Before beginning the task, the participant performed 64 practice trials. No participants failed to understand the task instructions or the mapping between colors and buttons after completing practice trials. Participants then completed the emotion-word task (and a color-word task not reported here) during MR data acquisition.
MR data were collected using a research-dedicated 3T Siemens Allegra. Gradient field maps were collected for correction of geometric distortions in the EPI data caused by magnetic field inhomogeneity (Jezzard & Balaban, 1995). A gradient-echo echo-planar imaging (EPI) sequence (TR 2000 ms, TE 25 ms, flip angle 80°, FOV=22 cm) provided 370 functional images. Thirty-eight oblique axial slices (slice thickness 3 mm, in-plane resolution 3.4375 × 3.4375 mm2, .3 mm gap between slices) were acquired parallel to the anterior and posterior commissures. After the EPI sequence, a 160-slice MPRAGE high-resolution structural sequence was acquired (slice thickness 1 mm, in-plane resolution 1 × 1 mm2) for registering each participant's functional data to standard space.
fMRI Data Reduction and Analysis
Functional image processing and analyses primarily relied on tools from the FSL analysis package (e.g., MCFLIRT, PRELUDE, FILM, FUGUE, FEAT, FLAME; http://www.fmrib.ox.ac.uk/fsl). A few analytic tools were also drawn from AFNI (http://afni.nimh.nih.gov/afni/). Additional region-of-interest (ROI) analyses were carried out using locally written Matlab programs (e.g., Herrington et al., 2005) and SPSS version 17.0 (SPSS Inc., Chicago IL).
Each fMRI time series was first motion-corrected using MCFLIRT (Jenkinson, Bannister, Brady, & Smith, 2002), and spikes (artifactual sudden intensity shifts) were corrected using the AFNI tool 3dDespike. The time series of two participants were truncated due to excessive motion only at the end of the scan. All other participants demonstrated motion less than 3.3 mm absolute or 2 mm relative motion (participants with motion exceeding this threshold were excluded from analysis as discussed above). After motion correction and despiking, each time series was corrected for geometric distortions caused by magnetic field inhomogeneity. Remaining preprocessing steps, single-subject statistics, and higher-level regression analyses were done with FEAT. The first 3 volumes of each time series were discarded to allow the MR signal to reach a steady state. Each time series was then temporally filtered with a high-pass filter (to remove drift in signal intensity), mean-based intensity-normalized by the same single scaling factor, and spatially smoothed using a 3D Gaussian kernel (full-width-half-maximum 5 mm) prior to statistical analysis.
Regression analyses were performed on each participant's time series using FILM. Statistical maps were generated via multiple regression computed for each intracerebral voxel (Woolrich, Ripley, Brady, & Smith, 2001). An explanatory variable (EV) was created for each trial type (positive, neutral, negative, rest), with the fixation condition as the unmodeled baseline. Each EV was convolved with a gamma function to better approximate the temporal course of the blood-oxygen-dependent (BOLD) hemodynamic response (e.g., Aguirre, Zarahn, & D'Esposito, 1998; Miezin, Maccotta, Ollinger, Petersen, & Buckner, 2000). Each EV yielded a per-voxel effect-size parameter estimate (β) map representing the magnitude of activation associated with that EV. Contrasts of interest included negative affect (negative minus neutral), and arousal (positive and negative jointly compared to neutral). Functional activation maps for each contrast were then transformed into MNI stereotaxic space (FSL's MNI 152, T1 2 × 2 × 2 mm) using FLIRT (Jenkinson et al., 2002; Jenkinson & Smith, 2001). The two-stage registration procedure used trilinear interpolation and 6 d.f. for registration of functional images to an intermediate high resolution structural image, and 12 d.f. for registration of the high resolution structural image to standard space.
Hierarchical linear regression strategies were employed to identify regions where the relationship between depression and brain activation varied depending on co-occurring anxiety, regions where depression captured unique variance, and regions where depression and anxiety types shared variance. Questionnaire scores (PSWQ, MASQAA, and MASQAD8) were averaged from time 1 (mass testing) and time 2 (lab tour) to yield a summary score for each participant. Each questionnaire summary score was then converted to a z-score based on the scores of the 91 subjects in the experiment, and interactions (PSWQ×MASQAA, PSWQ×MASQAD8, MASQAA×MASQAD8, PSWQ×MASQAA×MASQAD8) were formed by multiplying the z-scored questionnaires. These questionnaire scores were then entered as predictors into higher-level regression analyses across all 91 subjects using FLAME to predict activation voxel-by-voxel.
Several different higher-level regression analyses were conducted using FLAME. Of primary interest were two-way interactions involving depression and either type of anxiety and the three-way interaction of all three psychopathology scales. A regression analysis that included the individual questionnaires as well as the two-way interactions (but not the three-way) as predictors was used to identify brain regions showing two-way interactions. The regression analysis that included the individual questionnaires, all two-way interactions, and the three-way interaction as predictors was used to identify brain regions showing three-way interactions. These analyses revealed brain regions that showed two-way or three-way interaction patterns, suggesting that for these regions the relationship between depression and brain activation depended on co-occurring anxiety.
In order to identify regions where depression captured unique variance, the MASQAD8, PSWQ, and MASQAA z-scores were entered into the same higher-level regression analysis, without the interactions. The z-map for the MASQAD8 identified areas where anhedonic depression captured unique variance (with the variance associated with anxiety removed). The z-map for the MASQAD8 was compared to the z-map for the PSWQ and for the MASQAA to determine whether the MASQAD8 was the only scale to capture unique variance for a particular region.
In order to identify regions where depression and anxiety types shared variance, separate regressions were performed for each questionnaire (without shared variance from other questionnaires removed), and conjunction analyses revealed areas in common for depression and anxiety (Nichols, Brett, Andersson, Wager, & Poline, 2005). The conjunction analysis procedure entailed creating a conjunction z-map by comparing the z-maps for the MASQAD8, MASQAA, and PSWQ. First, a MASQAD8 & MASQAA conjunction z-map was created by comparing the z-value of each voxel in the MASQAD8 map to the z-value of the MASQAA map. If the z-scores were of opposite signs, the value for the voxel in the conjunction z-map was set to zero. If the z-scores were in the same direction, the value for the voxel in the conjunction z-map was assigned to the z-value with the weaker significance. This procedure was then repeated by comparing the z-scores for each voxel in the MASQAD8 & MASQAA conjunction z-map to the values in the PSWQ z-map to create the conjunction z-map of all three questionnaires. A conjunction z-map for the MASQAD8 and PSWQ was also created. Conjunction z-maps were then thresholded to identify significant clusters using the thresholding method described below.
For each of the regression analyses, significantly activated voxels were identified via thresholding of two-tailed, per-voxel t-tests on contrast β maps converted to z-scores. Monte Carlo simulations via AFNI's AlphaSim program estimated the overall significance level (probability of a false detection) for thresholding these 3D functional z-map images (Ward, 2000). These simulations used a gray-matter mask to limit the number of voxels under consideration and provided a cluster size and z-value combination to use for thresholding (z = 2.0537, p= .04, cluster size = 215 voxels), resulting in an overall familywise error rate of .05. Because of concerns about type II errors for small regions due to the large cluster size constraint, the data was further examined with a smaller cluster size but more stringent z-value combination (z = 2.1701, p = 03, cluster size = 156 voxels), still corrected at an overall rate of .05. Clusters that survived thresholding were defined as ROIs for further analysis. Locations of the center of intensity (COI) for each cluster are reported (see Tables 4 and 5). No amygdala clusters survived thresholding. In order to investigate a priori amygdala hypotheses, a priori ROIs of the amygdala were used to examine the relationship between depression, anxiety types, and amygdala activation. Amygdala ROIs were taken from the Harvard-Oxford atlas in FSL.
Table 4. ROIs with Interactive Effects for Depression, for Negative – Neutral Contrast (N=91).
| Region | Cluster Size | Mean Z | COI Location | ||
|---|---|---|---|---|---|
| X | Y | Z | |||
| Anhedonic Depression × Anxious Arousal | |||||
| R Middle Frontal Gyrus (DLPFC) | 265 | 2.35 | 38 | 30 | 30 |
|
| |||||
| Anhedonic Depression × Anxious Apprehension | |||||
| R Lateral Occipital Cortex, inferior division | 379 | 2.39 | 42 | -76 | -2 |
|
| |||||
| Anhedonic Depression × Anxious Arousal × Anxious Apprehension | |||||
| R Inferior Frontal Gyrus, pars opercularis | 247 | 2.44 | 49 | 19 | 23 |
| Superior Frontal Gyrus | 220 | 2.32 | 4 | 24 | 52 |
| L Middle Frontal Gyrus (DLPFC) | 242 | 2.30 | -34 | 4 | 49 |
| Cuneal Cortex | 475 | -2.26 | -3 | -77 | 28 |
Note: Standard space voxel size was 2 × 2 × 2 mm3. All z-scores = 2.0537 (p < .04) cluster-size ≥ 215 voxels (corrected p < .05). COI = center of intensity.
Table 5. Unique Variance of Anhedonic Depression and Shared Variance with Anxiety for Negative – Neutral Contrast (N=91).
| Region | Cluster Size | Mean Z | COI Location | ||
|---|---|---|---|---|---|
| X | Y | Z | |||
| Unique Variance: Anhedonic Depression | |||||
| Paracingulate Gyrus (extends into rACC) | 231 | 2.46 | -6 | 56 | 2 |
| Cingulate Gyrus, anterior division (dACC) | 158 | 2.54 | 0 | 24 | 24 |
|
| |||||
| Shared Variance: Conjunction of Anhedonic Depression & Anxious Arousal | |||||
| Cingulate Gyrus, posterior division | 165 | 2.52 | -6 | -46 | 31 |
Note: Standard space voxel size was 2 × 2 × 2 mm3. z-scores = 2.1701 (p < .03) cluster-size ≥ 156 voxels (corrected p < .05). COI = center of intensity.
For each ROI, for each participant, the mean β value for each contrast of interest (across voxels within the ROI) was calculated, weighting each voxel equally. In order to directly test laterality hypotheses, mean β values were also extracted from the homologous region in the opposite hemisphere for each lateral ROI. A laterality index (LI) was then computed for each region, LI = (QLH – QRH)/(|QLH| + |QRH|), with positive values indicating greater left than right activity, and negative values indicating greater right than left activity (Seghier, 2008).
The beta values extracted from significant clusters for each subject were then used for follow-up analyses in SPSS in order to characterize the patterns for each ROI. Interaction plots provide a useful illustration of how anxiety (either anxious apprehension, anxious arousal, or both) moderated the relationship between depression and brain activation. In order to illustrate the moderation pattern, interactions were plotted, and simple slopes were tested according to methods described in Aiken and West (1991) and Dawson and Richter (2006). Using SPSS, a hierarchical regression was performed for each ROI, with first-order effects only in step 1, two-way interactions added in step 2, and the three-way interaction added in step 3. This supplied the unstandardized coefficients and variance-covariance matrix necessary for plotting the pattern of each interaction and for testing simple slopes. The relationship between depression and brain activation was then plotted at high and low levels of anxiety for each interaction. Simple slopes (analogous to tests of simple main effects in ANOVA) were then tested to see if the relationship between depression and brain activation was significantly different from zero at different combinations of high and low levels of anxiety types. In figures that plot interactions (Figures 1 through 5), “high” and “low” refer to ±1 SD. The hierarchical regression and plotting procedure described above was repeated for each region's laterality index. Throughout the rest of the text, tables, and figures, summaries of results will refer to the MASQAD8 as “Anhedonic Depression”, MASQAA as “Anxious Arousal”, and PSWQ as “Anxious Apprehension” to facilitate interpretation.
Figure 1.
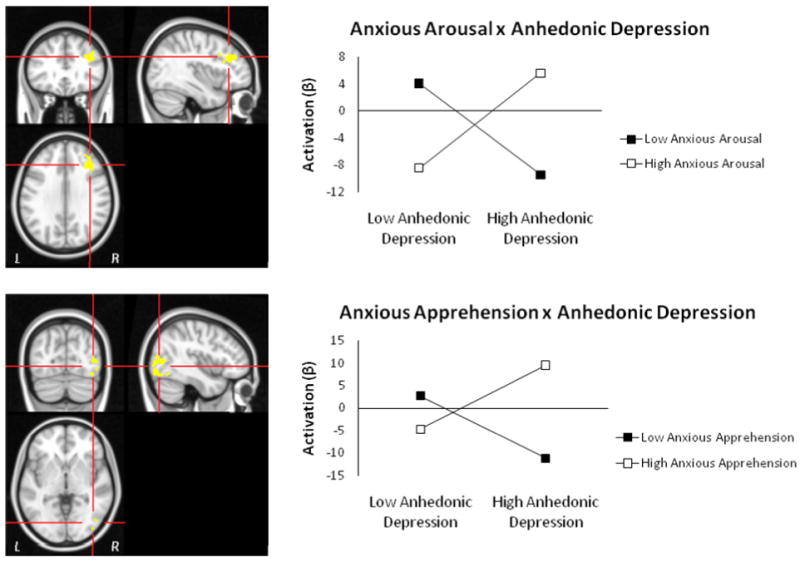
Regions showing anhedonic depression two-way interactions with anxiety for negative – neutral contrast. Top panel: R DLPFC from Anhedonic Depression × Anxious Arousal interaction. Bottom panel: R Lateral Occipital Cortex, inferior division from Anhedonic Depression × Anxious Apprehension interaction. Graphing of the two-way interactions show that depression's relationship with R DLPFC activation depends on the level of co-occurring anxious arousal, and that the relationship with right occipital cortex depends on the level of co-occurring anxious apprehension. Highlighted voxels are those with z-scores > 2.05 (p < .04) meeting a cluster-size threshold of 215 (corrected p < .05).
Figure 5.
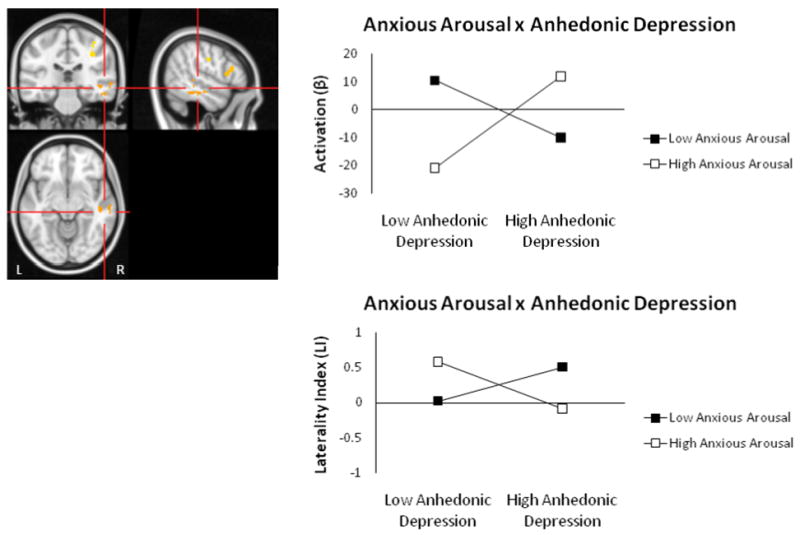
R temporal gyrus Anhedonic Depression × Anxious Arousal interaction for arousal contrast. Highlighted voxels are those with z-scores > 2.05 (p < .04) meeting a cluster-size threshold of ≥ 215 (corrected p < .05). Graphing of the two-way interaction (top panel) shows that the relationship between depression and right-posterior activity depends on the level of co-occurring anxious arousal. Graphing of the two-way interaction for this region's laterality index is also shown (bottom panel).
Behavioral Data
Average reaction times (RT) were computed for each condition (positive, neutral, negative), excluding no-response trials. A repeated-measures MANOVA was conducted to explore linear (valence) and quadratic (arousal) orthogonal trends on the emotion factor for reaction time. A hierarchical regression was also performed using questionnaire scores as predictors of RT interference (negative RT – neutral RT). To examine the relationship between brain activation and behavioral performance, RT interference (negative RT – neutral RT) was correlated with activity in select ROIs.
Results
Behavioral Data
Every participant showed color-choice accuracy of at least 85%. Average RTs were computed for each type of emotion-word trial. A repeated-measures MANOVA showed that RT did not significantly differ between negative words (mean = 680 ms, SD = 107 ms), neutral words (mean = 674 ms, SD = 100 ms), or positive words (mean = 680 ms, SD = 100 ms). No significant linear (valence) or quadratic (arousal) trends were observed. Likewise, pairwise t-tests were nonsignificant for each combination of word type. Hierarchical regressions using questionnaire scores to predict RT interference were nonsignificant. In summary, no significant behavioral Stroop effects were found, and questionnaire scores did not predict RT interference.
Importance of Co-occurring Anxiety: Interactive Effects of Anhedonic Depression and Anxiety Types
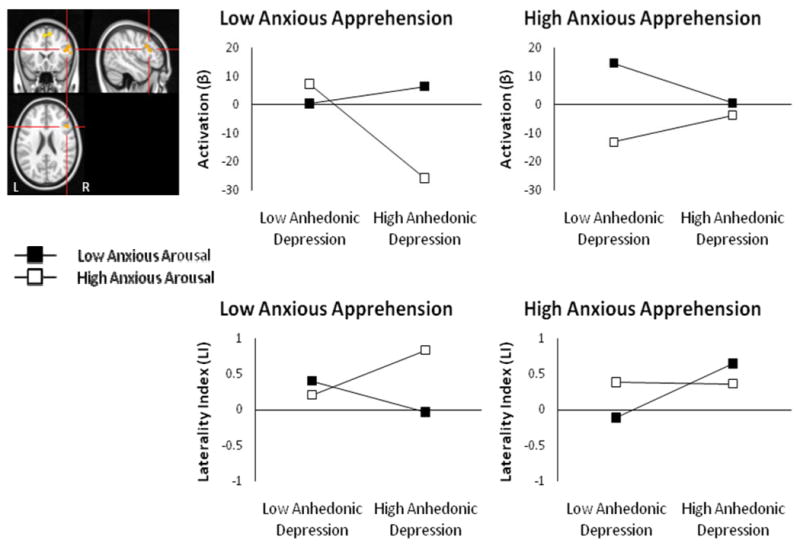
Table 4 lists the regions with two- or three-way interactive effects for depression and anxiety for the negative – neutral contrast. Two regions with two-way interactions emerged. An Anhedonic Depression × Anxious Arousal interaction was found for right DLPFC (Figure 1, top panel). Tests of simple slopes showed that increased depression was associated with decreased right DLPFC activation at low levels of anxious arousal, t(84) = -2.71, p = .008, but increased right DLPFC activation at high levels of anxious arousal, t(84) = 2.27, p = .025. This two-way interaction indicates that a relationship between depression and right DLPFC activation depends on the level of co-occurring anxious arousal. An Anhedonic Depression × Anxious Apprehension interaction was found for right lateral occipital cortex (Figure 1, bottom panel). This two-way interaction indicates that a relationship between depression and right lateral occipital activation depended on the level of co-occurring anxious apprehension. Tests of simple slopes showed that increased depression was associated with decreased right lateral occipital activation at low levels of anxious apprehension, t(84) = -3.04, p = .002, but increased right lateral occipital activation at high levels of anxious apprehension, t(84) = 3.34, p = .001. Activation in both of these regions also correlated positively with RT interference for negative words (r(89) = .21, p = .046, for right DLPFC, r(89) = .35, p = .001, for right occipital cortex).
Explicit tests of laterality for both of the regions showing two-way interactions confirmed the patterns suggested by each region alone, with increased depression associated with more leftward activation when co-occurring anxiety (anxious arousal for the DLPFC ROI, anxious apprehension for the occipital ROI) was also low and more rightward activation when co-occurring anxiety was high (Figure 2). An Anhedonic Depression × Anxious Arousal interaction emerged for the DLPFC ROI laterality index, t(84) = 3.287, p = .001, when added last, full model F(6, 84) = 2.386, p = .035. An Anhedonic Depression × Anxious Apprehension interaction emerged for the occipital ROI laterality index, t(84) = -2.919, p = .005 when added last, full model F(6, 84) = 1.91, p = .088.
Figure 2.
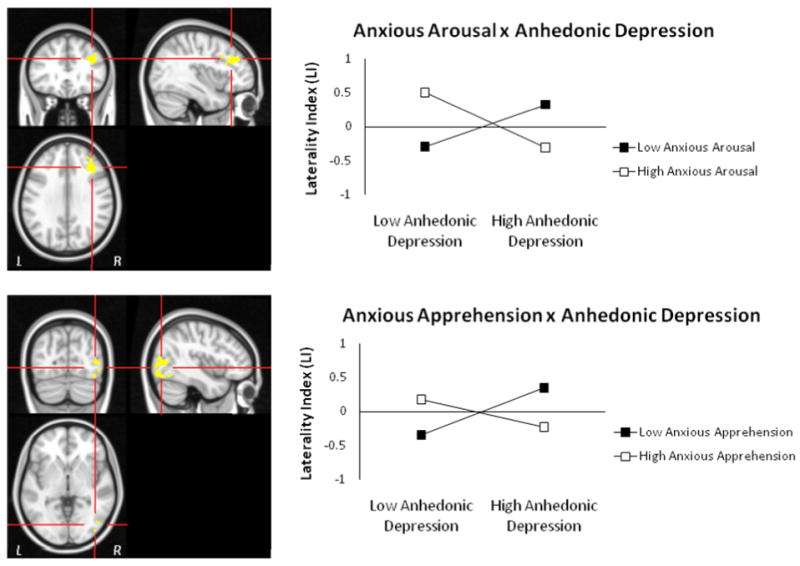
Laterality analyses for regions with two-way interactions for negative – neutral contrast. Graphing of the two-way interactions for the laterality index for the Anhedonic Depression × Anxious Arousal (top panel) and Anhedonic Depression × Anxious Apprehension (bottom panel) ROIs support the interpretation that depression is associated with increased rightward activity when co-occurring anxiety is high.
Four regions (left DLPFC, superior frontal gyrus (SFG), right IFG pars opercularis, and cuneal cortex) with three-way interactions emerged for the negative – neutral contrast (see Table 4). Of the ROIs showing three-way interactions, the left DLPFC, SFG, and right IFG pars opercularis ROIs also correlated positively with the RT interference, r(89) = .30, p = .004, r(89) = .31, p = .002, and r(89) = .20, p = .059, respectively, but the cuneal cortex did not. A priori hypotheses predicted that depression would be associated with reduced left DLPFC activation. As is apparent in Figure 3, the three-way interaction suggests that depression is indeed associated with decreased left DLPFC activation, but only when anxious apprehension is low and anxious arousal is high (Figure 3, top panel). Tests of simple slopes showed that this was the only significant slope, t(83) = -2.35, p = .021. Explicit tests of laterality supported this pattern, with increased depression associated with less left than right DLPFC activation when anxious apprehension was low and anxious arousal was high (Figure 3, bottom panel). An Anhedonic Depression × Anxious Arousal × Anxious Apprehension interaction emerged for the DLPFC ROI laterality index, t(83) = 1.95, p = .055, when added last, although the full model was not significant F(7, 83) = 1.082,, n.s.
Figure 3.
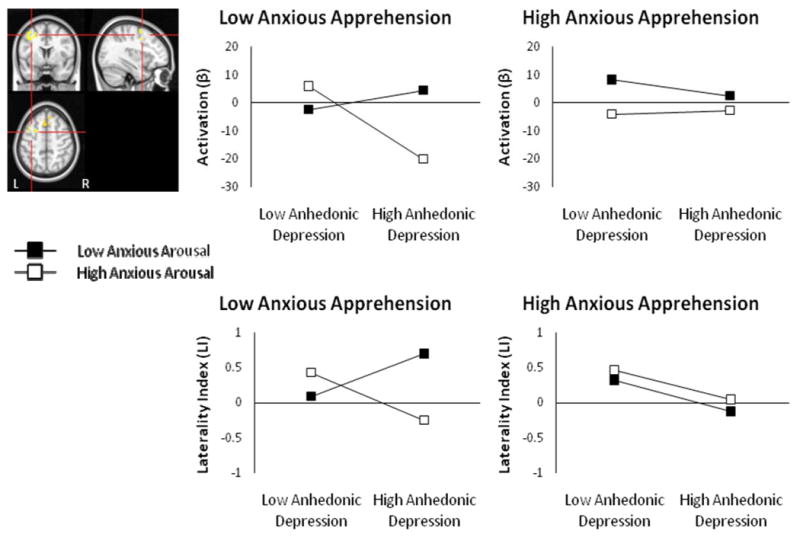
L DLPFC Anhedonic Depression × Anxious Arousal × Anxious Apprehension interaction for negative – neutral contrast. Highlighted voxels are those with z-scores > 2.05 (p < .04) meeting a cluster-size threshold of ≥ 215 (corrected p < .05). Graphing of the three-way interaction show decreased left DLPFC with increased depression, only when anxious apprehension is low and anxious arousal is high (top panel). Graphing of the three-way interaction for this region's laterality index is also shown (bottom panel).
Increased depression was also associated with decreased activation in right IFG pars opercularis when combined with low anxious apprehension and high anxious arousal, t(83) = -2.03, p = .046 (Figure 4, top panel). Explicit tests of laterality indicated that increased depression was associated with greater leftward IFG activation (or less right IFG activation) when anxious apprehension was low and anxious arousal was high (Figure 4, bottom panel). An Anhedonic Depression × Anxious Arousal × Anxious Apprehension interaction emerged for the IFG ROI laterality index, t(83) = -2.749, p = .007, when added last, full model F(7, 83) = 2.04, p = .059.
Figure 4.
R IFG Anhedonic Depression × Anxious Arousal × Anxious Apprehension interaction for negative – neutral contrast. Highlighted voxels are those with z-scores > 2.05 (p < .04) meeting a cluster-size threshold of ≥ 215 (corrected p < .05). Graphing of the three-way interaction show reduced of R IFG with increased depression, only when anxious apprehension is low and anxious arousal is high (top panel). Graphing of the three-way interaction for this region's laterality index is also shown (bottom panel).
Regression analyses for each voxel were repeated using the arousal contrast (positive and negative compared to neutral) to test hypotheses regarding arousal-related posterior asymmetry. An Anhedonic Depression × Anxious Arousal interaction emerged for the right middle temporal/inferior temporal gyrus (Figure 5). This region overlapped with the region identified as active for the anxious arousal group for negative – neutral words in Engels et al. (2007) and also with the region identified as more active for negative high arousal than low arousal words in Compton et al. (2003). Activation in this region also correlated positively with RT interference for high arousal words, r(89) = .27, p = .011. Tests of simple slopes showed that right-posterior activation decreased as depression levels increased when anxious arousal was low, t(84) = -2.41, p = .018, but showed the opposite pattern when anxious arousal was high t(84) = 3.14, p = .002 (Figure 5, top panel). Explicit tests of laterality supported this pattern, with increased depression associated with more leftward activation when anxious arousal was also low and more rightward activation when anxious arousal was high (Figure 5, bottom panel). An Anhedonic Depression × Anxious Arousal interaction for the temporal ROI laterality index supported this pattern, t(84) = -2.979, p = .004, when added last, full model F(6, 84) = 2.694, p = .019.
Three additional regions showed a similar Anhedonic Depression × Anxious Arousal interaction for the arousal contrast, two of which were also in the right hemisphere (also visible in Figure 5), including right DLPFC (42, 25, 29) and bilateral postcentral gyrus (41, -23, 39; -54, -16, 40). The Anhedonic Depression × Anxious Arousal interaction for the right DLPFC overlapped with the region in Figure 1, suggesting that this interactive effect is due to arousal and is not specific to negative words.
Unique Variance for Anhedonic Depression and Shared Variance with Anxiety
Table 5 lists the regions for the negative – neutral contrast where anhedonic depression captured unique variance (with the variance associated with anxious arousal and anxious apprehension removed). Anhedonic depression captured unique variance in both dorsal anterior cingulate (dACC) and rostral anterior cingulate (rACC) (Figure 6, left panel). A comparison to the maps for the anxious apprehension and anxious arousal scales showed that only anhedonic depression captured unique variance in dACC and rACC. Activation in both of these regions was also correlated with RT interference across all 91 subjects, such that the greater the activation in these regions for the negative – neutral contrast, the greater the observed interference (r(89) = .27, p = .009, for dACC, r(89) = .30, p = .004, for rACC). Table 5 also lists the results of a conjunction analysis for anhedonic depression and anxious arousal for the negative – neutral contrast (no other conjunction analysis was significant). This analysis identified a posterior cingulate region in common for anhedonic depression and anxious arousal (Figure 6, right panel), implicating this region in both types of psychopathology.
Figure 6.
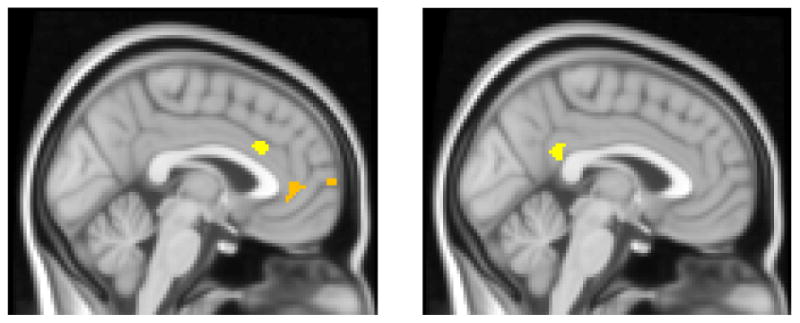
Regions where anhedonic depression captured unique variance or shared variance with anxious arousal for negative – neutral contrast. Highlighted voxels are those with z-scores > 2.17 (p < .03), cluster size ≥ 156 voxels (corrected p < .05), display slice x = -2. Left panel: Anhedonic depression captured unique variance in dACC and rACC. Right Panel: Posterior cingulate region identified from the Anhedonic Depression & Anxious Arousal conjunction analysis.
Anhedonic Depression, Anxiety, and Amygdala Activation
Zero-order correlations of psychopathology scales and left and right amygdala showed that Anhedonic Depression and Anxious Arousal were each positively correlated with amygdala activation for the negative – neutral contrast. For the left amygdala ROI, Anhedonic Depression showed r(89) = .16, p = .065, and Anxious Arousal showed r(89) = .20, p = .026, both one-tailed. For the right amygdala ROI, Anhedonic Depression showed r(89) = .19, p = .038, and Anxious Arousal showed r(89) = .193, p = .034, both one-tailed. Anxious Apprehension showed no relationship to either left or right amygdala activation. Anhedonic Depression and Anxious Arousal were then entered into hierarchical regressions to examine unique variance and interactive effects. Neither Anhedonic Depression nor Anxious Arousal captured unique variance for either right or left amygdala activation (both were nonsignificant when added last, see Table 6). A trend emerged for the Anhedonic × Anxious Arousal interaction for the right amygdala (p = .092, one-tailed). No relationship was found between psychopathology questionnaires and the amygdala laterality index. The left and right amygdala ROIs also positively correlated with RT interference for negative words, r(89) = .19, p = .036 and r(89) = .283, p = .003, respectively (both one-tailed).
Table 6. Anhedonic Depression, Anxious Arousal, and Amygdala Activation for Negative – Neutral Contrast (N=91).
| L Amygdala | R2 | Δ R2 | Test | P | |
|---|---|---|---|---|---|
| Anhedonic Depression (MASQAD8) | Added First | .026 | t(89) = 1.53 | .065 | |
| Added Second | .003 | t(88) = .53 | NS | ||
| Anxious Arousal (MASQAA) | Added First | .042 | t(89) = 1.96 | .026 | |
| Added Second | .019 | t(88) = 1.32 | .095 | ||
| Full Model 1 | .045 | F(2,88) = 2.05 | .134 | ||
| Anhedonic Depression × Anxious Arousal (MASQAD8 × MASQAA) | Added Third | .001 | t(87) = -.34 | NS | |
| Full Model 2 | .046 | F(3,87) = 1.39 | NS | ||
| R Amygdala | R2 | Δ R2 | Test | P | |
|
| |||||
| Anhedonic Depression (MASQAD8) | Added First | .035 | t(89) = 1.80 | .038 | |
| Added Second | .009 | t(88) = .92 | NS | ||
| Anxious Arousal (MASQAA) | Added First | .037 | t(89) = 1.85 | .034 | |
| Added Second | .011 | t(88) = 1.02 | NS | ||
| Full Model 1 | .046 | F(2,88) = 2.14 | .124 | ||
| Anhedonic Depression × Anxious Arousal (MASQAD8 × MASQAA) | Added Third | .019 | t(87) = -1.34 | .092 | |
| Full Model 2 | .066 | F(3,87) = 2.04 | .115 | ||
Discussion
The results of the present study add to a small but growing literature providing converging evidence from fMRI (Herrington et al., in press; Johnstone et al., 2007) of greater rightward lateralization in depression, often observed in EEG studies (Davidson, 2004). Present findings are important because they pinpoint a specific region in DLPFC that showed this lateralized pattern of activity. Localization of rightward lateralization to DLPFC is consistent with Davidson's (2004) suggestion that this region is likely to be the source of the observed EEG asymmetries. Of note, however, this pattern emerged only when co-occurring anxious arousal was high and anxious apprehension was either low (Figure 3) or of no consequence (Figure 2), indicating that depression and anxiety interact to moderate activity of DLPFC.
The dimensional approach used in this study complements the group approach we used in Herrington et al. (in press; no subjects in common). In Herrington et al., a carefully selected group of participants with high anhedonic depression but low anxious apprehension and anxious arousal exhibited greater rightward asymmetry in a similar region of DLPFC for the same contrast of negative to neutral words. Thus, in both studies, taking anxiety into account revealed a pattern of decreased left DLPFC and increased right DLPFC in depression, suggesting abnormal processing on a task where top-down control is required to regulate attention and manage interference from emotional distractors.
In Herrington et al. (in press), depression, in the absence of co-occurring anxiety, was associated with a rightward bias of activation in DLPFC. In the present study, rightward bias in depression was modulated by anxiety type, in particular by the combination of high anxious arousal and low anxious apprehension. Present findings that anxious arousal is important in producing rightward bias in depression should not be taken as contradictory to Herrington et al. (in press). At least some depressed individuals who do not report high levels of anxious arousal (and who therefore made it into the depressed group reported in Herrington et al., in press) may nonetheless find negative words to be more arousing or threatening than nondepressed individuals, such that those words bias the brain toward right-hemisphere attentional and cognitive processes involved in monitoring, processing, and responding to threat stimuli (Nitschke et al., 2000). Higher self-reported anxious arousal, when combined with depression, as assessed by dimensional analyses in the present study, may result in a more consistent pattern in which negative word meanings reliably capture attention and bias the brain toward responding to threat. Thus, less left and more right DLPFC activation in depression may depend largely on the degree to which stimuli are perceived as behaviorally salient and threatening (consistent with Davidson, 2004, that asymmetries may be more apparent in studies involving a response component, assuming that threat elicits response readiness). The degree to which stimuli are perceived as potentially threatening may directly relate to the degree of anxious arousal, a type of anxiety in which attention to environmental threat and somatic preparation for adaptive response are paramount. Furthermore, results highlight the utility of a dimensional approach to assess relevant symptom effects. A group approach, in which participants are categorized clinically based on the presence or absence of Axis I or II disorders, may not allow as sensitive an assessment of the impact of relevant symptoms of psychopathology on brain activity.
Anxious apprehension in previous research (Engels et al., 2007) was accompanied by increased activity in left IFG. A tendency to activate left IFG may obscure or counteract rightward biases in brain activity when depression co-occurs with anxious apprehension. In Engels et al. (2007) we suggested that increased left IFG activity in anxious apprehension may reflect more semantic processing of the word stimuli. Anxious apprehension typically involves elaborative verbal processing about future, not proximal, events, and the negative words may not elicit as immediate a threat response when depression is accompanied by anxious apprehension. A related possibility is that anxious apprehension or worry is accompanied by other psychological factors such as perfectionism that enhance the salience of the task set and boost activation in DLPFC.
Somewhat puzzling is the fact that higher activity in left DLPFC was correlated with more interference, i.e., worse performance, challenging an interpretation that less left DLPFC indicates a malfunction in top-down attentional control. In light of equivalent behavioral performance for participants, the positive correlation between activation and RT interference could reflect the fact that the paradigm requires activation in multiple cognitive control regions for effective task performance, and the more distracting the information, the more activation required to maintain task set. An increase in rACC, dACC, or more left than right IFG activity could reflect compensation by regions other than DLPFC important for exertion of cognitive control (e.g., Milham et al., 2002; Silton et al., under review), effectively canceling any deleterious effects on performance that would otherwise arise from less left DLPFC activation.
A three-way interaction was also found in this study for right IFG, in which less activity was associated with higher depression and anxious arousal, when anxious apprehension was low. A number of studies have shown activity in right IFG on tasks that require the inhibition of a dominant response, suggesting an important role for this region in executive function and cognitive control (Aron, Fletcher, Bullmore, Sahakian, & Robbins, 2003; Aron, Robbins, & Poldrack, 2004). Present findings suggest that depression combined with anxious arousal involves difficulties in inhibiting a tendency to respond to the emotional meaning of the word. The fact that depression and anxiety are not associated with deficits in performance (i.e. more interference, reflecting more attentional capture by negative words) is likely to reflect compensatory activity in other brain regions. In particular, ACC, which showed more activity for depression here, has been suggested as playing an important role in exerting top-down attentional control to compensate for failures of control by other brain regions (Milham et al., 2002).
Another perspective situates right IFG in a ventral frontoparietal network that detects salient and behaviorally relevant stimuli in the environment, especially when that information is unattended (Corbetta, Patel, & Shulman, 2008). To the degree that word meanings in the emotional Stroop task are perceived as behaviorally relevant, they might be expected to capture attention, which would increase interference on the task. If this interpretation is correct, the combination of high depression and high anxious arousal may create a bias of attention toward task-irrelevant negative word meanings that requires active suppression of right IFG in order to neutralize detrimental effects of psychopathology on performance. If so, it seems likely that other brain regions involved in top-down control are acting to modulate right IFG (e.g., dACC or rACC, in which more activity was associated with higher depression in this study). It remains for future research to examine more closely the connectivity and timing of their interactions in order to clarify further the relationship of psychopathology dimensions, brain activity, and performance in the context of this paradigm.
Anxious arousal also modulated depression-related activity in right-posterior regions of the brain hypothesized to modulate arousal, vigilance, and other aspects of adaptive threat response (Nitschke et al., 2000, Nitschke et al., 2005). The right middle temporal/inferior temporal gyrus region that emerged in these analyses (Figure 5) overlapped with the region identified as active for the anxious arousal group for negative – neutral words in Engels et al. (2007) and also with the region identified as more active for negative high arousal than low arousal words in Compton et al. (2003). Activation in this region also correlated positively with RT interference for high arousal words. Thus, whereas the effect of depression on frontal regions was augmented by anxious arousal, anxious arousal undermined the effect of depression on right-posterior activation. The findings suggest that some cognitive deficits in depression associated with impairments in right-posterior processing (e.g., face processing: Deldin, Keller, Gergen, & Miller, 2000) emerge only when depression is not accompanied by anxious arousal, as Keller et al. (2000) showed via neuropsychological testing.
Finally, an interaction of depression and anxious apprehension appeared for right occipital cortex. This region overlaps a region of activation for negative compared to neutral words in an emotion-word Stroop task using unselected participants (Compton et al., 2003). We and others have suggested that a right-lateralized frontoparietal network that extends to temporal and occipital regions is involved in detecting and responding to threat (e.g., a right-hemisphere surveillance system, e.g., Bear, 1986; Nitschke et al., 2000; Compton et al., 2003; Corbetta et al., 2008). The presence of interactions between depression and different anxiety types for different right-posterior regions suggests that both anxious apprehension and anxious arousal may be associated with activity in this system, but at different spatial locations and time courses.
Other brain regions showed increased activation associated with depression alone or both depression and anxiety types independently. Anhedonic depression captured unique variance in both dACC and rACC (Figure 6). Present results are consistent with ACC results from Mitterschiffthaler et al. (2008), who found more ACC activation in patients with MDD (with no other Axis I comorbidity) than for controls during an emotional Stroop task. Research has pointed to differential engagement of ACC subdivisions for cognitive and emotional functions (Bush, Luu, & Posner, 2000). Mohanty et al. (2007) were the first to demonstrate directly that dACC was more active for incongruent than neutral words during the standard color-word Stroop task, whereas rACC was more active for negative than neutral words during the emotion-word Stroop task. However, a strict separation of cognitive and emotional functions for ACC subdivisions was not supported. Regression results showed that dACC and DLPFC showed strong connectivity even during the emotion-word Stroop task, suggesting that dACC is important for implementing cognitive control even in the presence of emotional distractors. In addition, dACC and rACC both uniquely predicted amygdala activation, suggesting that dACC and rACC both play a role in emotion regulation (Mohanty et al., 2007). Increased ACC activation may reflect increased conflict due to a bias toward potential threat with consequently greater need for regulating emotional responses and suppressing inappropriate attentional capture by emotional distractors (Bush et al., 2000; Mitterschiffthaler et al., 2008; Mohanty et al., 2007; Phan, Wager, Taylor, & Liberzon, 2002).
A distinct, more posterior cingulate region emerged in a conjunction analysis for the anhedonic depression and anxious arousal scales. Increased posterior cingulate activation has previously been associated with increased negative affect and anxiety symptom intensity. For example, the posterior cingulate was more active when participants were instructed to increase their negative affect in response to negative pictures than when they were instructed to decrease it (Ochsner et al., 2004). Anxiety symptoms also correlated positively with posterior cingulate activation in a group of patients with major depression (Bench, Friston, Brown, Frackowiak, & Dolan, 1993) or obsessive-compulsive disorder (McGuire et al., 1994). Participants with panic disorder showed greater posterior cingulate activation when making judgments of threat-related stimuli (Maddock, Buonocore, Kile, & Garrett, 2003). The posterior cingulate cortex is also consistently activated by salient emotional stimuli and is theorized to be important in the interaction of emotion and memory processes and in regulating emotional responses (Maddock, 1999; Maddock & Buonocore, 1997; Maddock et al., 2003; Maddock, Garrett, Buonocore, 2003; Pessoa & Padmala, 2005). Present results further implicate the posterior cingulate as an important region in attention to emotional information and suggest that posterior cingulate activation observed in the studies reviewed above is due to increased negative affect. Because depression and anxious arousal shared variance in this region, and no moderating effects of co-occurring anxiety emerged, activation in this region may be expected for similar paradigms regardless of specific patterns of co-occurring anxiety and depression symptoms.
A priori amygdala analyses (Table 6) showed that anhedonic depression and anxious arousal were both positively correlated with activation in left and right amygdala for negative compared to neutral words. However, neither anhedonic depression nor anxious arousal captured unique variance in this region. Anxious apprehension showed no relationship to amygdala activation. Amygdala activation was also related to behavioral performance, such that an increase in RT interference was associated with an increase in amygdala activation. Results are consistent with those of Herrington et al. (in press) in which differences were found in amygdala activation in depressed individuals compared to controls for negative versus neutral words. However, unlike Herrington et al., direct tests of laterality for amygdala were not significant. Present results suggest that depression and anxious arousal are similarly related to increases in amygdala activation.
Implications for Executive Function Deficits in Depression
Because patterns of asymmetric brain activity have been proposed to account for the deficits in executive and other cognitive functions observed in depression (Levin, Heller, Mohanty, Herrington, & Miller, 2007), neuroimaging research using experimentally controlled anxiety and depression is important to elucidate their neural mechanisms. The emotion-word Stroop task can be conceptualized as a task of executive function in that the individual must engage top-down control to ignore the distracting emotional meaning of the word to identify the color. Furthermore, the task engages prefrontal regions known to be involved in top-down attentional control, specifically left DLPFC and dACC (e.g., Banich et al., 2009; Botvinick, 2008; Compton et al., 2003; Herrington et al., in press). This task thus provides a possible link to understanding executive function deficits in depression.
One potential limitation of present results is the absence of significant behavioral effects. The absence of any effects of psychopathology dimensions on interference makes it difficult to interpret patterns of activation as reflecting an executive function deficit per se. Even in clinical samples, group behavioral differences are not always obtained for affective challenge tasks (e.g., Elliott et al., 2002; George et al., 1997), and group differences in RT interference were nonsignificant in Herrington et al. (in press). However, because cognitive control involves neural networks, deficits in one region may be offset by more activity in another region, such that performance is maintained (e.g., Milham et al., 2002). It is also possible that the effect of anxiety as a moderator on the pattern brain activation in depression may manifest differently in a task that shows significant behavioral effects or does not involve an emotional component.
Thus, there is some basis for speculation regarding the link between brain activity and executive function in depression. Left DLPFC is important for imposing an attentional set or bias for the information to be attended, especially when processing of the to-be-attended information is less automatic than that of the task-irrelevant information (Banich et al., 2000; Compton et al., 2003; Milham et al., 2002). In particular, the posterior portion of DLPFC (BA 8/6) that showed a three-way interaction here is involved in allocating attention to competing stimuli in the environment (Petrides, 2005) and top-down biasing toward task-relevant information, creating an “attentional set” (Banich et al., 2000). Reduced activation in this area may reflect difficulty in task-relevant attentional allocation and failure to engage appropriate top-down processing to mediate attentional demands, potentially accounting for reported deficits in concentration in depression.
Mid-DLPFC (BA 9/46), which showed an interaction between anxious arousal and anhedonic depression, is associated with working memory (Petrides, 2000, 2005). In the present task, this region may be inappropriately engaged with processing representations of threat words, interfering with allocation of attention to the color of the words, the task-relevant dimension. In real world situations, mood-congruent attentional biases in depression with co-occurring anxious arousal may interfere with engagement of brain regions important for task performance, resulting in well-established deficits in memory (for review, see Levin et al., 2007). Further research is needed to link specific patterns of brain activity with specific executive function deficits in depression and co-occurring anxiety.
Treatment Implications
The patterns of brain activation that emerged in the present investigation also have implications for treatment. For example, transient suppression of right DLPFC activity via slow repetitive transcranial magnetic stimulation (rTMS) has been shown to be related to improvement on an emotional go/no task for depressed patients. For depressed patients, the higher the rated depression, the more the patient improved on the task following right prefrontal rTMS (Bermpohl et al., 2006). Consistent with explanations above of results in the present study, hyperactive rACC for depression was theorized to represent an adaptive, compensatory response in clinical depression, since patients with more active rACC showed better recovery (Pizzagalli et al., 2001). Higher rates of co-occurring anxiety and depression tend to be found in more severe conditions, and their co-occurrence negatively affects aspects of psychopathology such as course, chronicity, and relapse (e.g., Brown, Antony, & Barlow, 1995; Gaynes et al., 1999; Ghaziuddin, King, Naylor, & Ghaziuddin, 2000; Kessler, Chiu, Demler, & Walters, 2005; Sherbourne & Wells, 1997; see Mineka, Watson, & Clark, 1998, for review). Thus, understanding how co-occurring anxiety affects brain activation patterns for depression could inform potential treatment trajectories.
Besides these substantive implications, present results offer a methodological caution for studies of brain activity, laterality, emotion, and psychopathology. Striking interactions clearly indicate that co-occurring symptoms of depression and anxiety significantly complicate observed patterns of activation. Inconsistencies in the literature may be due to different (and typically unassessed) combinations of anxious and depressive symptoms across studies.
In summary, present findings indicate that depression and co-occurring anxiety types separately and jointly influence patterns of brain activation during emotion processing, contributing to a greater understanding of the neural mechanisms of psychopathology. Rightward frontal lateralization in depression depended on elevated anxious arousal and simultaneously low anxious apprehension. Right-posterior activation was complicated by an interaction of anxious arousal and anhedonic depression, supporting predictions that this region of the brain would be modulated by arousal effects of anxiety. Anhedonic depression captured unique variance in dACC and rACC and shared variance with anxious arousal in posterior cingulate and amygdala. Interactive effects imply that depression, particularly when accompanied by anxious arousal, results in a failure to implement appropriate top-down processing in order to mediate attentional demands due to increased activation in regions associated with responding to emotionally salient information. Present findings thus elucidate possible brain mechanisms of the well-established deficits in aspects of executive function in depression, such as concentration and memory (reviewed in Levin et al., 2007). In addition, depression-related deficits in cognitive processes associated with right-posterior functions may emerge only in the absence of anxious arousal. Put differently, when anxious arousal co-occurs with depression, it may cause difficulty, or increase difficulty, in one type of cognitive processing (top-down attentional control, or selective attention, associated with left prefrontal processing) but may provide a buffer against difficulties in another type of cognitive processing (visual-spatial, including face processing, associated with right-posterior functions). The patterns of activation observed thus provide important insights into brain mechanisms involved in cognitive control and information processing for different types and combinations of psychopathology when individuals are confronted with a cognitive task in the context of unpleasant information.
Acknowledgments
This research was supported by National Institute of Drug Abuse (R21 DA14111), the National Institute of Mental Health (R01 MH61358, T32 MH19554, P50 MH079485), and the University of Illinois Beckman Institute and Intercampus Research Initiative in Biotechnology. The authors thank Adrienne Abramowitz, Emily Cahill, Joscelyn E. Fisher, John D. Herrington, Brenda Hernandez, Aprajita Mohanty, Sarah M. Sass, Rebecca Levin Silton, and Jennifer L. Stewart for their contributions to this project.
Contributor Information
Anna S. Engels, Department of Psychology, Pennsylvania State University
Wendy Heller, Department of Psychology and Beckman Institute Biomedical Imaging Center, University of Illinois at Urbana-Champaign.
Jeffrey M. Spielberg, Department of Psychology, University of Illinois at Urbana-Champaign
Stacie L. Warren, Department of Psychology, University of Illinois at Urbana-Champaign
Bradley P. Sutton, Department of Bioengineering and Beckman Institute Biomedical Imaging Center, University of Illinois at Urbana-Champaign
Marie T. Banich, Department of Psychology and Neuroscience and Institute of Cognitive Science, University of Colorado at Boulder
Gregory A. Miller, Department of Psychology, Department of Psychiatry, and Beckman Institute Biomedical Imaging Center, University of Illinois at Urbana-Champaign
References
- Aguirre GK, Zarahn E, D'Esposito M. The variability of human BOLD hemodynamic response. NeuroImage. 1998;8:360–369. doi: 10.1006/nimg.1998.0369. [DOI] [PubMed] [Google Scholar]
- Aiken LS, West SG. Multiple regression: Testing and interpreting interactions. Thousand Oaks, CA: Sage Publications, Inc.; 1991. [Google Scholar]
- Aron AR, Fletcher PC, Bullmore ET, Sahakian BJ, Robbins TW. Stop-signal inhibition disrupted by damage to right inferior frontal gyrus in humans. Nature Neuroscience. 2003;6:115–116. doi: 10.1038/nn1003. [DOI] [PubMed] [Google Scholar]
- Aron AR, Robbins TW, Poldrack RA. Inhibition and the right inferior frontal cortex. Trends in Cognitive Sciences. 2004;8:170–177. doi: 10.1016/j.tics.2004.02.010. [DOI] [PubMed] [Google Scholar]
- Banich MT, Mackiewicz KL, Depue BE, Whitmer A, Miller GA, Heller W. Cognitive control mechanisms, emotion, & memory: A neural perspective with implications for psychopathology. Neuroscience and Biobehavioral Reviews. 2009;33:613–630. doi: 10.1016/j.neubiorev.2008.09.010. [DOI] [PMC free article] [PubMed] [Google Scholar]
- Banich MT, Milham MP, Atchley RA, Cohen NJ, Webb A, Wszalek T, et al. Prefrontal regions play a predominant role in imposing an attentional ‘set’: Evidence from fMRI. Cognitive Brain Research. 2000;10:1–9. doi: 10.1016/S0926-6410(00)00015-X. [DOI] [PubMed] [Google Scholar]
- Bear DM. Hemispheric asymmetries in emotional function: A reflection of lateral specialization in cortical-limbic connections. In: Doane BK, Livingston KE, editors. The Limbic System: Functional Organization and Clinical Disorders. New York: Raven Press; 1986. pp. 29–42. [Google Scholar]
- Bench CJ, Friston KJ, Brown RG, Frackowiak RSJ, Dolan RJ. Regional cerebral blood flow in depression measured by positron emission tomography: The relationship with clinical dimensions. Psychological Medicine. 1993;23:579–590. doi: 10.1017/s0033291700025368. [DOI] [PubMed] [Google Scholar]
- Bermpohl F, Fregni F, Boggio PS, Thut G, Northoff G, Otachi PTM, et al. Effect of low-frequency transcranial magnetic stimulation on an affective go/no-go task in patients with major depression: Role of stimulation site and depression severity. Psychiatry Research. 2006;141:1–13. doi: 10.1016/j.psychres.2005.07.018. [DOI] [PubMed] [Google Scholar]
- Botvinick MM. Hierarchical models of behavior and prefrontal function. Trends in Cognitive Sciences. 2008;12:201–208. doi: 10.1016/j.tics.2008.02.009. [DOI] [PMC free article] [PubMed] [Google Scholar]
- Bradley MM, Lang PJ. Affective norms for English words (ANEW) Gainesville, FL: University of Florida, NIMH Center for the Study of Emotion and Attention; 1998. [Google Scholar]
- Brown TA, Antony MM, Barlow DH. Diagnostic comorbidity in panic disorder: Effect on treatment outcome and course of comorbid diagnoses following treatment. Journal of Consulting and Clinical Psychology. 1995;63:408–418. doi: 10.1037/0022-006X.63.3.408. [DOI] [PubMed] [Google Scholar]
- Brown TA, Campbell LA, Lehman CL, Grisham JR, Mancill RB. Current and lifetime comorbidity of the DSM-IV anxiety and mood disorders in a large clinical sample. Journal of Abnormal Psychology. 2001;110:585–599. doi: 10.1037/0021-843X.110.4.585. [DOI] [PubMed] [Google Scholar]
- Bruder GE, Fong R, Tenke CE, Leite P, Towey JP, Stewart JE, et al. Regional brain asymmetries in major depression with or without an anxiety disorder: A quantitative electroencephalographic study. Biological Psychiatry. 1997;41:939–948. doi: 10.1016/S0006-3223(96)00260-0. [DOI] [PubMed] [Google Scholar]
- Bruder GE, Stewart JW, Tenke CE, McGrath PJ, Leite P, Bhattacharya N, et al. Electroencephalographic and perceptual asymmetry differences between responders and nonresponders to an SSRI antidepressant. Biological Psychiatry. 2001;49:416–425. doi: 10.1016/S0006-3223(00)01016-7. [DOI] [PubMed] [Google Scholar]
- Bush G, Luu P, Posner MI. Cognitive and emotional influences in anterior cingulate cortex. Trends in Cognitive Sciences. 2000;4:215–222. doi: 10.1016/S1364-6613(00)01483-2. [DOI] [PubMed] [Google Scholar]
- Coan J, Allen J. Frontal EEG asymmetry as a moderator and mediator of emotion. Biological Psychology. 2004;67:7–49. doi: 10.1016/j.biopsycho.2004.03.002. [DOI] [PubMed] [Google Scholar]
- Compton RJ, Banich MT, Mohanty A, Milham MP, Miller GA, Scalf PE, et al. Paying attention to emotion: An fMRI investigation of cognitive and emotional Stroop tasks. Cognitive, Affective, and Behavioral Neuroscience. 2003;3:81–96. doi: 10.3758/CABN.3.2.81. [DOI] [PubMed] [Google Scholar]
- Corbetta M, Patel G, Shulman GL. The reorienting system of the human brain: From environment to theory of mind. Neuron. 2008;58:306–324. doi: 10.1016/j.neuron.2008.04.017. [DOI] [PMC free article] [PubMed] [Google Scholar]
- Davidson RJ. What does the prefrontal cortex “do” in affect: perspectives on frontal EEG asymmetry research. Biological Psychiatry. 2004;67:219–233. doi: 10.1016/j.biopsycho.2004.03.008. [DOI] [PubMed] [Google Scholar]
- Dawson JF, Richter AW. Probing three-way interactions in moderated multiple regression: Development and application of a slope difference test. Journal of Applied Psychology. 2006;91:917–926. doi: 10.1037/0021-9010.91.4.917. [DOI] [PubMed] [Google Scholar]
- Deldin PJ, Keller J, Gergen JA, Miller GA. Right-posterior face-processing anomaly in depression. Journal of Abnormal Psychology. 2000;109:116–121. doi: 10.1037/0021-843X.109.1.116. [DOI] [PubMed] [Google Scholar]
- Elliot R, Rubinsztein JS, Sahakian BJ, Dolan RJ. The neural basis of mood-congruent processing biases in depression. Archives of General Psychiatry. 2002;59:597–604. doi: 10.1001/archpsyc.59.7.597. [DOI] [PubMed] [Google Scholar]
- Engels AS, Heller W, Mohanty A, Herrington JD, Banich MT, Webb AG, et al. Specificity of regional brain activity in anxiety types during emotion processing. Psychophysiology. 2007;44:352–363. doi: 10.1111/j.1469-8986.2007.00518.x. [DOI] [PubMed] [Google Scholar]
- Fitzgerald PB, Oxley TJ, Laird AR, Kulkarni J, Egan GF, Daskalakis ZJ. An analysis of functional neuroimaging studies of dorsolateral prefrontal cortical activity in depression. Psychiatry Research. 2006;148:33–45. doi: 10.1016/j.psychresns.2006.04.006. [DOI] [PubMed] [Google Scholar]
- Gaynes BN, Magruder KM, Burns BJ, Wagner R, Yarnall KSH, Broadhead WE. Does a coexisting anxiety disorder predict persistence of depressive illness in primary care patients with major depression? General Hospital Psychiatry. 1999;21:158–167. doi: 10.1016/S0163-8343(99)00005-5. [DOI] [PubMed] [Google Scholar]
- George MS, Ketter TA, Parekh PI, Rosinsky N, Ring HA, Pazzaglia PJ, et al. Blunted left cingulate activation in mood disorder subjects during a response interference task (the Stroop) Journal of Neuropsychiatry. 1997;9:55–63. doi: 10.1176/jnp.9.1.55. [DOI] [PubMed] [Google Scholar]
- Ghaziuddin N, King CA, Naylor MW, Ghaziuddin M. Anxiety contributes to suicidality in depressed adolescents. Depression and Anxiety. 2000;11:134–138. doi: 10.1002/(SICI)1520-6394(2000)11:3<134::AID-DA9=3.0.CO;2-V. [DOI] [PubMed] [Google Scholar]
- Heller W. The neuropsychology of emotion: Developmental patterns and implications for psychopathology. In: Stein N, Leventhal BL, Trabasso T, editors. Psychological and biological approaches to emotion. Hillsdale, NJ: Erlbaum; 1990. pp. 167–211. [Google Scholar]
- Heller W. Neuropsychological mechanisms of individual differences in emotion, personality, and arousal. Neuropsychology. 1993;7:476–489. doi: 10.1037/0894-4105.7.4.476. [DOI] [Google Scholar]
- Heller W, Nitschke JB. The puzzle of regional brain activity in depression and anxiety: The importance of subtypes and comorbidity. Cognition & Emotion. 1998;12:421–447. doi: 10.1080/026999398379664. [DOI] [Google Scholar]
- Heller W, Nitschke JB, Etienne MA, Miller GA. Patterns of regional brain activity differentiate types of anxiety. Journal of Abnormal Psychology. 1997;106:376–385. doi: 10.1037/0021-843X.106.3.376. [DOI] [PubMed] [Google Scholar]
- Herrington JD, Mohanty A, Koven NS, Fisher JE, Stewart JL, Banich MT, et al. Emotion-modulated performance and activity in left dorsolateral prefrontal cortex. Emotion. 2005;5:200–207. doi: 10.1037/1528-3542.5.2.200. [DOI] [PubMed] [Google Scholar]
- Herrington JD, Heller W, Mohanty A, Engels AS, Banich MT, Webb AG, Miller GA. Localization of asymmetric brain function in emotion and depression. Psychophysiology. doi: 10.1111/j.1469-8986.2009.00958.x. in press. [DOI] [PMC free article] [PubMed] [Google Scholar]
- Jenkinson M, Bannister P, Brady M, Smith S. Improved optimization for the robust and accurate linear registration and motion correction of brain images. NeuroImage. 2002;17:825–841. doi: 10.1016/S1053-8119(02)91132-8. [DOI] [PubMed] [Google Scholar]
- Jenkinson M, Smith S. A global optimization method for robust affine registration of brain images. Medical Image Analysis. 2001;5:143–156. doi: 10.1016/S1361-8415(01)00036-6. [DOI] [PubMed] [Google Scholar]
- Jezzard P, Balaban RS. Correction for geometric distortion in echo planar images from B0 field variations. Magnetic Resonance in Medicine. 1995;34:65–73. doi: 10.1002/mrm.1910340111. [DOI] [PubMed] [Google Scholar]
- Johnstone T, van Reekum CM, Urry HL, Kalin NH, Davidson RJ. Failure to regulate: Counterproductive recruitment of top-down prefrontal-subcortical circuitry in major depression. Journal of Neuroscience. 2007;27:8877–8884. doi: 10.1523/JNEUROSCI.2063-07.2007. [DOI] [PMC free article] [PubMed] [Google Scholar]
- Joorman J, Kosfelder J, Schulte D. The impact of comorbidity of depression on the course of anxiety treatments. Cognitive Therapy and Reserach. 2005;29:569–591. doi: 10.1007/s10608-005-3340-5. [DOI] [Google Scholar]
- Keller J, Nitschke JB, Bhargava T, Deldin PJ, Gergen JA, Miller GA, et al. Neuropsychological differentiation of depression and anxiety. Journal of Abnormal Psychology. 2000;109:3–10. doi: 10.1037/0021-843X.109.1.3. [DOI] [PubMed] [Google Scholar]
- Kentgen LM, Tenke CE, Pine DS, Fong R, Klein RG, Bruder GE. Electroencephalographic asymmetries in adolescents with major depression: Influence of comorbidity with anxiety disorders. Journal of Abnormal Psychology. 2000;109:797–802. doi: 10.1037/0021-843X.109.4.797. [DOI] [PubMed] [Google Scholar]
- Kessler RC, Chiu WT, Demler O, Walters EE. Prevalence, severity, and comorbidity of 12-month DSM-IV disorders in the National Comorbidity Survey Replication. Archives of General Psychiatry. 2005;62:617–627. doi: 10.1001/archpsyc.62.6.617. [DOI] [PMC free article] [PubMed] [Google Scholar]
- Kessler RC, Dupont RL, Berglund P, Wittchen HU. Impairment in pure and comorbid generalized anxiety disorder and major depression at 12 months in two national surveys. American Journal of Psychiatry. 1999;156:1915–1923. doi: 10.1176/ajp.156.12.1915. [DOI] [PubMed] [Google Scholar]
- Levin RL, Heller W, Mohanty A, Herrington JD, Miller GA. Cognitive deficits in depression and functional specificity of regional brain activity. Cognitive Therapy and Research. 2007;31:211–233. doi: 10.1007/s10608-007-9128-z. [DOI] [Google Scholar]
- Maddock RJ. The retrosplenial cortex and emotion: New insights from functional neuroimaging of the human brain. Trends in Neuroscience. 1999;22:310–316. doi: 10.1016/S0166-2236(98)01374-5. [DOI] [PubMed] [Google Scholar]
- Maddock RJ, Buonocore MH. Activation of left posterior cingulate gyrus by the auditory presentation of threat-related words: an fMRI study. Psychiatry Research: Neuroimaging Section. 1997;75:1–4. doi: 10.1016/S0925-4927(97)00018-8. [DOI] [PubMed] [Google Scholar]
- Maddock RJ, Buonocore MH, Kile SJ, Garrett AS. Brain regions showing increased activation by threat-related words in panic disorder. NeuroReport. 2003;14:325–328. doi: 10.1097/00001756-200303030-00006. [DOI] [PubMed] [Google Scholar]
- Maddock RJ, Garrett AS, Buonocore MH. Posterior cingulate cortex activation by emotional words: fMRI evidence from a valence decision task. Human Brain Mapping. 2003;18:30–41. doi: 10.1002/hbm.10075. [DOI] [PMC free article] [PubMed] [Google Scholar]
- McGuire PK, Bench CJ, Frith CD, Marks IM, Frackowiak RSJ, Dolan RJ. Functional anatomy of obsessive-compulsive phenomena. British Journal of Psychiatry. 1994;164:459–468. doi: 10.1192/bjp.164.4.459. [DOI] [PubMed] [Google Scholar]
- Meyer TJ, Miller ML, Metzger RL, Borkovec TD. Development and validation of the Penn State Worry Questionnaire. Behaviour Research and Therapy. 1990;28:487–495. doi: 10.1016/0005-7967(90)90135-6. [DOI] [PubMed] [Google Scholar]
- Miezin FM, Maccotta L, Ollinger JM, Petersen SE, Buckner RL. Characterizing the hemodynamic response: Effects of presentation rate, sampling procedure, and the possibility of ordering brain activity based on relative timing. NeuroImage. 2000;11:735–739. doi: 10.1006/nimg.2000.0568. [DOI] [PubMed] [Google Scholar]
- Milham MP, Erickson KI, Banich MT, Kramer AF, Webb A, Wszalek T, et al. Attentional control in the aging brain: Insights from an fMRI study of the Stroop task. Brain & Cognition. 2002;49:277–296. doi: 10.1006/brcg.2001.1501. [DOI] [PubMed] [Google Scholar]
- Mineka S, Watson D, Clark LA. Comorbidity of anxiety and unipolar mood disorders. Annual Review of Psychology. 1998;49:377–412. doi: 10.1146/annurev.psych.49.1.377. [DOI] [PubMed] [Google Scholar]
- Mitterschiffthaler M, Williams S, Walsh N, Cleare A, Donaldson C, Scott J, et al. Neural basis of the emotional Stroop interference effect in major depression. Psychological Medicine. 2008;38:247–256. doi: 10.1017/S0033291707001523. [DOI] [PubMed] [Google Scholar]
- Mohanty A, Engels AS, Herrington JD, Heller W, Ho MHR, Banich MT, et al. Differential engagement of anterior cingulate cortex subdivisions for cognitive and emotional function. Psychophysiology. 2007;44:343–351. doi: 10.1111/j.1469-8986.2007.00515x. [DOI] [PubMed] [Google Scholar]
- Molina S, Borkovec TD. The Penn State Worry Questionnaire: Psychometric properties and associated characteristics. In: Davey GCL, Tallis F, editors. Worrying: Perspectives on theory, assessment and treatment. Chichester, England: Wiley; 1994. pp. 265–283. [Google Scholar]
- Nichols T, Brett M, Andersson J, Wager T, Poline JB. Valid conjunction inference with the minimum statistic. NeuroImage. 2005;25:653–660. doi: 10.1016/j.neuroimage.2004.12.005. [DOI] [PubMed] [Google Scholar]
- Nitschke JB, Heller W. Distinguishing the neural substrates of heterogeneity among anxiety disorders. In: Glabus M, editor. International Review of Neurobiology Vol 67, Neuroimaging, Part B. 2005. [DOI] [PubMed] [Google Scholar]
- Nitschke JB, Heller W, Imig JC, McDonald RP, Miller GA. Distinguishing dimensions of anxiety and depression. Cognitive Therapy and Research. 2001;25:1–22. doi: 10.1023/A:1026485530405. [DOI] [Google Scholar]
- Nitschke JB, Heller W, Miller GA. Anxiety, stress, and cortical brain function. In: Borod JC, editor. The neuropsychology of emotion. New York: Oxford; 2000. pp. 298–319. [Google Scholar]
- Nitschke JB, Heller W, Palmieri PA, Miller GA. Contrasting patterns of brain activity in anxious apprehension and anxious arousal. Psychophysiology. 1999;36:628–637. doi: 10.1017/S0048577299972013. [DOI] [PubMed] [Google Scholar]
- Ochsner KN, Ray RD, Cooper JC, Robertson ER, Chopra S, Gabrieli JDE, et al. For better or for worse: Neural systems supporting the cognitive down- and up-regulation of negative emotion. NeuroImage. 2004;23:483–499. doi: 10.1016/j.neuroimage.2004.06.030. [DOI] [PubMed] [Google Scholar]
- Pessoa L, Padmala S. Quantitative prediction of perceptual decisions during near-threshold fear detection. Proceedings of the National Academy of Sciences. 2005;102:5612–5617. doi: 10.1073/pnas.0500566102. [DOI] [PMC free article] [PubMed] [Google Scholar]
- Petrides M. The role of the mid-dorsolateral prefrontal cortex in working memory. Experimental Brain Research. 2000;133:44–54. doi: 10.1007/s002210000399. [DOI] [PubMed] [Google Scholar]
- Petrides M. Lateral prefrontal cortex: Architectonic and functional organization. Philosophical Transactions of the Royal Society B. 2005;360:781–795. doi: 10.1098/rstb.2005.1631. [DOI] [PMC free article] [PubMed] [Google Scholar]
- Phan KL, Wager T, Taylor SF, Liberzon I. Functional neuroanatomy of emotion: A meta-analysis of emotion activation studies in PET and fMRI. NeuroImage. 2002;16:331–348. doi: 10.1006/nimg.2002.1087. [DOI] [PubMed] [Google Scholar]
- Pizzagalli DA, Nitschke JB, Oakes TR, Hendrick AM, Horras KA, Larson CL, et al. Brain electrical tomography in depression: The importance of symptom severity, anxiety, and melancholic features. Biological Psychiatry. 2002;52:73–85. doi: 10.1016/S0006-3223(02)01313-6. [DOI] [PubMed] [Google Scholar]
- Pizzagalli DA, Pascual-Marqui RD, Nitschke JB, Oakes TR, Larson CL, Abercrombie HC, et al. Anterior cingulate activity as a predictor of degree of treatment response in major depression: Evidence from brain electrical tomography analysis. American Journal of Psychiatry. 2001;158:405–415. doi: 10.1176/appi.ajp.158.3.405. [DOI] [PubMed] [Google Scholar]
- Reid SA, Duke LM, Allen JJB. Resting frontal electroencephalographic asymmetry in depression: Inconsistencies suggest the need to identify mediating factors. Psychophysiology. 1998;35:389–404. doi: 10.1017/S0048577298970986. [DOI] [PubMed] [Google Scholar]
- Sanderson WC, DiNardo PA, Rapee RM, Barlow DH. Syndrome comorbidity in patients diagnosed with a DSM-III-R anxiety disorder. Journal of Abnormal Psychology. 1990;99:308–312. doi: 10.1037//0021-843x.99.3.308. [DOI] [PubMed] [Google Scholar]
- Seghier ML. Laterality index in functional MRI: Methodological issues. Magnetic Resonance Imaging. 2008;26:594–601. doi: 10.1016/j/mri.2007.10.010. [DOI] [PMC free article] [PubMed] [Google Scholar]
- Sherbourne CD, Wells KB. Course of depression in patients with comorbid anxiety disorders. Journal of Affective Disorders. 1997;43:245–250. doi: 10.1016/S0165-0327(97)01442-0. [DOI] [PubMed] [Google Scholar]
- Silton RL, Heller W, Towers DN, Engels AS, Edgar JC, Spielberg JM, et al. Depression and anxiety distinguish frontocingulate cortical activity during top-down attentional control. doi: 10.1037/a0023204. Under review. [DOI] [PMC free article] [PubMed] [Google Scholar]
- Toglia MP, Battig WF. Handbook of semantic word norms. Hillsdale, NJ: Erlbaum; 1978. [Google Scholar]
- Ward DB. Simultaneous inference for FMRI data. [accessed July 27, 2006];2000 http://afni.nimh.nih.gov./pub/dist/doc/manual/AlphaSim.pdf.
- Watson D, Clark LA, Weber K, Assenheimer JS, Strauss ME, McCormick RA. Testing a tripartite model: II. Exploring the symptom structure of anxiety and depression in student, adult, and patient samples. Journal of Abnormal Psychology. 1995;104:15–25. doi: 10.1037/0021-843X.104.1.15. [DOI] [PubMed] [Google Scholar]
- Watson D, Weber K, Assenheimer JS, Clark LA, Strauss ME, McCormick RA. Testing a tripartite model: I. Evaluating the convergent and discriminant validity of anxiety and depression symptom scales. Journal of Abnormal Psychology. 1995;104:3–14. doi: 10.1037/0021-843X.104.1.3. [DOI] [PubMed] [Google Scholar]
- Woolrich MW, Ripley BD, Brady M, Smith SM. Temporal autocorrelation in univariate linear modeling of fMRI data. NeuroImage. 2001;14:1370–1386. doi: 10.1006/nimg.2001.0931. [DOI] [PubMed] [Google Scholar]