

Abstract
Computational protein-protein docking is a valuable tool for determining the conformation of complexes formed by interacting proteins. Selecting near-native conformations from the large number of possible models generated by docking software presents a significant challenge in practice.
We introduce a novel method for ranking docked conformations based on the degree of overlap between the interface residues of a docked conformation formed by a pair of proteins with the set of predicted interface residues between them. Our approach relies on a method, called PS-HomPPI, for reliably predicting protein-protein interface residues by taking into account information derived from both interacting proteins. PS-HomPPI infers the residues of a query protein that are likely to interact with a partner protein based on known interface residues of the homo-interologs of the query-partner protein pair, i.e., pairs of interacting proteins that are homologous to the query protein and partner protein. Our results on Docking Benchmark 3.0 show that the quality of the ranking of docked conformations using our method is consistently superior to that produced using ClusPro cluster-size-based and energy-based criteria for 61 out of the 64 docking complexes for which PS-HomPPI produces interface predictions. An implementation of our method for ranking docked models is freely available at: http://einstein.cs.iastate.edu/DockRank/.
Keywords: Protein-protein docking, docking scoring function
1. Introduction
Protein-protein interactions play an important role in many biological systems, forming the physical basis for formation of complexes and pathways that carry out different cellular processes. The 3D structures of interacting proteins can provide valuable residue and atomic level information regarding the details of protein-protein interface. Because of the expense and effort associated with X-ray crystallography or NMR experiments to determine 3D structures of protein complexes, there is significant interest in computational tools, such as docking methods that can reliably predict the 3D configuration of two or more interacting proteins. Docking is often used to gain insights into the structural and biophysical bases of protein-protein interactions, to validate protein-protein interactions determined using high throughput methods such as yeast-2-hybrid assays, and to identify and prioritize drug targets in computational drug design. The computational cost of exploring the large potential conformation space of complexes formed by a pair of proteins is high, and the development of an accurate universal scoring function to select near-native conformations is still challenging [1]. Recently, there has been increasing interest in exploiting knowledge of the actual or predicted interface residues between a pair of proteins to constrain the search space of docked configurations to those that are consistent with the predicted interfaces (thus improving the computational efficiency of docking) [2]. In this study, we test whether knowledge of predicted interface residues can also improve the reliability of the ranking of conformations obtained using docking software.
Given a pair of protein structures to be docked, widely used docking methods, such as ClusPro [3-6], generate hundreds of candidate conformations. Selecting near-native conformations from the large number of possible models generated by docking software presents a significant challenge in practice. Current approaches to identifying near-native conformations typically rely on energy-based criteria (e.g., lowest energy, center energy).However, such energy-based rankings of conformations often fail to rank native conformations above most others, for a majority of complexes included in the Docking Benchmark 3.0 [7]. Hence, there is a compelling need for computationally efficient methods capable of reliably distinguishing near-native docked conformations from the large number of candidate conformations typically produced by docking software.
Against this background, we introduce a novel method for ranking docked conformations based on the degree of overlap between the set of interface residues defined by a docked conformation of a pair of proteins with the set of computationally predicted interface residues between them. This approach requires a simple and robust method for predicting the interface residues between a pair of proteins. We used our recently developed method, PS-HomPPI [8], for predicting interface residues for a pair of interacting proteins. While a broad range of computational methods for prediction of protein-protein interfaces have been proposed in the literature (see [9] for a review) barring a few exceptions [10-12] the vast majority of such methods focus on predicting the protein-protein interface residues of a query protein, without taking into account its specific interacting partner(s). Given a set of docked models, our method utilizes a scoring function based on the overlap between the interface residues predicted by PS-HomPPI and the interface residues in the corresponding docked conformations. Intuitively, the docked model with the greatest overlap of interface residues with the predicted interface residues is assigned the highest score and consequently the top rank. Using the Docking Benchmark 3.0, we show that the performance of this method is superior to the use of ClusPro cluster-size-based and energy-based criteria for ranking docked conformations.
2. Methods
2.1 Dataset
Docking Benchmark 3.0 consists of a set of non-redundant transient complexes (3.25 Å or better resolution, determined using X-ray crystallography) from three biochemical categories: enzyme-inhibitor, antibody-antigen, and “others”. This dataset includes complexes that are categorized into three difficulty groups for benchmarking docking algorithms: Rigid-body (88 complexes), Medium (19), and Difficult (17), based on the conformational change upon binding. There are 108, 25, and 21 interacting pairs of proteins in the three groups, respectively. 2VIS (rigid-body) cannot be processed by Cluspro and was deleted. 1K4C (rigid-body), 1FC2 (rigid-body), 1N8O (rigid-body) were deleted because the bound complexes and the corresponding unbound complexes have different number of chains. 1K74 (rigid-body) was deleted because the sequence of chain D in the bound complex is different from the corresponding unbound chain 1ZGY_B. There are finally 119 docking complexes: Rigid-body (83 complexes), Medium (19), and Difficult (17).
Surface residues are defined as residues that have a relative solvent accessible area (RASA) of at least 5% [13]. Interface residues are defined as surface residues that have at least one atom that is within 4 Å distance from any of the atoms of residues in another chain. Interface information is extracted from ProtInDB http://protInDB.cs.iastate.edu. Out of 119 docking complexes, we used 64 complexes for which PS-HomPPI returns predicted interfaces for at least one chain.
2.2 Ranking Protein-Protein Docking Models
PDB files of unbound proteins in Docking Benchmark 3.0 were submitted to Cluspro 2.0 [3, 4, 6, 14], which is one of the best – performing docking servers based on the results of a recent CAPRI prediction competition. For each docking case1, ClusPro typically outputs 20-30 representative docking models. Each representative model is chosen from a cluster of docked models. Given the docked models of a pair of proteins, A and B, we use PS-HomPPI [8] to predict the interface residues between A and B. We then compare the interface residues between A and B predicted by PS-HomPPI2 with the interface residues between A and B in each of the conformations of the complex A-B produced by the docking program. The docked conformation with the greatest overlap of interface residues with the predicted interface residues is assigned the top rank.
2.2.1 Interface Similarity
Given a docked conformation A:B returned by ClusPro, we calculated: (1) the similarity between the predicted interface residues of A with B and the interface residues of A with B in the docked conformation, and (2) the similarity between the predicted interface residues of B with A and the interface residues of B with A in the docked conformation. Their average was used as the similarity between the predicted interface of A with B and the interface of A with B in the docked model (see below for details). We encode the interfaces of A as a binary sequence where 1 denotes an interface residue, and 0 denotes a non-interface residue. Many similarity measures for binary vectors have been proposed (See [15] for a review). Among these, only Russell-Rao, SoKal-Michener and Rogers-Tanmoto(-a) measures are defined in the case when both sequences consist of all 0 elements (which is the case when there are no interface residues observed between the corresponding protein chains, and both PS-HomPPI and the docking model correctly predict no interface residues). Because the numbers of interface and non-interface residues are highly unbalanced, we used weighted SoKal-Michener metric to measure the similarity between the interface and non-interface residues in a protein chain A (with chain B) encoded in the form of binary sequences ABP and ABD based on PS-HomPPI predictions and the docked conformation, respectively,
where S11 and S00 are the numbers of positions where the two sequences match with respect to interface residues and non-interface residues, respectively, and β is a weighting factor, 0 ≤ β ≤ 1, that is used to balance the number of matching interface residues against the number of matching non-interface residues, and N is the total number of residues of protein A When a protein consists of multiple chains, the interface similarities were calculated and averaged by pairing each chain of the first protein with each chain of the second protein. We calculated the weighting factor β for each docking case. For example, for docking a protein consisting of a single chain A with a protein consisting of two chains, B and C:
where “# int of A|A:B” denotes the number of interface residues in chain A computed from the interaction between A with B.
2.2.2 Performance Evaluation
We used the experimentally-determined structures of bound complexes as the “gold standard” to evaluate our ranking of docked models. The similarity between interfaces of a bound complex and the interfaces of docking models was used to produce the Gold Ranking score3. For each docking case we compute five different rankings: Gold Rank, PS-HomPPI based rank (both computed using the procedure described above), lowest energy rank (which ranks conformations by assigning higher ranks to lower energy conformations), center energy rank, and ClusPro rank (computed by ClusPro). The last three ranking scores were obtained from the ClusPro Server. ClusPro ranks each docking model based on the size of the cluster of conformations to which the model belongs. ClusPro also provides two types of docking energies: the lowest energy among the conformations within a cluster of conformations, and the center energy of a cluster of conformations.
We denote each ranking of a set of conformations by a vector of integers in which the positions of the vector are indexed by the conformations and the corresponding element of the vector denotes the rank of the conformation (ranging from 1 to the number of docked models or conformations being ranked). One way to compare rankings is to generate scatter plots of one ranking against another. A scatter plot with most of the points along the diagonal would correspond to the case in which two different ranking methods for a given set of conformations largely agree. Scatter plots for all docking cases considered in this study are available as supplementary materials at: http://einstein.cs.iastate.edu/DockRank/supplementaryData/scatterPlots.pdf From these plots, we observed that the ranking of predicted interfaces by PS-HomPPI (our proposed ranking method) is highly correlated with the ranking based on the actual interfaces of the bound complex (Gold Rank), whereas the ranking based on the lowest energy or the center energy returned by ClusPro shows little correlation with Gold Rank.
An alternative measure for quantitatively evaluating the similarity between two rankings is the correlation coefficient of two ranking vectors or R2 of the regression of the scatter plot. However, this measure suffers from a serious limitation because it does not distinguish between incorrect ordering of top-ranking models as opposed to incorrect ordering of bottom-ranking models. Consider a docking case with a total of 30 docked models. Suppose a model with rank 1 has the greatest similarity of interface residues to the actual bound complex, and a model with rank 30 has the most dissimilar interface. In this case, correctly selecting (ranking) the top ranking models (ranks 1, 2, 3…) is more important than correctly ranking the bottom ranking models (ranks 28, 29, 30…).
To deal with this limitation, we used a normalized Chi-square statistic to quantitatively measure the similarity between two rankings. Normalized Chi-square is defined as:
where m is the number of models to be ranked for a given docking case.
χ2 follows the conventional definition:
where Ei is the Gold Rank associated with the ith conformation, Oi is the rank assigned to the same conformation by a ranking scheme that we want to compare with the Gold Ranking scheme. χ2 offers a natural measure of the similarity of rankings. Its denominator Ei provides a means of assigning higher weight to conformations that are ranked close to the top of the list according to the Gold Ranking scheme (corresponding to small values of Ei) compared to those that are ranked close to the bottom of the list according to the Gold Ranking scheme (corresponding to larger values of Ei ). Because different docking complexes have different numbers of docked models, we normalize χ2 by the number of models to obtain norm_χ2. The smaller the value of norm_χ2, the more similar the ranking under consideration is to the ranking produced by the Gold Rank.
For each docking case, we calculated four norm_χ2 for the rankings from PS-HomPPI, Lowest Energy, Center Energy, and ClusPro (Figure 1). We compared these four ranking schemes using the respective values of norm_χ2. The best ranking scheme corresponds to that with the smallest value of norm_χ2, and the worst ranking scheme has the largest value of norm_χ2 (relative to the Gold Ranking scheme).
Figure 1.
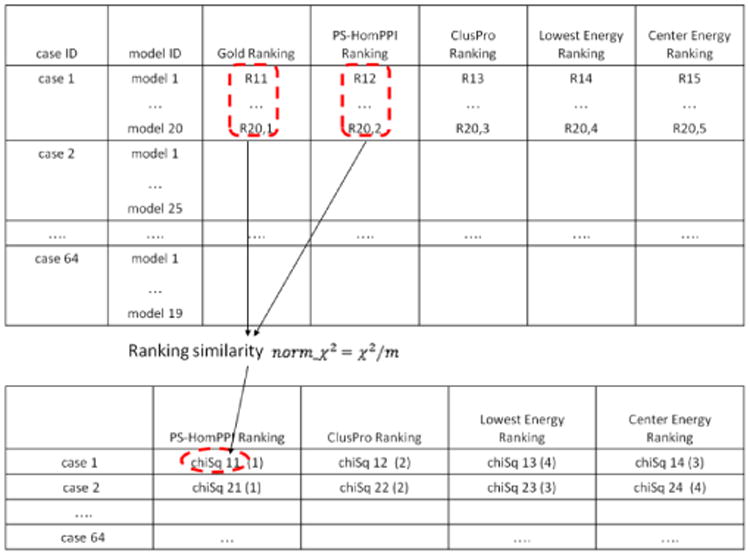
Comparison of ranking schemes. The numbers between parentheses in the bottom table are the ranks of normalized Chi-square values computed for each docking case
3. Results and Discussion
3.1 Ranking of Docked Models
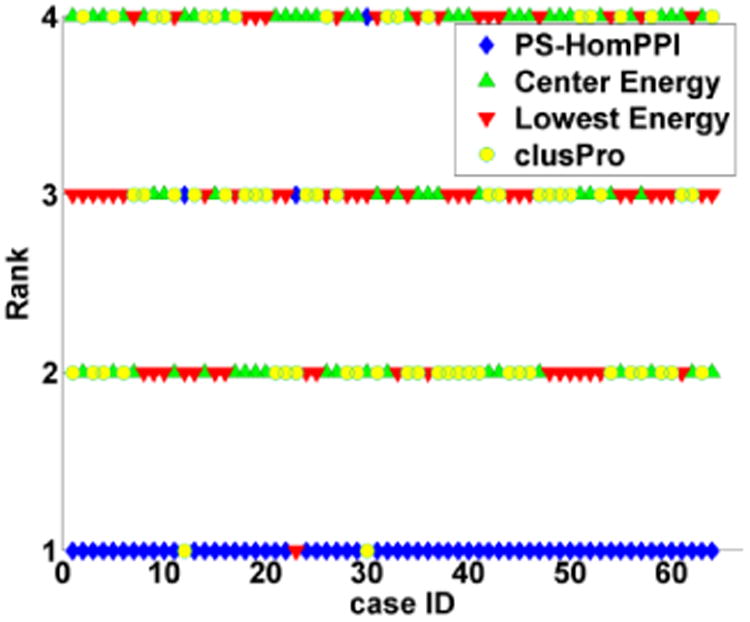
Figure 2 shows a plot of the ranking of norm_χ2 (relative to Gold Ranking) value for PS-HomPPI, Lowest Energy, Center Energy based and ClusPro's cluster size based rankings for each dockingcase. We observe that the PS-HomPPI based ranking scheme consistently yields the lowest norm_χ2 in 95% of the docking cases for which whose interface residues can be predicted by PS-HomPPI (61 out of 64). In other words, the PS-HomPPI based ranking of docked models is consistently superior to ranking of docked models based on Lowest Energy, Center Energy and model cluster size (schemes used by ClusPro).
Figure 2. The ranking of norm_χ2 from PS-HomPPI, Lowest Energy, Center Energy, and ClusPro for 61 docking cases.
To determine whether our proposed PS-HomPPI based scoring function significantly outperforms other scoring functions considered in this study, we chose to apply a multiple hypothesis non-parametric test [16] using the normalized Chi-square value as the performance metric. First, the scoring methods being compared were ranked on the basis of their observed normalized Chi-square on each case (see Figure 1). The overall performance of each method was defined as the average rank over all of the docking cases. Figure 3 shows that PS-HomPPI based method for ranking docked models has the best average rank of 1.11 while Center Energy, Lowest Energy, and ClusPro scoring methods have average ranks 3.17, 2.94, and 2.78 (respectively). As noted by Demsar [16], the average ranks by themselves provide a reasonably fair comparison of scoring methods. We applied the Friedman test to determine whether the measured average ranks are significantly different from the mean rank under the null hypothesis. Our analysis shows that the null hypothesis could be rejected with high confidence (p < 0.0001). We also applied the Nemenyi test to determine whether the observed differences in the ranks of any given pair of ranking schemes are statistically significant. The critical difference determined by Nemenyi test at a significance level of 0.05 is 0.59. Hence, the difference between any pair of docking scoring methods is statistically significant provided the difference between their corresponding average ranks is more than 0.59. Figure 3 summarizes the results of Nemenyi pairwise comparison of the different docking scoring methods considered in our experiments using the Nemenyi test. The results suggest that at a significance level of 0.05 there is no observed difference between the performance of Center Energy, Lowest Energy, and ClusPro scoring methods. However, the difference in performance of the PS-HomPPI based scoring method and each of the other methods is statistically significant. We conclude that the performance of the PS-HomPPI based method for scoring docking models is superior to that of the other scoring methods considered in this study.
Figure 3.
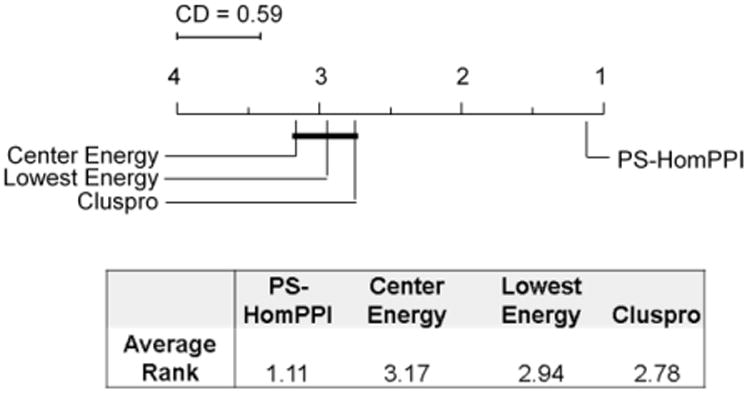
Pair-wise comparisons of different docking scoring methods using Nemenyi test. Methods that are not significantly different (at significant level α=0.05) are grouped together (via connecting lines). The average “rank” of each method over docking cases is shown in the table (and also on the x-axis of the plot).
Supplementary Material
Acknowledgments
This work was funded in part by the National Institutes of Health grant GM066387 to Vasant Honavar and Drena Dobbs and in part by a research assistantship funded by the Center for Computational Intelligence, Learning, and Discovery. The authors sincerely thank Scott Boyken for inspiring discussions and Usha Muppirala for providing Cluspro docking results. The work of Vasant Honavar while working at the National Science Foundation was supported by the National Science Foundation. Any opinion, finding, and conclusions contained in this article are those of the authors and do not necessarily reflect the views of the National Science Foundation.
Footnotes
Each docking case in Docking Benchmark 3.0 consists of one bound complex, one receptor (unbound) and one ligand (unbound).
To objectively assess our method, if both sides of a homologous pair share ≥ 95% sequence identity and are from the same species as the query protein pair, these proteins are removed from the homologous protein pairs used to infer interfaces of the query protein pairs.
Note that when a pair of chains in a bound complex has no interface residues between them, any docked model that has interface residues between the corresponding chains is assigned a lower rank than the conformations that do not have interface residues between the corresponding chains.
Contributor Information
Li C. Xue, Email: lixue@iastate.edu.
Rafael A. Jordan, Email: rjordan@iastate.edu.
Yasser EL-Manzalawy, Email: yasser@iastate.edu.
Drena Dobbs, Email: ddobbs@iastate.edu.
Vasant Honavar, Email: honavar@iastate.edu.
References
- 1.Huang SY, Grinter SZ, Zou X. Scoring functions and their evaluation methods for protein-ligand docking: recent advances and future directions. Physical Chemistry Chemical Physics. 2010;12:12899–12908. doi: 10.1039/c0cp00151a. [DOI] [PMC free article] [PubMed] [Google Scholar]
- 2.van Dijk AD, de Vries SJ, Dominguez C, Chen H, Zhou HX, Bonvin AM. Data-driven docking: HADDOCK's adventures in CAPRI. Proteins. 2005 Aug 1;60:232–8. doi: 10.1002/prot.20563. [DOI] [PubMed] [Google Scholar]
- 3.Kozakov D, Hall DR, Beglov D, Brenke R, Comeau SR, Shen Y, Li K, Zheng J, Vakili P, Paschalidis I, Vajda S. Achieving reliability and high accuracy in automated protein docking: ClusPro, PIPER, SDU, and stability analysis in CAPRI rounds 13-19. Proteins. 2010 Nov 15;78:3124–30. doi: 10.1002/prot.22835. [DOI] [PMC free article] [PubMed] [Google Scholar]
- 4.Comeau SR, Gatchell DW, Vajda S, Camacho CJ. ClusPro: a fully automated algorithm for protein-protein docking. Nucleic Acids Res. 2004 Jul 1;32:W96–9. doi: 10.1093/nar/gkh354. [DOI] [PMC free article] [PubMed] [Google Scholar]
- 5.Comeau SR, Gatchell DW, Vajda S, Camacho CJ. ClusPro: an automated docking and discrimination method for the prediction of protein complexes. Bioinformatics. 2004 Jan 1;20:45–50. doi: 10.1093/bioinformatics/btg371. [DOI] [PubMed] [Google Scholar]
- 6.Kozakov D, Brenke R, Comeau SR, Vajda S. PIPER: an FFT-based protein docking program with pairwise potentials. Proteins. 2006 Nov 1;65:392–406. doi: 10.1002/prot.21117. [DOI] [PubMed] [Google Scholar]
- 7.Hwang H, Pierce B, Mintseris J, Janin J, Weng Z. Protein-protein docking benchmark version 3.0. Proteins. 2008 Nov 15;73:705–9. doi: 10.1002/prot.22106. [DOI] [PMC free article] [PubMed] [Google Scholar]
- 8.Xue LC, Dobbs D, Honavar V. HomPPI: Homologous Sequence-Based Protein-Protein Interface Prediction. BMC Bioinformatics. doi: 10.1186/1471-2105-12-244. In press. [DOI] [PMC free article] [PubMed] [Google Scholar]
- 9.Ezkurdia I, Bartoli L, Fariselli P, Casadio R, Valencia A, Tress ML. Progress and challenges in predicting protein-protein interaction sites. Brief Bioinform. 2009 May;10:233–46. doi: 10.1093/bib/bbp021. [DOI] [PubMed] [Google Scholar]
- 10.Tuncbag N, Kar G, Keskin O, Gursoy A, Nussinov R. A survey of available tools and web servers for analysis of protein-protein interactions and interfaces. Brief Bioinform. 2009 May;10:217–32. doi: 10.1093/bib/bbp001. [DOI] [PMC free article] [PubMed] [Google Scholar]
- 11.Wang H, Segal E, Ben-Hur A, Li QR, Vidal M, Koller D. InSite: a computational method for identifying protein-protein interaction binding sites on a proteome-wide scale. Genome Biol. 2007;8:R192. doi: 10.1186/gb-2007-8-9-r192. [DOI] [PMC free article] [PubMed] [Google Scholar]
- 12.Chung JL, Wang W, Bourne PE. High-throughput identification of interacting protein-protein binding sites. BMC Bioinformatics. 2007;8:223. doi: 10.1186/1471-2105-8-223. [DOI] [PMC free article] [PubMed] [Google Scholar]
- 13.Porollo A, Meller J. Prediction-based fingerprints of protein-protein interactions. Proteins. 2007 Feb 15;66:630–45. doi: 10.1002/prot.21248. [DOI] [PubMed] [Google Scholar]
- 14.Vajda S, Kozakov D. Convergence and combination of methods in protein-protein docking. Curr Opin Struct Biol. 2009 Apr;19:164–70. doi: 10.1016/j.sbi.2009.02.008. [DOI] [PMC free article] [PubMed] [Google Scholar]
- 15.Zhang B, Srihari S. Discovery of the tri-edge inequality with binary vector dissimilarity measures. Proceedings of the 17th International Conference on Pattern Recognition (ICPR 2004); Cambridge, England. Aug, 2004. pp. 669–672. [Google Scholar]
- 16.Demsar J. Statistical Comparisons of Classifiers over Multiple Data Sets. Journal of Machine Learning Research. 2006;7:1–30. [Google Scholar]
Associated Data
This section collects any data citations, data availability statements, or supplementary materials included in this article.